16 February 2015
4QCY14 Results Update | Sector:
Automobiles
Eicher Motors
BSE SENSEX
29,136
Bloomberg
Equity Shares (m)
M.Cap. (INR b) / (USD b)
52-Week Range (INR)
1, 6, 12 Rel. Per (%)
Avg Val (INR M)/Vol
Free float (%)
S&P CNX
8,809
EIM IN
27.1
435.0/7.0
16,895/4,810
1/49/189
506/47
45.0
CMP: INR16,109
TP: INR17,674 (+10%)
Buy
Above estimate driven by VECV; RE on track for 0.45m in CY15
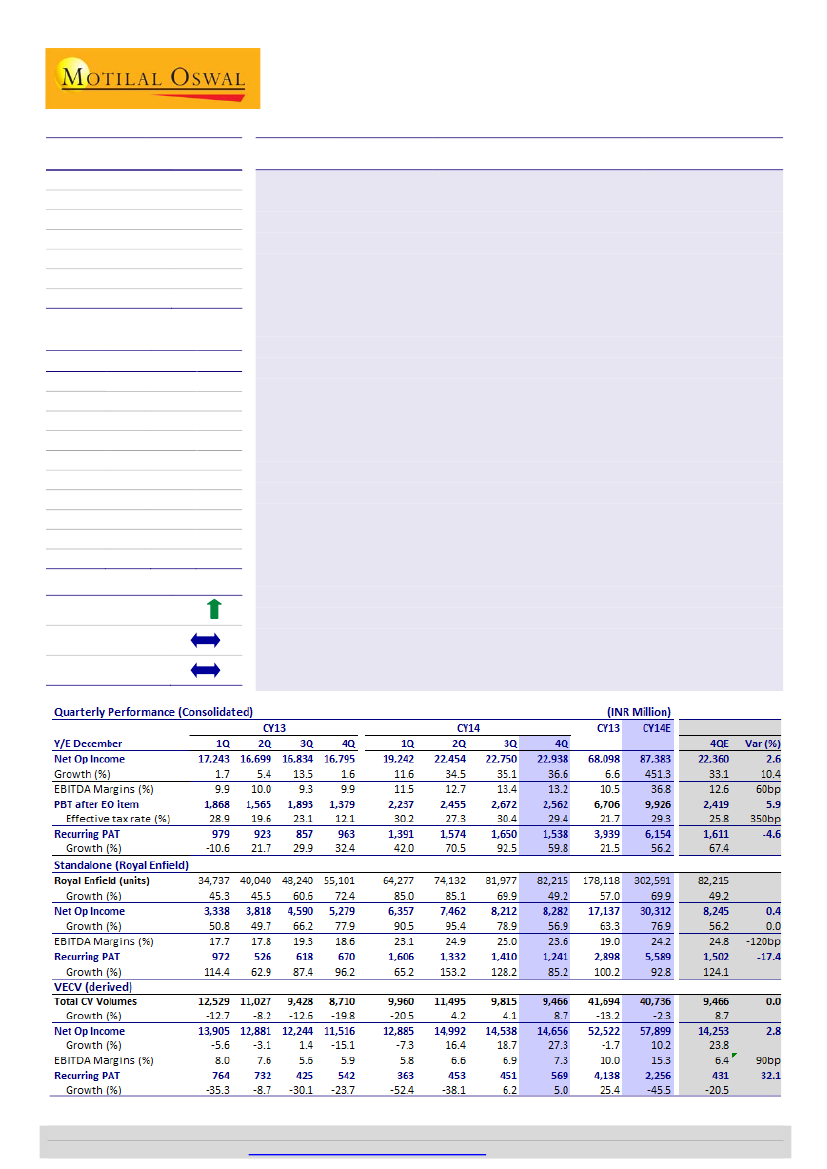
Consolidated operating performance was above estimate driven by a beat in EBITDA
margin to 13.2% (v/s est. 12.6%). EBITDA was at INR3.03b (v/s est. INR2.8b) driven
by strong VECV performance but diluted by weaker RE performance. Tax rate was
higher at 29.4% (v/s est. 25.8%), resulting in PAT of INR1.54b (v/s est. INR1.6b),
growth of 60% YoY (-7% QoQ).
Royal Enfield performance below estimate:
While volumes and realization both
grew 49% and ~5% YoY respectively, EBITDA margin was lower at 23.6% (v/s est.
~24.8%) on account of higher other expenses (up 120bp QoQ). Higher tax rate at
33% further restricted PAT to INR1.24b.
VECV’s strong realizations and EBITDA margin:
VECV’s realizations improved ~4.5%
QoQ (17% YoY) to ~INR1.55m (v/s est. ~INR1.5m). EBITDA margin of 7.3% (+40bp
QoQ, +140bp YoY) was above our expectation of 6.4%.
Earnings call highlights:
1) EIM expects producible capacity of ~450,000 in CY15
(largely from old plant + phase 1 of Oragadam plant), although ramp-up would not
be linear. Oragadam phase 2 capacity to start operations from 3QCY15 and on full
ramp-up, will increase production to ~60,000/month by mid-CY16, 2) currently, RE
enjoys around five-month waiting period, 3) investing in two technology centers --
main center at Chennai (to be ready by 2QCY16) and satellite center at UK (by end-
CY15), 3) price increase of 2% in January 2015, along with ~4% excise duty increase
and 4) capex (CY15): Royal Enfield - INR5b (including R&D and front-end stores etc)
and VECV ~INR5b.
Valuation and view:
We raise CY15E/16E/17E EPS by 5.2%/5.6%/2.4% respectively.
EIM trades at 39.2x/24.4x CY15E/16E EPS of INR411/660 respectively. Maintain
Buy
with a target price of INR17,674 (CY16E SOTP-based).
Financials & Valuation (INR Billion)
Y/E Dec
Net Sales
EBITDA
Adj PAT
EPS (INR)
Gr. (%)
RoE (%)
RoCE (%)
P/E (x)
P/BV (X)
2015E
130.0
19.8
11.1
411
74.6
39.2
42.6
39.2
13.1
2016E
183.6
32.0
17.8
659.6
60.5
1,825
43.2
51.1
24.4
8.8
2017E
218.4
37.6
21.5
796.5
20.8
2,553
36.4
43.9
20.2
6.3
BV/Sh.(INR) 1,226
Estimate change
TP change
Rating change
5%
Jinesh Gandhi
(Jinesh@MotilalOswal.com); +91 22 3982 5416
Investors are advised to refer through disclosures made at the end of the Research Report.
Motilal Oswal research is available on
www.motilaloswal.com/Institutional-Equities,
Bloomberg, Thomson Reuters, Factset and S&P Capital.

Eicher Motors
Consolidated performance: Operationally above estimate driven by VECV
Eicher Motors consolidated revenues grew 36.6% YoY (0.8% QoQ) to INR22.95b
(above est).
EBITDA margins improved by 330bp YoY (-20bp QoQ) to 13.2% (est 12.6%)
driven by better than expected operational performance at VECV partly offset
by below estimate performance of RE.
EBITDA grew 82% YoY (-0.7% QoQ) to ~INR3.03b.
Higher tax rate restrict PAT (after minority) growth to ~60% YoY (-6.8% QoQ) to
INR1.54b.
Royal Enfield: Operating Performance below estimate
Royal Enfield continued with its strong volume growth of 49% YoY (flat QoQ) to
~82k units.
Realization improved by 5% YoY(+0.6% QoQ) to INR 100.7k (v/s est ~INR100.3k).
As a result, revenues grew 57% YoY (+1% QoQ) to INR8.3b (v/s est INR8.25b).
EBITDA margins came in lower at 23.6% (v/s est ~24.8%) on account of higher
other expenses (up 120 bp QoQ).
Higher tax at 33% (v/s est ~25%) further restricted PAT to INR1.24b (v/s est
INR1.5b), a growth of 85% YoY (-12% QoQ).
Exhibit 1: RE Net realization at all time high of INR 100.7k/unit
Royal Enfield Realizations (INR)
Source: Company, MOSL
Exhibit 2: Strong volume growth driven by production ramp-
up
Exhibit 3: Margins decline on QoQ basis
Royal Enfield volumes (units)
56.6
48.6
Growth YoY %
85.085.1
72.4
69.9
68.2
60.6
49.2
48.149.7
45.345.5
40.8
Royal Enfield EBITDA margins %
17.8
18.6
19.3
25.023.6
24.9
13.0
12.8
15.3
9.2
13.9
23.1
13.3
36.2
28.4
11.5
17.7
15.1
Source: Company, MOSL
16 February 2015
2

Eicher Motors
Exhibit 4: Standalone Quarterly Performance (Royal Enfield)
Y/E December
Royal Enfield (units)
Growth (%)
Net Realizations
(INR/unit)
Change - QoQ (%)
Net Op Income
Growth (%)
RM Cost (%)
Staff Cost (%)
Other Exp (%)
EBITDA
EBITDA Margins (%)
Depreciation
Other income
Interest cost
PBT before EO item
Effective tax rate (%)
Recurring PAT
Growth (%)
CY13
1Q
2Q
3Q
4Q
34,737 40,040 48,240 55,101
45.3 45.5 60.6 72.4
96,094 95,360 95,143 95,802
3.5
-0.8
-0.2
0.7
3,338 3,818 4,590 5,279
50.8 49.7 66.2 77.9
63.3 64.1 61.4 61.0
7.0
7.1
6.1
6.1
12.0 10.9 13.2 14.3
591
681
885
981
17.7 17.8 19.3 18.6
60
75
80
89
682
77
21
21
1
0
1
1
1,212
682
826
911
19.8 22.9 25.2 26.5
972
526
618
670
114.4 62.9 87.4 96.2
1Q
64,277
85.0
CY14
2Q
3Q
74,132 81,977
85.1
69.9
CY13
CY14E
4QE
82,215
49.2
Var (%)
0.0
4Q
82,215 178,118 302,591
49.2
57.0
69.9
98,905 100,657 100,168 100,730
3.2
1.8
-0.5
0.6
6,357
7,462
8,212
8,282
90.5
95.4
78.9
56.9
61.3
59.4
59.1
59.1
5.5
5.4
5.1
5.3
10.1
10.2
10.8
12.0
1,468
1,861
2,052
1,955
23.1
24.9
25.0
23.6
109
115
128
149
849
135
128
51
11
1
1
5
2,197
1,881
2,051
1,852
26.9
29.1
31.3
33.0
1,606
1,332
1,410
1,241
65.2
153.2
128.2
85.2
0.4
96,211 100,175
100,285
4.0
0.0
0.4
17,137 30,312
8,245
63.3
76.9
56.2
10bp
61.8
59.6
59.0
0bp
6.5
5.3
5.3
12.7
10.9
10.9 110bp
-4.6
3,250
7,336
2,048
19.0
24.2
24.8
3.2
304
502
144
-46.7
801
1,163
96
54.8
3
17
3
-7.2
3,744
7,980
1,996
22.6
30.0
24.8 820bp
-17.4
2,898
5,589
1,502
100.2
92.8
124.1
Source: Company, MOSL
VECV (CV business): Operating performance continues to improve
Volumes grew 8.7% YoY (-3.6% QoQ) driven primarily by strong growth of ~38%
YoY HD (Goods) and exports showing growth of ~33.5% YoY. While underlying
market showing early signs of improvement.
Realizations improved 17.1% YoY (+4.5% Qoq) to INR1.54m/unit.
Revenues showed a robust growth of ~27% YoY (0.8% QoQ) to INR14.66b (v/s
est INR14.25b).
EBITDA margins improved 40bp QoQ (140bp YoY) to 7.3% (v/s est of 6.4%)
driven by lower than estimated RM and Staff cost.
Lower tax rate of 19.8% (v/s est 23.2%) further boosted PAT to INR569m (v/s est
INR431m) growth of 5% YoY (26.3% QoQ).
Exhibit 6: Margins improved to 7.3% QoQ well above
estimate of 6.4%
Growth YoY %
11.5
10.1 9.7
9.2
7.6
10.1
5.8
6.2
8.0
7.6
5.6
5.9
6.6
5.8
6.9 7.3
VECV EBITDA margins %
Exhibit 5: Volume recovery continues
VECV volumes (units)
28.5
25.723.5
21.6
13.0
9.0
4.2 4.1
-20.5
-8.2 -25.4
-8.5
-14.1 -12.7 -12.6
8.7
Source: Company, MOSL
16 February 2015
3

Eicher Motors
Exhibit 7:
VECV: Quarterly Performance (derived)
Y/E December
4Q
Total CV Volumes
8,710
Growth (%)
-19.8
Net Realizations (INR
'000/unit)
1,110 1,168 1,299 1,322
Change - YoY (%)
8.0
5.5
16.1
5.8
Net Op Income
13,905 12,881 12,244 11,516
Growth (%)
-5.6
-3.1
1.4
-15.1
RM Cost (%)
71.0
71.6
71.7
68.8
Staff Cost (%)
7.5
8.0
8.7
9.5
Other Exp (%)
13.5
12.8
14.1
15.8
EBITDA
1,114
981
687
685
EBITDA Margins (%)
8.0
7.6
5.6
5.9
Depreciation
215
221
256
305
Other income
170
134
131
125
Interest cost
6
12
22
36
PBT after EO item
1,064
882 1,068
468
Effective tax rate (%)
28.2
17.1
21.5
-15.7
Recurring PAT
764
732
425
542
Growth (%)
-35.3
-8.7
-30.1
-23.7
CY13
1Q
2Q
3Q
12,529 11,027 9,428
-12.7
-8.2
-12.6
CY14
1Q
2Q
9,960 11,495
-20.5
4.2
3Q
9,815
4.1
CY13
CY14E
4QE Var (%)
9,466 0.0
8.7
4QE
9,466 41,694 40,736
8.7
-13.2
-2.3
1,294 1,304 1,481 1,548 1,260 1,421
1,483 4.4
16.6
11.7
14.1
17.1
22.6
28.4
13.4
12,885 14,992 14,538 14,656 52,522 57,899
14,253 2.8
-7.3
16.4
18.7
27.3
-1.7
10.2
23.8
69.2
70.3
69.4
68.5
68.6 130.6
69.0 -50bp
9.3
8.6
8.8
8.4
8.0
16.5
9.2 -80bp
15.7
14.6
14.9
15.7
13.5
28.7
15.3 40bp
752
984 1,000 1,076 5,226 4,640
914 17.7
5.8
6.6
6.9
7.3
10.0
15.3
6.4 90bp
368
442
435
451
996 1,697
453 -0.5
113
43
64
100
589
-89
130 -23.5
48
10
8
15
76
81
30 -50.7
448
575
621
710 4,742 2,774
561 26.6
19.0
21.2
27.4
19.8
12.7
18.7
23.2 -340bp
363
453
451
569 4,138 2,256
431 32.1
-52.4
-38.1
6.2
5.0
25.4
-45.5
-20.5
Source: Company, MOSL
Key Takeaways from Con-Call
Royal Enfield
Investing in two technology centre viz a) main centre at Chennai (to be ready by
2QCY16) and b) satellite centre at UK (by end of CY15).
Efforts has been in creating team, talent pool and building organizational
capacity (including manpower capacity).
Price increase of 2% in Jan-15, along with ~4% excise duty increase.
Exports markets: While developed markets (US, UK, Europe etc) offers ready
markets with known brand, however developing market offers large opportunity
due to very large existing commuting motorcycle population, giving Royal
Enfield existing pool of bikers to tap into.
It expects producible capacity to ~ 450,000 in CY15 (largely from old plant +
phase-1 of Oragadam plant), although ramp-up wouldn’t be linear. Oragadam
Phase-2 capacity to start operations from 3QCY15 and on full ramp-up will
increase production to ~60,000/month by mid-CY16.
Currently, RE enjoys ~5 months waiting.
Dealership:
It ended CY14 with ~390 dealership (added ~100 dealers in CY14)
mad plans to add over 100 dealers in CY15. While it plans to expand distribution
network to tier2 cities and beyond, it also plans to increase catchment areas in
tier-1 cities. The new retail format was rolled out to over 100 stores in CY14. By
end of CY15, all stores (over 500 dealership) would be on new retail format.
Other takeaways
MDEP:
In 4QCY14, it shipped ~2600 engines/long blocks, and ~12000 units in
CY14.
Capex (CY15):
Royal Enfield - INR5b (incl R&D and frontend stores etc), and
VECV ~INR5b.
16 February 2015
4

Eicher Motors
Operating metrics
Snapshot of Revenue Model
000 units
ROYAL ENFIELD (S/A)
Total 2W (units)
Growth (%)
Net realn (INR'000/unit)
Growth (%)
RE Revenues (INR b)
Growth (%)
VECV
Dom - LMD
Growth (%)
% of CV Vols
Dom - HCV
Growth (%)
% of CV Vols
Total Dom.
Growth (%)
% of CV Vols
Exports
Growth (%)
% of CV Vols
Total CV vols
Growth (%)
MDEP Vols (Ex captive)
Net realn (INR'000/unit)
Growth (%)
VECV Revenues (INR b)
Growth (%)
Net Consol sales (INR b)
Growth (%)
CY11
75
41.9
89
7.1
50
26.8
37
19.9
77.1
8
81.9
16.5
45
27.5
93.6
3
14.4
6.4
48
26.6
1,029
2
50
26.8
57
29.5
CY12
113
52.0
92
3.0
53
5.9
36
-3.9
75.3
9
14.8
19.2
45
-0.6
94.5
3
-16.3
5.5
48
-1.6
1,111
8
53
5.9
64
11.6
CY13
178
57.0
95
2.7
51
-4.1
31
-13.3
76.1
7
-27.4
16.3
38
-16.1
92.3
3
20.1
7.7
41
-14.1
3
1,236
11
51
-4.1
68
6.6
CY14
303
69.9
100
5.4
57
11.3
28
-11.3
69.1
6
-2.4
16.3
34
-9.7
85.4
6
86.5
14.6
40
-2.3
12
1,401
13
57
11.3
87
28.3
CY15E
449
48.5
101
1.3
85
48.2
35
27.4
62.1
12
78.8
20.5
47
37.2
82.6
10
68.5
17.4
57
41.8
18
1,463
4
85
48.2
130
48.8
CY16E
628
39.8
103
2.6
119
40.1
45
27.5
58.5
17
47.8
22.4
62
32.6
80.9
15
48.8
19.1
76
35.4
25
1,511
3
119
40.1
184
41.2
16 February 2015
5

Eicher Motors
Valuation and view
RE volume momentum to further strengthen as focus shifts from production to
products:
Given its leadership position, cult brand equity and minimal
competition, RE is well positioned to benefit from improvement in consumer
sentiment and economic recovery. With confidence in managing capacities,
management’s focus has shifted to products and marketing process. It is now
focussing on expanding addressable market through new products and
expanding dealership (in sync with capacity expansion), at the same time
retaining aspirational value and brand ethos of RE. New models launch from
CY16/CY17 onwards. RE Exports scale-up to take 2-3 year, as it has just starting
work on its focus on Latin America and Asia. Added 100 dealers, would continue
to add 6-8 dealers/month. Every new dealership in new retail identity, and
working with existing dealer to shift to new format by CY15 (total of ~500 stores
by end of CY15). Acquired ~50 acres of land for new plant, which is being
planned for next round of capacity planning beyond CY16 (no plans to start work
in near future). This plant might have similar capacity as at Oragadam plant
(similar sized land). It would take 12 months from Day-Zero to start the plant.
We estimate 35%/50%/56% volumes/EBITDA/PAT CAGR over CY14-17E.
VECV well prepared for CV cycle recovery:
VECV recently launched its next
generation CVs developed with inputs from Volvo (including Volvo engine).
VECV expected to be key player to benefit from pick-up in Indian CV industry.
Globally, India is among the few markets where Volvo has low share. While Pro
series launch of LMD and HD range (big upgrade of existing platform) is largely
done. Pro series will help to ramp-up exports over next 2 years, with focus on
Africa and Asia. MDEP ramp-up continues with 12,000 units in CY14.We
estimate VECV’s sales/PAT to post 34%/98% CAGR (CY14-17E).
MDEP: An opportunity to be part of Volvo’s global supply chain:
MDEP holds
strategic importance for both the Volvo Group (low cost source of Euro 5/6
medium-duty engines) and VECV (improve VECV's positioning in HCVs with
headstart on futuristic technology). It provides an opportunity to be part of
Volvo’s global supply chain & tap other such opportunities.
Upgrading EPS:
We upgrade our CY15E/16E/17E EPS by 5.2%/5.6%/2.4%
respectively to factor in for a) growth in volumes for Royal Enfield (CAGR of 35%
over CY14-17E ) and b) Improved demand for VECV with recovery in economy .
Structural story gets stronger:
With several projects coming on stream in CY15-
17 driving 35% sales and 50% EBITDA CAGR over CY14-17E, EIM is at an
inflection point.
Buy with a target price of INR17,674 (CY16E SOTP-based).
16 February 2015
6

Eicher Motors
Exhibit 8: Revised forecast
(INR M)
Rev
Standalone (RE)
Volumes (units)
Net Sales
EBITDA
EBITDA (%)
Core Profit
Net Profit
EPS (INR)
VECV
Volumes (units)
Net Sales
EBITDA
EBITDA (%)
Core Profit
EPS (INR)
Consolidated
Net Sales
EBITDA (%)
Net Profit
EPS (INR)
57,818
84,592
8,180
9.7
4,307
99.5
130,007
15.3
11,113
411.0
56,404
79,658
7,152
9.0
3,512
84.2
124,593
14.9
10,566
390.8
2.5
6.2
14.4
70bp
22.7
18.2
4.3
30bp
5.2
5.2
78,471
118,549
14,750
12.4
8,867
198.2
183,623
17.4
17,835
659.6
75,920
106,539
12,545
11.8
7,167
164.7
170,619
17.2
16,896
624.9
3.4
11.3
17.6
70bp
23.7
20.3
7.6
20bp
5.6
5.6
91,839
137,605
16,556
12.0
9,672
223.6
218,430
17.2
21,536
796.5
88,751
127,813
14,959
11.7
8,605
199.3
3.5
7.7
10.7
30bp
12.4
12.2
449,441
45,624
11,879
26.0
7,834
9,038
334.3
444,995
45,137
11,636
25.8
7,709
8,898
329.1
1.0
1.1
2.1
30bp
1.6
1.6
1.6
628,284
65,368
17,546
26.8
11,611
13,233
489.4
622,060
64,355
17,128
26.6
11,431
13,180
487.4
1.0
1.6
2.4
20bp
1.6
0.4
0.4
755,154
81,177
21,371
26.3
14,028
16,387
606.0
747,686
79,645
20,971
26.3
13,967
16,524
611.1
1.0
1.9
1.9
0bp
0.4
(0.8)
(0.8)
CY15E
Old
Chg (%)
Rev
CY16E
Old
Chg (%)
Rev
CY17E
Old
Chg (%)
207,123
5.5
17.2
0bp
21,034
2.4
777.9
2.4
Source: Company, MOSL
Exhibit 9: SOTP Valuations
INR M
Royal Enfield
Core PAT (ex div & fin income)
Core Equity Value
@ 30x PE
Net Debt
Equity Value
VECV (@ 54.4% Economic interest)
EBITDA
EV
@ 10x EV/EBITDA
Net Debt
Equity Value
Total Equity Value
Target Price (INR/Sh)
Upside (%)
CY15E
7,834
235,018
-18,680
253,699
4,450
44,497
-4,062
48,559
302,258
11,178
-31
CY16E
11,611
359,942
-30,124
390,066
8,024
80,239
-7,599
87,838
477,904
17,674
10
CY17E
14,028
420,854
-44,146
465,000
9,007
90,066
-12,128
102,194
567,194
20,976
30
Source: Company, MOSL
16 February 2015
7

Eicher Motors
Exhibit 10: Valuations trading above historical average, reflecting improving fundamentals
42
35
28
8.0
21
14
7
0
11.3
0.0
17.6
14.6
4.0
2.8
2.3
4.2
P/E (x)
5 Yrs Avg(x)
15 Yrs Avg(x)
10 Yrs Avg(x)
16.0
37.1
12.0
P/B (x)
5 Yrs Avg(x)
15 Yrs Avg(x)
10 Yrs Avg(x)
12.0
Source: MOSL
Source: MOSL
Exhibit 11: Comparative Valuation
Auto OEM's
Bajaj Auto
Hero MotoCorp
TVS Motor
M&M
Maruti Suzuki
Tata Motors
Ashok Leyland
Eicher Motors#
Auto Ancillaries
Bharat Forge
1,176
Exide Industries
180
Amara Raja Batteries
882
# Nos. are on CY basis
CMP *
(INR)
2,262
2,806
302
1,208
3,574
574
66
16,109
TP
(INR)
Buy
2,832
Buy
3,222
Buy
326
Neutral 1,293
Buy
4,616
Buy
746
Buy
87
Buy 17,674
Buy
Buy
Buy
1,233
241
1,093
Rating
P/E (x)
FY16E
FY17E
14.9
12.8
16.4
13.9
22.8
16.2
15.8
12.5
20.7
15.5
8.1
7.0
18.7
11.1
39.2
24.4
27.9
19.4
27.5
21.4
16.2
20.2
EV/EBITDA (x)
FY16E
FY17E
9.4
7.6
11.3
9.2
14.2
10.1
13.8
11.6
11.0
8.6
3.3
2.6
9.3
5.9
23.1
14.8
14.7
12.0
15.6
11.5
9.8
11.7
RoE (%)
FY16E
FY17E
36.4
35.4
47.0
44.9
33.0
34.9
16.2
16.5
18.5
20.6
24.1
22.4
18.0
26.0
39.2
43.2
26.9
16.8
28.8
27.7
17.5
31.0
RoCE (%)
FY16E
FY17E
50.4
48.8
67.5
64.6
39.2
43.5
17.5
18.4
23.2
26.1
26.5
26.0
17.9
26.9
42.6
51.1
27.7
31.1
23.6
24.5
40.7
44.1
Source: Company, MOSL
16 February 2015
8

Eicher Motors
Eicher Motors| Story in Charts: Multiple growth drivers
Exhibit 12: Capacity addition and healthy demand to drive RE Exhibit 13: …together with efficiencies of new plant to drive
volumes…
RE margins
Volumes (units)
69.9
57.0
48.5
Growth (%)
EBITDA
24.2
19.0
39.8
20.2
EBITDA Margins (%)
26.8
26.0
26.3
CY13
CY14
CY15E
CY16E
CY17E
CY13
CY14
CY15E
CY16E
CY17E
Source: Company, MOSL
Exhibit 14: VECV recovery expected in CY15 onwards
VECV (units)
Growth YoY %
35.4
41.8
17.1
(2.3)
(14.1)
CY13
CY14
CY15E
CY16E
CY17E
Exhibit 15: Improved demand, lower discounts to drive VECV
margins
EBITDA (INR m)
EBITDA (%)
12.4
9.7
7.7
6.7
12.0
CY13
CY14
CY15E
CY16E
CY17E
Source: Company, MOSL
Exhibit 16: Royal Enfield contributed ~73% of CY15 EBITDA
Royal Enfield
0
22
VECV (ex-MDEP)
1
1
26
30
MDEP
30
Exhibit 17: Robust growth to drive ROE and RoCE
RoE
RoCE
51.1
43.2
44
39.2
60
(4)
CY13
CY14
CY15E
CY16E
78
73
69
70
20.7
(0)
CY17E
2013
2014E
21.8
28.8 28.1
42.6
43.9
36.4
2015E
2016E
2017E
Source: Company, MOSL
16 February 2015
9

Eicher Motors
Financials and valuations
Income Statement (Consolidated)
Y/E December
Net Sales
Change (%)
EBITDA
EBITDA Margin (%)
Depreciation
Interest cost
Other Income
PBT
Tax
Effective Rate (%)
PAT
Change (%)
Less: Minority Interest
Adj. PAT
Change (%)
2011
56,775
29.1
6,037
10.5
640
77
1,281
6,602
1,628
24.7
4,974
62.1
1,886.3
3,088
63.4
2012
63,299
11.5
5,490
8.6
822
38
1,366
5,997
1,249
20.8
4,749
-4.5
1,505.9
3,243
5.0
2013
66,858
5.6
7,137
10.5
1,300
79
953
6,711
1,452
21.6
5,259
10.8
1,314.4
3,945
21.7
2014E
85,987
28.6
11,148
12.8
2,198
98
1,074
9,926
2,909
29.3
7,017
33.4
863.8
6,366
61.4
2015E
127,621
48.4
19,849
15.3
2,963
100
1,746
18,533
5,164
27.9
13,369
90.5
2,256.0
11,113
74.6
2016E
179,771
40.9
32,001
17.4
3,738
100
2,595
30,758
8,430
27.4
22,328
67.0
4,492.6
17,835
60.5
(INR Million)
2017E
214,065
19.1
37,576
17.2
4,755
100
3,960
36,680
10,077
27.5
26,604
19.2
5,067.1
21,536
20.8
Balance Sheet (Consolidated)
Y/E December
Share Capital
Net Worth
Minority Interest
Deferred Tax
Loans
Capital Employed
Application of Funds
Gross Fixed Assets
Less: Depreciation
Net Fixed Assets
Capital WIP
- of which Goodwill
Investments
Curr.Assets, L & Adv.
Inventory
Sundry Debtors
Cash & Bank Balances
Loans & Advances
Others
Current Liab. & Prov.
Sundry Creditors
Other Liabilities
Provisions
Net Current Assets
Application of Funds
E: MOSL Estimates
2011
270
14,931
8,377
645
504
24,456
9,887
4,843
5,044
4,128
223
5,126
23,501
4,280
3,434
11,973
3,391
424
13,343
11,238
608
1,497
10,157
24,456
2012
270
17,549
9,485
1,232
384
28,649
15,260
5,342
9,918
5,044
223
6,385
23,368
4,888
4,459
8,035
5,503
483
16,066
14,356
6
1,704
7,302
28,649
2013
270
20,554
10,397
1,805
839
33,595
22,993
6,431
16,561
4,636
223
8,255
23,914
5,268
5,125
6,826
6,163
532
19,771
17,612
0
2,159
4,143
33,595
2014E
270
23,581
11,261
1,943
842
37,627
29,319
8,630
20,690
2,750
223
8,254
27,326
6,376
4,038
11,322
4,954
635
21,393
15,727
2,970
2,695
5,933
37,627
2015E
270
33,169
13,517
2,266
842
49,794
40,819
11,592
29,227
1,250
223
8,254
42,430
9,498
5,991
18,736
7,260
945
31,366
23,439
4,463
3,464
11,063
49,794
2016E
270
49,348
18,010
2,844
842
71,043
50,819
15,331
35,489
1,250
223
8,254
69,905
13,409
8,405
36,681
10,078
1,333
43,854
33,111
6,380
4,363
26,051
71,043
(INR Million)
2017E
270
69,039
23,077
3,516
842
96,474
61,069
20,086
40,983
1,250
223
8,254
98,312
15,928
9,793
59,028
11,988
1,576
52,325
39,406
7,871
5,049
45,986
96,474
16 February 2015
10

Eicher Motors
Ratios (Consolidated)
Y/E December
Basic (INR)
EPS
EPS Growth (%)
Cash EPS
Book Value per Share
DPS
Payout (Incl. Div. Tax) %
Valuation (x)
P/E
Cash P/E
EV/EBITDA
EV/Sales
Price to Book Value
Dividend Yield (%)
Profitability Ratios (%)
RoE
RoCE
RoIC
Turnover Ratios
Debtors (Days)
Inventory (Days)
Creditors (Days)
Working Capital (Days)
Asset Turnover (x)
Fixed Asset Turnover
Leverage Ratio
Debt/Equity (x)
2011
114.4
63.1
138.1
553.2
16.0
16.3
140.8
116.7
118.1
12.4
29.1
0.1
22.7
29.8
2012
120.1
5.0
150.5
650.0
20.0
19.5
134.1
107.0
117.0
10.7
24.8
0.1
20.0
22.7
2013
145.9
21.5
194.0
760.1
30.0
24.1
110.4
83.0
78.4
9.4
21.2
0.2
20.7
21.8
2014E
235.4
61.4
316.7
872.1
35.0
17.9
68.4
50.9
44.6
6.8
18.5
0.2
28.8
28.1
2015E
411.0
74.6
520.5
1,226.7
40.0
11.7
39.2
30.9
25.3
4.5
13.1
0.2
39.2
42.6
2016E
659.6
60.5
797.8
1,825.0
45.0
8.2
24.4
20.2
15.6
3.1
8.8
0.3
43.2
51.1
2017E
796.5
20.8
972.3
2,553.2
50.0
7.6
20.2
16.6
12.5
2.4
6.3
0.3
36.4
43.9
22
27
72
-22
2.3
25
28
82
-29
2.2
27
28
94
-39
2.0
17
27
66
-22
2.3
17
27
66
-22
2.6
17
27
66
-22
2.5
16
27
66
-23
2.2
0.0
0.0
0.0
0.0
0.0
0.0
0.0
Cash Flow Statement (Consolidated)
Y/E December
Profit before Tax
Depreciation & Amort.
Direct Taxes Paid
(Inc)/Dec in Working Capital
Interest/Div. Received
Other Items
CF from Oper. Activity
(Inc)/Dec in FA+CWIP
Free Cash Flow
(Pur)/Sale of Invest.
CF from Inv. Activity
Issue of Shares
Inc/(Dec) in Debt
Interest Paid
Dividends Paid
CF from Fin. Activity
Inc/(Dec) in Cash
Add: Beginning Balance
Closing Balance
E: MOSL Estimates
2011
6,602
640
-1,668
-234
1,316
-1,305
5,351
-4,173
1,178
-540
-4,713
24
-453
-84
-609
-1,122
-484
12,457
11,973
0
2012
5,997
822
-1,077
391
1,351
-1,308
6,177
-7,820
-1,644
-1,263
-9,083
4
-43
-40
-895
-974
-3,880
11,915
8,035
0
2013
6,706
1,300
-1,504
1,491
1,023
-819
8,197
-7,054
1,143
-1,879
-8,933
17
610
-80
-1,020
-474
-1,209
8,035
6,826
0
2014E
9,926
2,198
-2,771
-1,906
1,074
3,636
12,158
-4,441
7,717
1
-4,440
-1,987
3
-98
-1,140
-3,222
4,496
6,826
11,322
0
2015E
18,533
2,963
-4,841
2,637
1,746
-2,000
19,038
-10,000
9,038
0
-10,000
-221
0
-100
-1,303
-1,624
7,414
11,322
18,735
0
(INR Million)
2016E
30,758
3,738
-7,852
3,346
2,595
-2,883
29,702
-10,000
19,702
0
-10,000
-190
0
-100
-1,466
-1,757
17,945
18,735
36,680
0
2017E
36,680
4,755
-9,405
2,390
3,960
-3,838
34,543
-10,250
24,293
0
-10,250
-216
0
-100
-1,629
-1,945
22,347
36,680
59,028
0
16 February 2015
11

Eicher Motors
Corporate profile: Eicher Motors
Company description
Promoted by the Delhi-based Vikram Lal Group,
Eicher Motors (EIM) is a diversified engineering
company. It is engaged in the business of high end
motorcycles (350cc & above) under the brand
'Royal Enfield', and commercial vehicles (CVs),
automotive gears and components, and
engineering solutions through its subsidiary, Volvo
Eicher Commercial Vehicles (VECV).
Exhibit 18: Sensex rebased
Exhibit 19: Shareholding pattern (%)
Dec-14
Promoter
DII
FII
Others
55.0
4.7
19.5
20.9
Sep-14
55.0
4.4
20.1
20.5
Dec-13
55.1
5.1
20.0
19.8
Exhibit 20: Top holders
Holder Name
Aktiebolaget Volvo
Cartica Capital Ltd
Tiaa- Cref Institutional Mutual Funds International
Amansa Capital Pte Ltd A/c Amansa Holdings Pvt Ltd
Tree Line Asia Master Fund (Singapore) PTE Ltd
% Holding
8.4
2.8
2.0
1.3
1.1
Note: FII Includes depository receipts
Exhibit 21: Top management
Name
S Sandilya
Siddhartha Lal
Lalit Malik
B Govindarajan
Vinod Aggarwal
Designation
Chairman
Managing Director & CEO
CFO, EML
COO, Royal Enfield
CEO, VECV
Exhibit 22: Directors
Name
S Sandilya
Siddhartha Lal
Priya Brat
M J Subbaiah
*Independent
Name
Prateek Jalan
R L Ravichandran
Exhibit 23: Auditors
Name
Deloitte Haskins & Sells LLP
V Kalyanaraman
Type
Statutory
Cost Auditor
Exhibit 24: MOSL forecast v/s consensus
EPS
(INR)
FY15
FY16
FY17
MOSL
forecast
411.0
659.6
796.5
Consensus
forecast
403.3
581.0
645.5
Variation
(%)
1.9
13.5
23.4
16 February 2015
12

Eicher Motors
NOTES
16 February 2015
13

Eicher Motors
This document has been prepared by Motilal Oswal Securities Limited (hereinafter referred to as Most) to provide information about the company(ies) and/sector(s), if any, covered in the report and may be
distributed by it and/or its affiliated company(ies). This report is for personal information of the selected recipient/s and does not construe to be any investment, legal or taxation advice to you. This research report does
not constitute an offer, invitation or inducement to invest in securities or other investments and Motilal Oswal Securities Limited (hereinafter referred as MOSt) is not soliciting any action based upon it. This report is not
for public distribution and has been furnished to you solely for your general information and should not be reproduced or redistributed to any other person in any form. This report does not constitute a personal
recommendation or take into account the particular investment objectives, financial situations, or needs of individual clients. Before acting on any advice or recommendation in this material, investors should consider
whether it is suitable for their particular circumstances and, if necessary, seek professional advice. The price and value of the investments referred to in this material and the income from them may go down as well as
up, and investors may realize losses on any investments. Past performance is not a guide for future performance, future returns are not guaranteed and a loss of original capital may occur.
MOSt and its affiliates are a full-service, integrated investment banking, investment management, brokerage and financing group. We and our affiliates have investment banking and other business relationships with a
some companies covered by our Research Department. Our research professionals may provide input into our investment banking and other business selection processes. Investors should assume that MOSt and/or
its affiliates are seeking or will seek investment banking or other business from the company or companies that are the subject of this material and that the research professionals who were involved in preparing this
material may educate investors on investments in such business. The research professionals responsible for the preparation of this document may interact with trading desk personnel, sales personnel and other
parties for the purpose of gathering, applying and interpreting information. Our research professionals are paid on the profitability of MOSt which may include earnings from investment banking and other business.
MOSt generally prohibits its analysts, persons reporting to analysts, and members of their households from maintaining a financial interest in the securities or derivatives of any companies that the analysts cover.
Additionally, MOSt generally prohibits its analysts and persons reporting to analysts from serving as an officer, director, or advisory board member of any companies that the analysts cover. Our salespeople, traders,
and other professionals or affiliates may provide oral or written market commentary or trading strategies to our clients that reflect opinions that are contrary to the opinions expressed herein, and our proprietary
trading and investing businesses may make investment decisions that are inconsistent with the recommendations expressed herein. In reviewing these materials, you should be aware that any or all of the foregoing
among other things, may give rise to real or potential conflicts of interest. MOSt and its affiliated company(ies), their directors and employees and their relatives may; (a) from time to time, have a long or short position
in, act as principal in, and buy or sell the securities or derivatives thereof of companies mentioned herein. (b) be engaged in any other transaction involving such securities and earn brokerage or other compensation
or act as a market maker in the financial instruments of the company(ies) discussed herein or act as an advisor or lender/borrower to such company(ies) or may have any other potential conflict of interests with
respect to any recommendation and other related information and opinions.; however the same shall have no bearing whatsoever on the specific recommendations made by the analyst(s), as the recommendations
made by the analyst(s) are completely independent of the views of the affiliates of MOSt even though there might exist an inherent conflict of interest in some of the stocks mentioned in the research report
Reports based on technical and derivative analysis center on studying charts company's price movement, outstanding positions and trading volume, as opposed to focusing on a company's fundamentals and, as
such, may not match with a report on a company's fundamental analysis. In addition MOST has different business segments / Divisions with independent research separated by Chinese walls catering to different set
of customers having various objectives, risk profiles, investment horizon, etc, and therefore may at times have different contrary views on stocks sectors and markets.
Unauthorized disclosure, use, dissemination or copying (either whole or partial) of this information, is prohibited. The person accessing this information specifically agrees to exempt MOSt or any of its affiliates or
employees from, any and all responsibility/liability arising from such misuse and agrees not to hold MOSt or any of its affiliates or employees responsible for any such misuse and further agrees to hold MOSt or any of
its affiliates or employees free and harmless from all losses, costs, damages, expenses that may be suffered by the person accessing this information due to any errors and delays. The information contained herein is
based on publicly available data or other sources believed to be reliable. Any statements contained in this report attributed to a third party represent MOSt’s interpretation of the data, information and/or opinions
provided by that third party either publicly or through a subscription service, and such use and interpretation have not been reviewed by the third party. This Report is not intended to be a complete statement or
summary of the securities, markets or developments referred to in the document. While we would endeavor to update the information herein on reasonable basis, MOSt and/or its affiliates are under no obligation to
update the information. Also there may be regulatory, compliance, or other reasons that may prevent MOSt and/or its affiliates from doing so. MOSt or any of its affiliates or employees shall not be in any way
responsible and liable for any loss or damage that may arise to any person from any inadvertent error in the information contained in this report. MOSt or any of its affiliates or employees do not provide, at any time,
any express or implied warranty of any kind, regarding any matter pertaining to this report, including without limitation the implied warranties of merchantability, fitness for a particular purpose, and non-infringement.
The recipients of this report should rely on their own investigations.
This report is intended for distribution to institutional investors. Recipients who are not institutional investors should seek advice of their independent financial advisor prior to taking any investment decision based on
this report or for any necessary explanation of its contents.
Most and it’s associates may have managed or co-managed public offering of securities, may have received compensation for investment banking or merchant banking or brokerage services, may have received any
compensation for products or services other than investment banking or merchant banking or brokerage services from the subject company in the past 12 months.
Most and it’s associates have not received any compensation or other benefits from the subject company or third party in connection with the research report.
Subject Company may have been a client of Most or its associates during twelve months preceding the date of distribution of the research report
MOSt and/or its affiliates and/or employees may have interests/positions, financial or otherwise of over 1 % at the end of the month immediately preceding the date of publication of the research in the securities
mentioned in this report. To enhance transparency, MOSt has incorporated a Disclosure of Interest Statement in this document. This should, however, not be treated as endorsement of the views expressed in the
report.
Motilal Oswal Securities Limited is under the process of seeking registration under SEBI (Research Analyst) Regulations, 2014.
There are no material disciplinary action that been taken by any regulatory authority impacting equity research analysis activities
Analyst Certification
The views expressed in this research report accurately reflect the personal views of the analyst(s) about the subject securities or issues, and no part of the compensation of the research analyst(s) was, is, or will be
directly or indirectly related to the specific recommendations and views expressed by research analyst(s) in this report. The research analysts, strategists, or research associates principally responsible for preparation
of MOSt research receive compensation based upon various factors, including quality of research, investor client feedback, stock picking, competitive factors and firm revenues
Disclosure of Interest Statement
Analyst ownership of the stock
Served as an officer, director or employee
EICHER MOTORS
No
No
Disclosures
Regional Disclosures (outside India)
For U.S.
This report is not directed or intended for distribution to or use by any person or entity resident in a state, country or any jurisdiction, where such distribution, publication, availability or use would be contrary to law,
regulation or which would subject MOSt & its group companies to registration or licensing requirements within such jurisdictions.
Motilal Oswal Securities Limited (MOSL) is not a registered broker - dealer under the U.S. Securities Exchange Act of 1934, as amended (the"1934 act") and under applicable state laws in the United States. In
addition MOSL is not a registered investment adviser under the U.S. Investment Advisers Act of 1940, as amended (the "Advisers Act" and together with the 1934 Act, the "Acts), and under applicable state laws in the
United States. Accordingly, in the absence of specific exemption under the Acts, any brokerage and investment services provided by MOSL, including the products and services described herein are not available to or
intended for U.S. persons.
This report is intended for distribution only to "Major Institutional Investors" as defined by Rule 15a-6(b)(4) of the Exchange Act and interpretations thereof by SEC (henceforth referred to as "major institutional
investors"). This document must not be acted on or relied on by persons who are not major institutional investors. Any investment or investment activity to which this document relates is only available to major
institutional investors and will be engaged in only with major institutional investors. In reliance on the exemption from registration provided by Rule 15a-6 of the U.S. Securities Exchange Act of 1934, as amended (the
"Exchange Act") and interpretations thereof by the U.S. Securities and Exchange Commission ("SEC") in order to conduct business with Institutional Investors based in the U.S., MOSL has entered into a chaperoning
agreement with a U.S. registered broker-dealer, Motilal Oswal Securities International Private Limited. ("MOSIPL"). Any business interaction pursuant to this report will have to be executed within the provisions of this
chaperoning agreement.
The Research Analysts contributing to the report may not be registered /qualified as research analyst with FINRA. Such research analyst may not be associated persons of the U.S. registered broker-dealer, MOSIPL,
and therefore, may not be subject to NASD rule 2711 and NYSE Rule 472 restrictions on communication with a subject company, public appearances and trading securities held by a research analyst account.
Motilal Oswal Capital Markets Singapore Pte Limited is acting as an exempt financial advisor under section 23(1)(f) of the Financial Advisers Act(FAA) read with regulation 17(1)(d) of the Financial Advisors
Regulations and is a subsidiary of Motilal Oswal Securities Limited in India. This research is distributed in Singapore by Motilal Oswal Capital Markets Singapore Pte Limited and it is only directed in Singapore to
accredited investors, as defined in the Financial Advisers Regulations and the Securities and Futures Act (Chapter 289), as amended from time to time.
In respect of any matter arising from or in connection with the research you could contact the following representatives of Motilal Oswal Capital Markets Singapore Pte Limited:
Anosh Koppikar
Kadambari Balachandran
Email : anosh.Koppikar@motilaloswal.com
Email : kadambari.balachandran@motilaloswal.com
Contact : (+65)68189232
Contact : (+65) 68189233 / 65249115
Office Address : 21 (Suite 31),16 Collyer Quay,Singapore 04931
For Singapore
Motilal Oswal Securities Ltd
16 February 2015
Motilal Oswal Tower, Level 9, Sayani Road, Prabhadevi, Mumbai 400 025
Phone: +91 22 3982 5500 E-mail: reports@motilaloswal.com
14