18 February 2015
4QCY14 Results Update | Sector:
Cement
Ambuja Cements
BSE SENSEX
S&P CNX
29,320
8,869
Bloomberg
ACEM IN
Equity Shares (m)
1,549.8
M.Cap. (INR b) / (USD b) 417.7/6.7
52-Week Range (INR)
271/151
1, 6, 12 Rel. Per (%)
8/15/34
Avg Val (INRm)/Vol ‘000 458/2,136
Free float (%)
49.7
n
Financials & Valuation (INR Billion)
Y/E Dec
2014 2015E 2016E
Sales
EBITDA
NP
Adj. EPS (INR)
EPS Gr. (%)
BV/Sh. (INR)
RoE (%)
RoCE (%)
P/E (x)
P/BV (x)
EV/EBITDA (x)
EV/Ton (USD)
99.1 109.5 124.7
18.6 24.5 31.5
13.2 16.8 21.9
8.5
8.5 11.1
25.9 -0.8 30.9
65.6 95.9 101.4
13.4 11.5 11.2
18.7 16.9 16.3
22.4 22.6 17.3
2.9
2.0
1.9
12.5 14.8 11.4
126
197
189
CMP: INR270
n
TP: INR262 (-3%)
Neutral
EBITDA miss on lower volume and higher RM & employee cost; payout
improved to INR5/share; cutting CY15/16E EPS by 5-6%
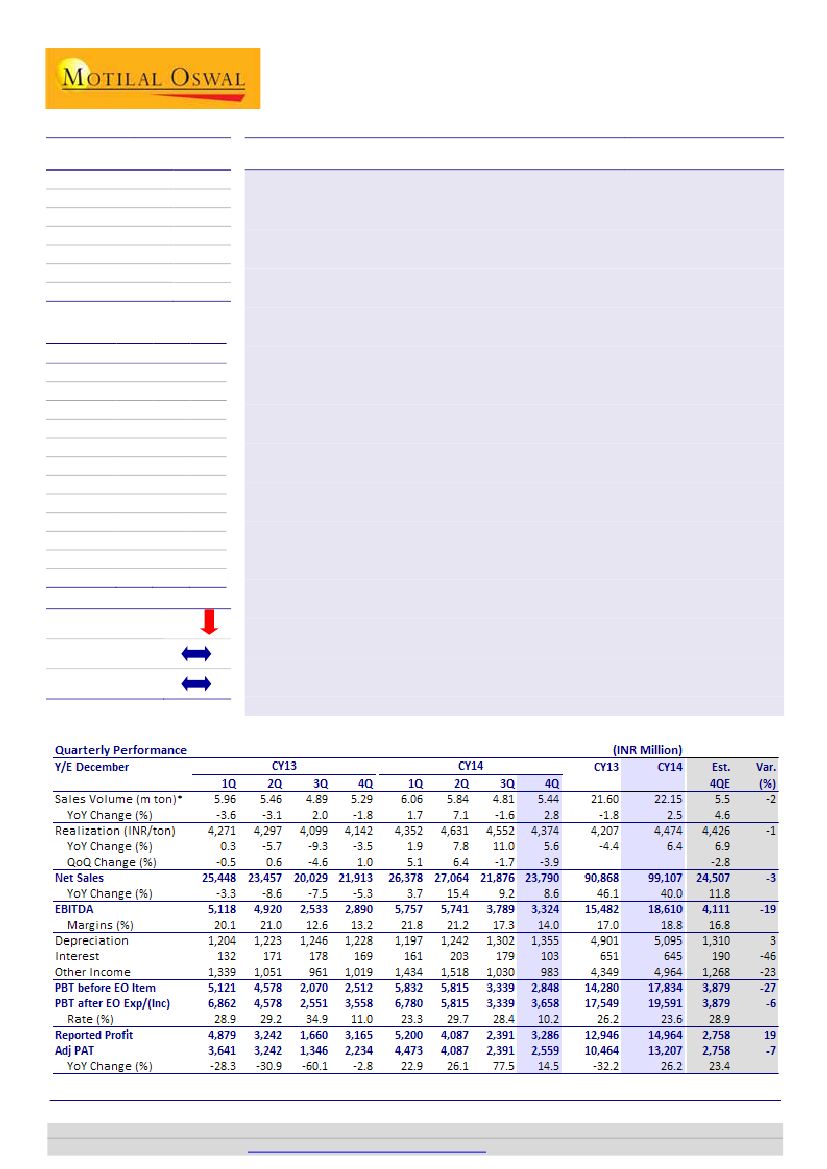
Revenue miss by 3% on lower volume:
ACEM’s 4QCY14 net sales grew by 8.6%
YoY (-4% QoQ) to INR23.8b (v/s est of INR24.7b), led by lower volume growth.
Cement volume stood at 5.44mt (v/s est 5.5mt), 2.8% YoY (+13% QoQ).
Realizations de-grew 3.9% QoQ (+5.6%YoY) to INR4,374/ton (v/s est of
INR4,426/ton). Annual volume grew 2.5% YoY to 22.15mt.
Higher RM & employee cost negate freight benefits:
EBITDA grew 15% YoY (-12%
QoQ) to ~INR3.3b (v/s est ~IN4.1b), translating into EBITDA margin of 14% (-3.3pp
QoQ and +0.8pp YoY) v/s est of 16.8%. Cost was flat QoQ (+INR167/ton YoY) as
against expectation of 2% QoQ decline on the back of lower input cost viz. coal
and diesel prices. While there has been 10%/4% QoQ drop in freight/energy cost,
higher employee and RM cost negated the benefits.
Tax write-back boosts PAT:
EBITDA/ton improved INR65 YoY (-INR371 QoQ) to
INR611 (v/s est ~INR742). PAT stood at INR3.3b (v/s est of INR2.8b), boosted by
prior period tax write back.
Higher payout of INR5/share; No major capacity addition in foreseeable future:
ACEM declared dividend of INR5/share (with interim of INR1.8/share and final of
INR3.2/share) v/s INR3.6/share in CY13. In the context of global merger between
Holcim and Lafarge, immediate capacity addition is limited barring Sankrail (West
Bengal) grinding unit of 0.8mt expected in 2015.
Revising CY15/16E EPS by 5-6%:
We are cutting EPS for CY15/CY16 by 5.6%/5% to
INR8.5/11.1 respectively, to factor in for higher raw material and employee cost
and minor tweak in below-EBITDA items. We factor in for 4%/5% YoY volume
growth and INR14/bag and INR20/bag YoY rise in realizations in CY15/16. These
translate into EBITDA of INR1,066/INR1,302 per ton for CY15/16. We value ACEM
at INR262 (at ~USD180/ton - 20% discount to Ultratech or implied EV/EBITDA
10.5x CY16E EV/EBITDA). It offers ~3% downside at CMP. Maintain
Neutral.
n
n
n
Estimate change
TP change
Rating change
5-6%
Jinesh Gandhi
(Jinesh@MotilalOswal.com); +91 22 3982 5416
Sandipan Pal
(Sandipan.Pal@MotilalOswal.com); +91 22 3982 5436
Investors are advised to refer through disclosures made at the end of the Research Report.
Motilal Oswal research is available on
www.motilaloswal.com/Institutional-Equities,
Bloomberg, Thomson Reuters, Factset and S&P Capital.

Ambuja Cements
Revenue miss by 3% on lower volume
n
n
ACEM’s 4QCY14 net sales grew by 8.6% YoY (-4% QoQ) to INR23.8b (v/s est of
INR24.7b), led by lower volume growth.
Cement volume stood at 5.44mt (v/s est 5.5mt), 2.8% YoY (+13% QoQ).
Realizations de-grew 3.9% QoQ (+5.6%YoY) to INR4,374/ton (v/s est of
INR4,426/ton). Annual volume grew 2.5% YoY to 22.15mt.
Higher RM & employee cost negate freight benefits; EBITDA/ton at INR611
n
n
n
n
EBITDA grew 15% YoY (-12% QoQ) to ~INR3.3b (v/s est ~IN4.1b), translating into
EBITDA margin of 14% (-3.3pp QoQ and +0.8pp YoY) v/s est of 16.8%.
Cost was flat QoQ (+INR167/ton YoY) as against expectation of 2% QoQ decline
on the back of lower input cost viz. coal and diesel prices. While there has been
10%/4% QoQ drop in freight/energy cost, higher employee and RM cost negated
the benefits.
EBITDA/ton improved INR65 YoY (-INR371 QoQ) to INR611 (v/s est ~INR742).
PAT stood at INR3.3b (v/s est of INR2.8b), boosted by prior period tax write
back.
Exhibit 2:
Higher cost dent profitability
EBITDA (INR m)
28.428.2
18.5
26.2
21.0
18.520.1
EBITDA Margin (%)
21.8 21.2
17.3
12.6 13.2
Exhibit 1:
Volumes growth below estimates
Volume (MT)
Net Realization (INR/ton)
14.0
5.7 6.2 5.6 4.8 5.4 6.0 5.5 4.9 5.3 6.1 5.8 4.8 5.4
Source: Company, MOSL
Exhibit 3: EBITDA/ton dropped QoQ on lower realizations and QoQ flat cost
EBITDA (INR/Ton)
Source: Company, MOSL
18 February 2015
2

Ambuja Cements
Exhibit 4: Income statement (INR/ton)
4QCY14
Net Realization
Raw Material
Staff Cost
Power & Fuel
Freight
Other exp
Total Cost
EBITDA
4,374
488
311
1,017
1,032
915
3,763
611
4QCY13
4,142
406
226
946
1,093
924
3,595
546
YoY (%)
9.9
-23.8
31.0
12.1
4.4
3.4
4.7
44.3
3QCY14
4,552
309
296
1,061
1,141
956
3,763
QoQ (%)
-3.9
57.6
5.1
-4.2
-9.6
-4.2
0.0
788
-22.5
Source: Company, MOSL
Payout improved; No major capacity addition in foreseeable future
n
n
n
n
n
Declared dividend of INR5/share (with interim of INR1.8/share and final of
INR3.2/share) v/s INR3.6/share in CY13.
In the context of global merger between Holcim and Lafarge, ACEM has been re-
visiting capex plan especially of 4.5mt Greenfield capacity addition at Marwa
Munda (Rajasthan).
During 3QCY14, it has commissioned a roller press of 0.8mt at Rabriyawas plant
(Rajasthan)
Project Geo20 with focus on increase in usage of alternate fuel to reduce
dependence on fossil fuel commissioned at 5 integrated plants. This is expected
to reduce fuel cost.
Sankrail (West Bengal) grinding unit of 0.8mt is expected to commission in 2015.
Management Outlook on the sector
n
n
Demand is likely to be better with expectation of higher GDP growth and
improved business sentiments. The driver will continue to be housing and
infrastructure.
Ambuja would continue to work on improving efficiencies and focus on
customer and commercial excellence.
Revising CY15/16 EPS by 5-6%
n
n
We are cutting EPS for CY15/CY16 by 5.6%/5% to INR8.5/11.1 respectively, to
factor in for higher raw material and employee cost and minor tweak in below-
EBITDA items.
We factor in for 4%/5% YoY volume growth and INR14/bag and INR20/bag YoY
rise in realizations in CY15/16.
These translate into EBITDA of
INR1,066/INR1,302 per ton for CY15/16.
18 February 2015
3

Ambuja Cements
Exhibit 5: Revised estimates
(INR b)
Volumes (MT)
Realizations (INR/Ton)
Net Sales
EBITDA (INR/Ton)
Net Profit
EPS (INR)
Rev
23.0
4,754
109.5
1,065
16.8
8.5
CY15E
Old
23.1
4,787
110.8
1,121
17.7
9.0
Chg (%)
-0.4
-0.7
-1.1
-4.9
-5.4
-5.6
Rev
24.2
5,154
124.7
1,303
21.9
11.1
CY16E
Old
24.3
5,187
126.0
1,361
23.1
11.6
Chg (%)
-0.4
-0.6
-1.1
-4.3
-4.8
-5.0
Source: MOSL
Valuation and views
n
n
n
n
n
ACEM offers a play on strong market mix and efficient operations.
ACC’s acquisition, through Holcim’s restructuring transaction, doubles ACEM’s
capacity along with potential synergistic benefits. However we expect synergy
benefits to be deferred due to global merger between Holcim and Lafarge.
Barring synergies, there has been separate efforts to reduce cost viz. 1) lower
freight cost by 10% (RFID implementation, reducing demurrage time, third party
transporters), (2) higher alternate fuel usage (from 4% to 10%) etc.
Nonetheless, higher utilization and limited expansion plan is likely to drive sub-
par volume growth over near future.
We value ACEM at INR262 (at ~USD180/ton - 20% discount to Ultratech or
implied EV/EBITDA 10.5x CY16E EV/EBITDA). It offers ~3% downside at CMP.
Maintain
Neutral.
18 February 2015
4

Ambuja Cements
Story in charts
Exhibit 6: Near-term expansion visibility limited
Capacity (MT)
95
18
19
75
25
19
81
25
20
78
27
21
79
28
22
75
29
22
75
30
22
78
30
23
80
30
24
24.7
15.5
Dispatches (MT)
Cap. Util (%)
28.4
26.4
24.7
Exhibit 7: Trend in profitability
EBITDA
22.8
25.5
17.0
18.8
Margin (%)
22.4
25.3
17.6
18.7
18.2
19.4
18.6
24.5
31.5
CY08 CY09 CY10 CY11 CY12 CY13 CY14 CY15E CY16E
Source: Company, MOSL
CY08 CY09 CY10 CY11 CY12 CY13 CY14 CY15E CY16E
Source: Company, MOSL
Exhibit 8: EBITDA/ton has upside potential from synergies
Exhibit 9: Trend in EPS
EPS (Rs)
10.0
7.6
7.8
8.1
8.2
22.4
6.8
EPS Growth (%)
8.5
8.5
25.9
11.1
30.9
EBITDA/ton
2.1
-11.2
4.3
0.6
-32.4
-0.8
CY08
Source: Company, MOSL
CY09
CY10
CY11
CY12
CY13
CY14 CY15E CY16E
Source: Company, MOSL
Exhibit 10: Trend in return ratios
22.2
19.4
17.9
16.2
Exhibit 11: B/S strength to address cash outgo on merger
CFO (Rs mn)
13.4
CAPEX (Rs mn)
14
11
9
7
21
14
9
19
7
23
29
14
FCF (Rs mn)
14
15
S/A RoE
18.1
11.4
11.5
11.2
17
-3
12
9
13
12
12
12
8
22
19
17
6
CY08 CY09 CY10 CY11 CY12 CY13 CY14E CY15E CY16E
Source: Company, MOSL
CY08 CY09 CY10 CY11 CY12 CY13 CY14E CY15E CY16E
Source: Company, MOSL
18 February 2015
5

Ambuja Cements
Financials and valuations
Income Statement
Y/E December
Net Sales
Change (%)
Total Expenditure
% of Sales
EBITDA
Change (%)
Margin (%)
Depreciation
EBIT
Interest
Other Income - Rec.
PBT before EO Exp.
EO Exp/(Inc)
PBT after EO Exp.
Current Tax
Deferred Tax
Tax Rate (%)
Reported PAT
PAT Adj for EO Items
Change (%)
2010
73,902
4.4
55,666
75.3
18,236
-2.3
24.7
3,872
14,364
487
2,476
16,353
-265
16,619
3,532
450
24.0
12,636
12,434
4.7
2011
85,043
15.1
65,656
77.2
19,387
6.3
22.8
4,452
14,935
526
2,978
17,387
358
17,029
3,613
1,127
27.8
12,289
12,547
0.9
2012
96,749
13.8
72,074
74.5
24,675
27.3
25.5
5,373
19,302
757
4,042
22,588
3,570
19,018
6,048
0
31.8
12,971
15,435
23.0
2013
90,868
-6.1
75,386
83.0
15,482
-37.3
17.0
4,901
10,581
651
4,349
14,280
-3,269
17,549
4,603
0
26.2
12,946
10,464
-32.2
2014
99,107
9.1
80,497
81.2
18,610
20.2
18.8
5,095
13,515
645
4,964
17,834
-1,757
19,591
4,627
0
23.6
14,964
13,207
26.2
2015E
109,521
10.5
84,977
77.6
24,544
31.9
22.4
5,236
19,308
605
5,420
24,123
0
24,123
6,754
603
30.5
16,766
16,766
26.9
(INR Million)
2016E
124,673
13.8
93,162
74.7
31,510
28.4
25.3
5,782
25,729
587
6,210
31,351
0
31,351
8,778
627
30.0
21,946
21,946
30.9
Balance Sheet
Y/E December
Equity Share Capital
Total Reserves
Net Worth
Def. Liabilities
Total Loans
Capital Employed
Gross Block
Less: Accum. Depn.
Net Fixed Assets
Capital WIP
Investments
Curr. Assets
Inventory
Debtors
Cash & Bank Bal
Others
Curr. Liability & Prov.
Creditors
Provisions
Net Current Assets
Appl. of Funds
E: MOSL Estimates
2010
3,060
70,241
73,301
5,309
650
79,260
87,788
31,511
56,278
9,307
6,260
31,353
9,019
1,282
16,482
4,571
23,942
12,976
10,966
7,412
79,260
2011
3,069
77,626
80,694
6,436
466
87,597
97,023
35,158
61,865
4,868
8,643
40,043
9,250
2,409
20,691
7,694
27,822
15,909
11,913
12,221
87,597
2012
3,084
84,966
88,051
5,483
395
93,929
101,836
43,213
58,624
5,201
16,558
43,864
9,839
2,134
22,537
9,353
30,318
15,904
14,414
13,545
93,929
2013
3,092
91,764
94,855
5,643
292
100,790
108,262
47,637
60,625
6,949
17,885
44,187
9,339
2,315
23,411
9,122
28,856
17,845
11,011
15,332
100,790
2014
3,100
2015E
3,966
(INR Million)
2016E
3,966
97,934
101,033
5,890
191
107,115
118,711
52,732
64,173
5,000
21,727
48,108
8,884
2,280
24,581
12,364
31,894
19,806
12,088
16,215
107,115
185,463
189,429
6,493
500
196,423
127,711
57,968
69,742
6,000
119,507
34,801
11,252
2,701
10,347
10,502
33,628
18,625
15,003
1,173
196,423
196,355
200,322
7,120
500
207,942
141,211
63,750
77,461
7,500
119,507
40,973
12,809
3,074
13,135
11,955
37,498
20,419
17,078
3,475
207,942
18 February 2015
6

Ambuja Cements
Financials and valuations
Ratios
Y/E December
Basic (INR)
EPS
Cash EPS
BV/Share
DPS
Payout (%)
Valuation (x)
P/E
Cash P/E
P/BV
EV/Sales
EV/EBITDA
EV/Ton (Cap) - US$
Dividend Yield (%)
Return Ratios (%)
RoE
RoCE
Working Capital Ratios
Asset Turnover (x)
Debtor (Days)
Work Cap (Days)
Leverage Ratio (x)
Current Ratio
Debt/Equity
2010
8.1
10.7
48.4
2.6
31.4
33.2
25.3
5.6
5.3
21.4
250
1.0
17.9
23.8
0.9
6
37
1.3
0.0
2011
8.2
11.1
53.0
3.2
46.4
33.0
24.3
5.1
4.5
19.6
1.2
16.2
22.9
1.0
10
52
1.4
0.0
2012
10.0
13.5
57.5
3.6
49.5
26.9
20.0
4.7
3.8
15.1
213
1.3
18.1
27.3
1.0
8
51
1.4
0.0
2013
6.8
9.9
61.8
3.6
49.9
39.8
27.1
4.4
4.1
23.8
205
1.3
11.4
16.1
0.9
9
62
1.5
0.0
2014
8.5
11.8
65.6
5.0
61.8
22.4
16.2
2.9
2.4
12.5
126
1.8
13.4
18.7
0.9
8
60
1.5
0.0
2015E
8.5
11.1
95.9
5.0
66.5
22.6
17.2
2.0
3.3
14.8
197
1.9
11.5
16.9
0.6
9
4
1.0
0.0
2016E
11.1
14.0
101.4
5.0
50.4
17.3
13.7
1.9
2.9
11.4
189
1.9
11.2
16.3
0.6
9
10
1.1
0.0
Cash Flow Statement
Y/E December
Op. Profit before Tax
Interest/Div. Recd.
Direct Taxes Paid
(Inc)/Dec in WC
CF from Operations
EO Income
CF from Op. incl EO Exp
(inc)/dec in FA
(Pur)/Sale of Invest.
CF from Investments
Issue of Shares
(Inc)/Dec in Debt
Interest Paid
Dividend Paid
CF from Fin. Activity
Inc/Dec of Cash
Add: Beginning Bal.
Closing Balance
E: MOSL Estimates
2010
18,236
2,476
-3,983
2,617
19,347
265
19,612
-7,870
965
-6,905
-42
-534
-487
-3,972
-5,035
7,673
8,809
16,482
2011
20,260
1,555
-4,722
-203
16,890
0
16,890
-6,233
196
-6,037
462
738
-251
-5,697
-4,748
6,105
16,482
22,586
2012
25,393
2,340
-6,399
-417
20,917
0
20,917
-6,870
601
-6,269
831
-636
-275
-4,964
-5,044
9,604
20,691
30,295
2013
15,482
4,349
-4,603
-913
14,316
3,269
17,585
-8,650
-1,326
-9,976
322
57
-651
-6,462
-6,735
874
22,537
23,411
2014
18,610
4,964
-4,627
287
19,234
1,757
20,991
-6,694
-3,843
-10,537
455
147
-645
-9,241
-9,284
1,170
23,411
24,581
2015E
24,544
5,420
-7,358
807
23,413
0
23,413
-11,806
-97,779
-109,585
82,779
912
-605
-11,149
71,938
-14,234
24,581
10,347
(INR Million)
2016E
31,510
6,210
-9,405
486
28,801
0
28,801
-15,000
0
-15,000
0
627
-587
-11,053
-11,013
2,788
10,347
13,135
18 February 2015
7

Ambuja Cements
Corporate profile: Ambuja Cements
Company description
Ambuja Cement, a part of the Holcim group, is the
third largest cement company in India with total
capacity of 28.8mt under its control. It is one of the
lowest cost producers of cement, with focus on
structurally sound markets of North, West and
East. It is also the largest exporter of cement from
India.
Exhibit 12: Sensex rebased
Exhibit 13:
Shareholding pattern (%)
Dec-14
Promoter
DII
FII
Others
50.4
9.8
32.1
7.8
Sep-14
50.4
10.1
31.6
8.0
Dec-13
50.5
9.4
32.1
8.0
Exhibit 14:
Top holders
Holder Name
LIC of India
Aberdeen Global Indian Equity Mauritius
Oppenheimer Developing Markets Fund
Genesis Indian Investment Company Ltd
% Holding
6.5
3.2
2.9
1.6
Note: FII Includes depository receipts
Exhibit 15:
Top management
Name
N S Sekhsaria
Suresh Neotia
Ajai Kapur
Bernard Fontana
Bernard Terver
Designation
Chairman
Chairman Emeritus
Managing Director & CEO
Director
Additional Director
Exhibit 16:
Directors
Name
N S Sekhsaria*
Suresh Neotia
Ajai Kapur
Bernard Fontana
Omkar Goswami*
Nasser Munjee*
Name
Haigreve Khaitan*
Rajendra P Chitale*
Shailesh Haribhakti*
Bernard Terver
B L Taparia
Usha Sangwan
*Independent
Exhibit 17: Auditors
Name
S R B C & Co LLP
S R Batliboi & Co LLP
P M Nanabhoy & Co
Type
Statutory
Statutory
Cost Auditor
Exhibit 18:
MOSL forecast v/s consensus
EPS
(INR)
CY14
CY15
CY16
MOSL
forecast
8.5
8.5
11.1
Consensus
forecast
10.5
12.8
14.3
Variation
(%)
-19.2
-33.3
-22.6
18 February 2015
8

Ambuja Cements
NOTES
18 February 2015
9

This document has been prepared by Motilal Oswal Securities Limited (hereinafter referred to as Most) to provide information about the company(ies) and/sector(s), if any, covered in the report and may be
distributed by it and/or its affiliated company(ies). This report is for personal information of the selected recipient/s and does not construe to be any investment, legal or taxation advice to you. This research report does
not constitute an offer, invitation or inducement to invest in securities or other investments and Motilal Oswal Securities Limited (hereinafter referred as MOSt) is not soliciting any action based upon it. This report is not
for public distribution and has been furnished to you solely for your general information and should not be reproduced or redistributed to any other person in any form. This report does not constitute a personal
recommendation or take into account the particular investment objectives, financial situations, or needs of individual clients. Before acting on any advice or recommendation in this material, investors should consider
whether it is suitable for their particular circumstances and, if necessary, seek professional advice. The price and value of the investments referred to in this material and the income from them may go down as well as
up, and investors may realize losses on any investments. Past performance is not a guide for future performance, future returns are not guaranteed and a loss of original capital may occur.
MOSt and its affiliates are a full-service, integrated investment banking, investment management, brokerage and financing group. We and our affiliates have investment banking and other business relationships with a
some companies covered by our Research Department. Our research professionals may provide input into our investment banking and other business selection processes. Investors should assume that MOSt and/or
its affiliates are seeking or will seek investment banking or other business from the company or companies that are the subject of this material and that the research professionals who were involved in preparing this
material may educate investors on investments in such business. The research professionals responsible for the preparation of this document may interact with trading desk personnel, sales personnel and other
parties for the purpose of gathering, applying and interpreting information. Our research professionals are paid on the profitability of MOSt which may include earnings from investment banking and other business.
MOSt generally prohibits its analysts, persons reporting to analysts, and members of their households from maintaining a financial interest in the securities or derivatives of any companies that the analysts cover.
Additionally, MOSt generally prohibits its analysts and persons reporting to analysts from serving as an officer, director, or advisory board member of any companies that the analysts cover. Our salespeople, traders,
and other professionals or affiliates may provide oral or written market commentary or trading strategies to our clients that reflect opinions that are contrary to the opinions expressed herein, and our proprietary
trading and investing businesses may make investment decisions that are inconsistent with the recommendations expressed herein. In reviewing these materials, you should be aware that any or all of the foregoing
among other things, may give rise to real or potential conflicts of interest. MOSt and its affiliated company(ies), their directors and employees and their relatives may; (a) from time to time, have a long or short position
in, act as principal in, and buy or sell the securities or derivatives thereof of companies mentioned herein. (b) be engaged in any other transaction involving such securities and earn brokerage or other compensation
or act as a market maker in the financial instruments of the company(ies) discussed herein or act as an advisor or lender/borrower to such company(ies) or may have any other potential conflict of interests with
respect to any recommendation and other related information and opinions.; however the same shall have no bearing whatsoever on the specific recommendations made by the analyst(s), as the recommendations
made by the analyst(s) are completely independent of the views of the affiliates of MOSt even though there might exist an inherent conflict of interest in some of the stocks mentioned in the research report
Reports based on technical and derivative analysis center on studying charts company's price movement, outstanding positions and trading volume, as opposed to focusing on a company's fundamentals and, as
such, may not match with a report on a company's fundamental analysis. In addition MOST has different business segments / Divisions with independent research separated by Chinese walls catering to different set
of customers having various objectives, risk profiles, investment horizon, etc, and therefore may at times have different contrary views on stocks sectors and markets.
Unauthorized disclosure, use, dissemination or copying (either whole or partial) of this information, is prohibited. The person accessing this information specifically agrees to exempt MOSt or any of its affiliates or
employees from, any and all responsibility/liability arising from such misuse and agrees not to hold MOSt or any of its affiliates or employees responsible for any such misuse and further agrees to hold MOSt or any of
its affiliates or employees free and harmless from all losses, costs, damages, expenses that may be suffered by the person accessing this information due to any errors and delays. The information contained herein is
based on publicly available data or other sources believed to be reliable. Any statements contained in this report attributed to a third party represent MOSt’s interpretation of the data, information and/or opinions
provided by that third party either publicly or through a subscription service, and such use and interpretation have not been reviewed by the third party. This Report is not intended to be a complete statement or
summary of the securities, markets or developments referred to in the document. While we would endeavor to update the information herein on reasonable basis, MOSt and/or its affiliates are under no obligation to
update the information. Also there may be regulatory, compliance, or other reasons that may prevent MOSt and/or its affiliates from doing so. MOSt or any of its affiliates or employees shall not be in any way
responsible and liable for any loss or damage that may arise to any person from any inadvertent error in the information contained in this report. MOSt or any of its affiliates or employees do not provide, at any time,
any express or implied warranty of any kind, regarding any matter pertaining to this report, including without limitation the implied warranties of merchantability, fitness for a particular purpose, and non-infringement.
The recipients of this report should rely on their own investigations.
This report is intended for distribution to institutional investors. Recipients who are not institutional investors should seek advice of their independent financial advisor prior to taking any investment decision based on
this report or for any necessary explanation of its contents.
Most and it’s associates may have managed or co-managed public offering of securities, may have received compensation for investment banking or merchant banking or brokerage services, may have received any
compensation for products or services other than investment banking or merchant banking or brokerage services from the subject company in the past 12 months.
Most and it’s associates have not received any compensation or other benefits from the subject company or third party in connection with the research report.
Subject Company may have been a client of Most or its associates during twelve months preceding the date of distribution of the research report
MOSt and/or its affiliates and/or employees may have interests/positions, financial or otherwise of over 1 % at the end of the month immediately preceding the date of publication of the research in the securities
mentioned in this report. To enhance transparency, MOSt has incorporated a Disclosure of Interest Statement in this document. This should, however, not be treated as endorsement of the views expressed in the
report.
Motilal Oswal Securities Limited is under the process of seeking registration under SEBI (Research Analyst) Regulations, 2014.
There are no material disciplinary action that been taken by any regulatory authority impacting equity research analysis activities
Analyst Certification
The views expressed in this research report accurately reflect the personal views of the analyst(s) about the subject securities or issues, and no part of the compensation of the research analyst(s) was, is, or will be
directly or indirectly related to the specific recommendations and views expressed by research analyst(s) in this report. The research analysts, strategists, or research associates principally responsible for preparation
of MOSt research receive compensation based upon various factors, including quality of research, investor client feedback, stock picking, competitive factors and firm revenues
Disclosure of Interest Statement
§
Analyst ownership of the stock
§
Served as an officer, director or employee
AMBUJA CEMENTS LTD
No
No
Disclosures
Ambuja Cements
Regional Disclosures (outside India)
For U.S.
This report is not directed or intended for distribution to or use by any person or entity resident in a state, country or any jurisdiction, where such distribution, publication, availability or use would be contrary to law,
regulation or which would subject MOSt & its group companies to registration or licensing requirements within such jurisdictions.
Motilal Oswal Securities Limited (MOSL) is not a registered broker - dealer under the U.S. Securities Exchange Act of 1934, as amended (the"1934 act") and under applicable state laws in the United States. In
addition MOSL is not a registered investment adviser under the U.S. Investment Advisers Act of 1940, as amended (the "Advisers Act" and together with the 1934 Act, the "Acts), and under applicable state laws in the
United States. Accordingly, in the absence of specific exemption under the Acts, any brokerage and investment services provided by MOSL, including the products and services described herein are not available to or
intended for U.S. persons.
This report is intended for distribution only to "Major Institutional Investors" as defined by Rule 15a-6(b)(4) of the Exchange Act and interpretations thereof by SEC (henceforth referred to as "major institutional
investors"). This document must not be acted on or relied on by persons who are not major institutional investors. Any investment or investment activity to which this document relates is only available to major
institutional investors and will be engaged in only with major institutional investors. In reliance on the exemption from registration provided by Rule 15a-6 of the U.S. Securities Exchange Act of 1934, as amended (the
"Exchange Act") and interpretations thereof by the U.S. Securities and Exchange Commission ("SEC") in order to conduct business with Institutional Investors based in the U.S., MOSL has entered into a chaperoning
agreement with a U.S. registered broker-dealer, Motilal Oswal Securities International Private Limited. ("MOSIPL"). Any business interaction pursuant to this report will have to be executed within the provisions of this
chaperoning agreement.
The Research Analysts contributing to the report may not be registered /qualified as research analyst with FINRA. Such research analyst may not be associated persons of the U.S. registered broker-dealer, MOSIPL,
and therefore, may not be subject to NASD rule 2711 and NYSE Rule 472 restrictions on communication with a subject company, public appearances and trading securities held by a research analyst account.
Motilal Oswal Capital Markets Singapore Pte Limited is acting as an exempt financial advisor under section 23(1)(f) of the Financial Advisers Act(FAA) read with regulation 17(1)(d) of the Financial Advisors
Regulations and is a subsidiary of Motilal Oswal Securities Limited in India. This research is distributed in Singapore by Motilal Oswal Capital Markets Singapore Pte Limited and it is only directed in Singapore to
accredited investors, as defined in the Financial Advisers Regulations and the Securities and Futures Act (Chapter 289), as amended from time to time.
In respect of any matter arising from or in connection with the research you could contact the following representatives of Motilal Oswal Capital Markets Singapore Pte Limited:
Anosh Koppikar
Kadambari Balachandran
Email : anosh.Koppikar@motilaloswal.com
Email : kadambari.balachandran@motilaloswal.com
Contact : (+65)68189232
Contact : (+65) 68189233 / 65249115
Office Address : 21 (Suite 31),16 Collyer Quay,Singapore 04931
For Singapore
18 February 2015
Motilal Oswal Securities Ltd
Motilal Oswal Tower, Level 9, Sayani Road, Prabhadevi, Mumbai 400 025
Phone: +91 22 3982 5500 E-mail: reports@motilaloswal.com
10