13 March 2015
Update | Sector: Consumer
ITC
BSE Sensex
29,135
S&P CNX
8,641
CMP: INR346
TP: INR375 (+8%)
Neutral
Downtrading on the anvil?
Ten key takeaways from interaction with cigarette channel partners
Stock Info
Bloomberg
Equity Shares (m)
52-Week Range (INR)
1, 6, 12 Rel. Per (%)
M.Cap. (INR b)
M.Cap. (USD b)
Avg Val. INRm/Vol‘000
Free float (%)
ITC IN
7953.2
410/312
-8/-9/-31
2,751.2
45.8
2849/8019
100.0
We met with several cigarette channel partners and ITC’s peers. Below are our
TEN key takeaways from our meetings.
Volume growth
for the industry may remain subdued in 4QFY15, with
various cigarette companies witnessing 8-10% volume decline. To an extent,
the industry may benefit from inventory building ahead of price hikes but
trade inventory pumping is limited this time and is unlikely to meaningfully
change the volume trends.
2.
4QFY15 performance
may also be impacted by high base, as 3QFY15 saw
inventory building ahead of price hikes. We note that ITC had reported an
estimated 3% volume decline in 4QFY14.
3.
Price hikes
may be rolled out from April. We gather from our interactions
that ITC has initiated 15% price hike in
Classic, Gold Flake Premium
(69mm)
and
Gold Flake Kings,
and 13% hike in
Navy Cut.
Prices are being increased
from INR68 to INR78 for
Gold Flake Premium,
from INR69 to INR78 for
Navy
Cut,
and from INR190 to INR218 for
Classic
and
Gold Flake Kings.
4.
Once ITC hikes prices, competitors generally follow suit.
5.
Downtrading:
There is a possibility of downtrading in FY16 from 69mm
cigarettes to 64mm cigarettes, given the quantum of price hikes in a
compressed timeframe. Performance of the 64mm segment can be resilient
in FY16. However, one more year of 25% hike in excise duty for this
segment may shift the price point towards INR4.5/5 and impact the
perception of price-value equation in the consumer’s mind.
6.
ITC launched Gold Flake Compact (offering in 74mm segment)
at
INR8.5/stick in certain markets a month ago. It has not yet been extended
nationally.
7.
Market share:
While ITC’s value market share have been stable, contraband
/illegal/duty-evaded segment has gained ~100bp market share in two years.
8.
The
Marlboro
brand is growing at a healthy rate of 20-25% on a small base
(Marlboro has less than 1% market share).
9.
Implementation of pictorial warnings
will begin from April 1, 2015 – 85% of
the space covered by warnings (60% pictorial, 25% textual) as against
existing 40%. This may be a long-term negative, though the short-term
impact could be limited, given that lose sticks account for 70% of cigarette
sales in India.
10.
The industry could shift to smaller pack sizes to mitigate the impact of ban
on loose sticks (as and when it comes). However, implementation of this
norm may be very difficult.
1.
Financial Snapshot (INR b)
Y/E March
2015E 2016E 2017E
Net Sales
365.0 402.4 446.3
EBITDA
137.7 149.9 168.0
Adj PAT
EPS (INR)
Gr. (%)
BV/Sh (INR)
RoE (%)
RoCE (%)
P/E (x)
P/BV (x)
98.0 107.9 123.9
12.3
11.5
36.7
35.3
44.0
28.1
9.4
13.6
10.1
40.7
35.0
43.4
25.5
8.5
15.6
14.9
45.4
36.2
44.1
22.2
7.6
Shareholding pattern (%)
As on
Dec-14 Sep-14 Dec-13
Promoter
0.0
0.0
0.0
DII
34.8
34.8
34.3
FII
21.0
20.5
19.5
Others
44.2
44.6 46.1d
Note: FII Includes depository receipts
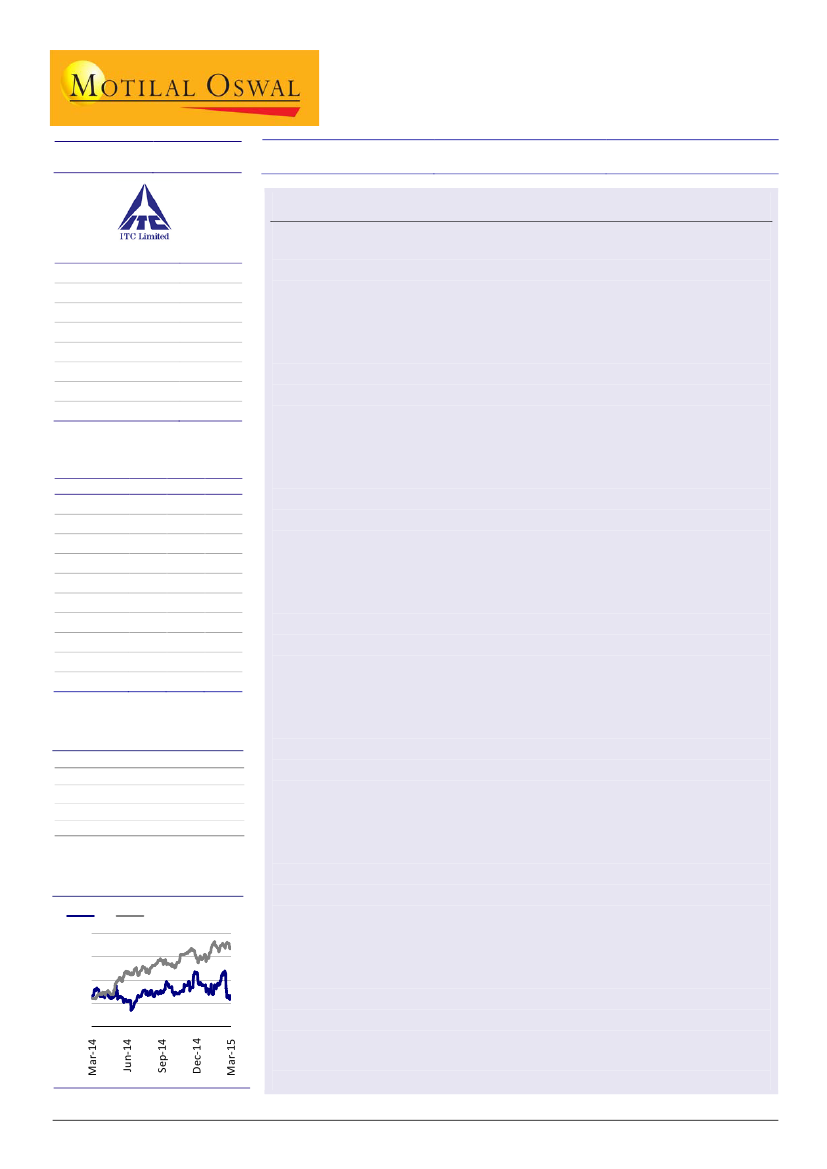
Stock Performance (1-year)
ITC
480
430
380
330
280
Sensex - Rebased
Gautam Duggad
(Gautam.Duggad@MotilalOswal.com); +91 22 3982 5404
Manish Poddar
(Manish.Poddar@MotilalOswal.com); +91 22 3027 8029

ITC
Valuation and view:
In the past, buying into the weakness after excise duty
increase has been rewarding. However, with the change in regime, we believe
the operating environment for the industry has changed meaningfully. Regular
increase in excise duties apart, the government is contemplating several other
punitive measures. News flow around this may act as an overhang for the stock.
While ITC’s pricing power, brand strength and competitive position remains
unchallenged, the external environment for the industry is turning adverse and
may crimp valuation multiples. We maintain NEUTRAL, with a target price of
INR375 (24x FY17E EPS; 15% discount to its three-year average). Upside risks
include VAT reduction in key states, while SUUTI stake sale may be the key
near-term overhang.
Exhibit 1: Price movement of key ITC brands
in INR
Gold Flake Regular
Wills Navy Cut
Gold Flake Kings
Classic
Length
69
74
84
84
Apr-12
4.5
4.9
5.8
5.8
Apr-13
5.8
5.9
6.8
6.8
Oct-14
6.9
6.8
9.5
9.5
Likely
Price
MRP/stick
Change
after hike
(%)
7.8
13.0
7.8
14.7
10.9
14.7
10.9
14.7
Source: Industry, MOSL
Investors are advised to refer through disclosures made at the end of the Research Report.
13 March 2015
2
Motilal Oswal research is available on
www.motilaloswal.com/Institutional-Equities,
Bloomberg, Thomson Reuters, Factset and S&P Capital.

ITC
Summary of Cigarette financials
Exhibit 2: Weighted average 13% excise duty hike
Excise Rate (INR/1000
FY03 FY04 FY05 FY06 FY07 FY08 FY09
cigarettes)
Small Filter <65mm
-
-
-
-
-
-
-
Filter-Regular 66-70mm
670
670
683
740
780
819
819
Filter-Long 71-75mm
1,090 1,090 1,112 1,200 1,260 1,323 1,323
Filter-King 76-85mm
1,450 1,450 1,479 1,595 1,675 1,759 1,759
Filter-Extra Large 86-
1,780 1,780 1,816 1,960 2,060 2,163 2,163
100mm
Growth
Small Filter <65mm
Filter-Regular 66-70mm
0.0% 0.0%
1.9% 8.3% 5.4% 5.0%
0.0%
Filter-Long 71-75mm
0.0% 0.0%
2.0% 7.9% 5.0% 5.0%
0.0%
Filter-King 76-85mm
0.0% 0.0%
2.0% 7.8% 5.0% 5.0%
0.0%
Filter-Extra Large 86-
0.0% 0.0%
2.0% 7.9% 5.1% 5.0%
0.0%
100mm
Note: Reported excise duties in the table do not include education cess of 3%
FY10
-
819
1,323
1,759
2,163
FY11
669
969
1,473
1,959
2,363
FY12
669
969
1,473
1,959
2,363
0.0%
0.0%
0.0%
0.0%
0.0%
FY13
669
1,194
1,718
2,309
2,788
FY14
669
1,409
2,027
2,725
3,290
FY15
1,150
1,650
2,250
NA
3,290
FY16E
1,440
1,900
2,590
NA
3,790
0.0%
0.0%
0.0%
0.0%
18.3%
11.3%
11.4%
9.2%
0.0% 0.0% 71.9%
25.2%
23.2% 18.0% 17.9%
15.2%
16.6% 18.0% 11.0%
15.1%
17.9% 18.0%
NA
NA
18.0% 18.0%
0.0%
15.2%
Source: Company, MOSL
Exhibit 3: In the recent past, Cigarette EBIT growth has been resilient despite higher excise duty hike
Excise vs. EBIT growth
FY02 FY03 FY04 FY05 FY06 FY07
Excise increase in budget (%)
15
0
0
2
8
5.4
EBIT growth (%)
6.0
13.6
5.7
12.6
18.3
17.1
Note: FY08 - VAT on Cigarettes imposed; FY09- Excise on non-filter increased 3x-5x
FY08
5
14.6
FY09
0
15.1
FY10
0
18.0
FY11
9-18
16.8
FY12 FY13 FY14
0
18-23
18
19.8
20.5
18.4
Source: Company, MOSL
Exhibit 4: Cigarette per Stick Economics
Cigarette/stick economics
Volume (bn sticks)
Growth
Cig gross sales (INR bn)
Growth
Gross realization/stick (INR)
Growth
Total excise on cigarettes
(INR b)
Excise/stick (INR)
Growth
Net realization/stick (INR)
Growth
Cig EBIT (INR bn)
Growth
Cig EBIT/stick (INR)
Growth
Cig EBIT margin (%)
(on gross sales)
FY02
60.9
-8.4%
79.4
4.6%
1.30
14.2%
46.9
0.77
14.9%
0.53
13.3%
16.9
6.0%
0.28
15.8%
21.3%
FY03
63.4
4.2%
87.6
10.3%
1.38
5.9%
50.7
0.80
3.8%
0.58
8.8%
19.2
13.6%
0.30
9.0%
22.0%
FY04
65.4
3.1%
92.3
5.4%
1.41
2.2%
52.6
0.81
0.6%
0.61
4.5%
20.3
5.7%
0.31
2.5%
22.0%
FY05
70.0
7.1%
99.8
8.1%
1.43
1.0%
55.4
0.79
-1.7%
0.63
4.5%
22.9
12.6%
0.33
5.1%
22.9%
FY06
75.9
8.4%
113.2
13.4%
1.49
4.6%
62.2
0.82
3.6%
0.67
5.9%
27.1
18.3%
0.36
9.2%
23.9%
FY07
81.3
7.1%
128.2
13.3%
1.58
5.8%
68.7
0.84
3.0%
0.73
9.1%
31.7
17.1%
0.39
9.4%
24.7%
FY08
80.7
-0.7%
138.2
7.7%
1.71
8.5%
71.9
0.89
5.4%
0.82
11.9%
36.3
14.6%
0.45
15.3%
26.3%
FY09
78.4
-2.9%
151.0
9.3%
1.93
12.6%
75.6
0.96
8.3%
0.96
17.3%
41.8
15.1%
0.53
18.6%
27.7%
FY10
84.0
7.2%
172.8
14.4%
2.06
6.7%
79.6
0.95
-1.8%
1.11
15.2%
49.4
18.0%
0.59
10.1%
28.6%
FY11
81.7
-2.8%
198.2
14.7%
2.43
18.0%
92.5
1.13
19.5%
1.29
16.6%
57.7
16.8%
0.71
20.1%
29.1%
FY12
87.4
7.0%
222.5
12.2%
2.55
4.9%
99.3
1.14
0.3%
1.41
9.0%
69.1
19.8%
0.79
12.0%
31.0%
FY13
89.2
2.0%
FY14
86.7
-2.8%
259.9 290.8
16.8% 11.9%
2.95
3.35
16.0% 13.6%
122.6 136.2
1.38
1.57
21.1% 14.3%
1.58
1.78
11.9% 13.1%
83.3
98.6
20.5% 18.4%
0.93
1.14
18.2% 21.8%
32.0% 33.9%
Source: Company, MOSL
13 March 2015
3

ITC
Exhibit 5: Cigarette: growth in key parameters
Key Cig operating metrics
10 year
Cig Volumes
2.9%
Cig gross sales
12.2%
Gross realization/stick
9.0%
Total excise on cigarettes
10.0%
Excise/stick
6.9%
Net realization/stick
11.4%
Cig EBIT
17.1%
Cig EBIT/stick
13.8%
Note: Data as on FY14 for CAGR calculation
CAGR
5 year
3 year
2.0%
2.0%
14.0%
13.6%
11.7%
11.4%
12.5%
13.8%
10.3%
11.5%
13.1%
11.3%
18.7%
19.6%
16.3%
17.2%
Source: Company, MOSL
Exhibit 6: Cig excise contributes 8-9% of total excise revenues
Cig Excise (as % of total excise)
Source: Company, MOSL
Exhibit 7: Cig forms only 15% of Tobacco consumption
Cig as a % of total tobacoo consumption (value)
23
21
20
17
14
15
Exhibit 8: …but contributes 74% of tobacco taxation
Contribution to Tobacco consumption
Contribution to Tobacco taxation
85
74
15
26
FY72
FY82
FY92
FY03
FY10
FY12
Cig
Non-Cig
Exhibit 9: Cig volumes declined 13% in 3Q15
Volume growth (%)
3.3
-2.9
-2.8
-0.3
7.2
7.6
-2.5
-4.0
-13.0
Exhibit 10: Expect Sales CAGR of 10.6% over FY15-17E
Sales (INR b)
16.3
16.6
17.2
19.4
11.1
11.0
10.3
10.9
Sales growth (%)
182
212
248
296
329
365
402
446
Exhibit 11: EBITDA CAGR of 10.4% over FY15-17E
Gross Margin (%)
57.3
58.6
55.6
36.0
EBITDA Margin (%)
57.0
37.9
57.7
37.7
57.9
58.4
Exhibit 12: PAT CAGR of 12.5% over FY15-17E
PAT (INR b)
PAT Margin (%)
26.7
24.8
25.1
23.6
22.4
40.7
49.9
61.6
74.2
87.9
98.0
107.9
123.9
26.8
26.8
27.8
34.9
35.0
35.8
37.3
37.6
Source: Company, MOSL
13 March 2015
4

ITC
Financials and valuations
Income Statement
Y/E March
Net Sales
Operational Income
Total Revenue
Change (%)
Total Expenditure
EBITDA
Change (%)
Margin (%)
Depreciation
Int. and Fin. Charges
Other Inc. - Recurring
Profit before Taxes
Change (%)
Margin (%)
Tax
Deferred Tax
Tax Rate (%)
Profit after Taxes
Change (%)
Margin (%)
Reported PAT
Balance Sheet
Y/E March
Share Capital
Reserves
Net Worth
Loans
Deferred Liability
Capital Employed
Gross Block
Less: Accum. Depn.
Net Fixed Assets
Capital WIP
Investments
Current
Non-current
Curr. Assets, L&A
Inventory
Account Receivables
Cash and Bank Balance
Others
Curr. Liab. and Prov.
Account Payables
Other Liabilities
Provisions
Net Current Assets
Application of Funds
E: MOSL Estimates
2010
181,532
2,392
183,924
16.4
120,619
63,305
24.8
34.9
6,087
820
3,756
60,153
24.7
33.1
20,286
-822
32.4
40,689
24.7
22.4
40,689
2011
211,676
2,914
214,590
16.7
140,467
74,123
17.1
35.0
6,560
679
5,798
72,682
20.8
34.3
22,804
2
31.4
49,876
22.6
23.6
49,876
2012
247,984
3,490
251,475
17.2
162,788
88,687
19.6
35.8
6,985
980
8,253
88,975
22.4
35.9
26,777
574
30.7
61,624
23.6
24.8
61,624
2013
296,056
2,957
299,013
18.9
192,543
106,470
20.1
36.0
7,956
1,059
9,387
106,842
20.1
36.1
29,348
3,310
30.6
74,184
20.4
25.1
74,184
2014
328,826
3,560
332,386
11.2
207,631
124,755
17.2
37.9
8,999
236
11,071
126,591
18.5
38.5
37,911
828
30.6
87,852
18.4
26.7
87,852
2015E
364,976
4,553
369,528
11.2
231,805
137,723
10.4
37.7
9,886
546
14,114
141,405
11.7
38.7
43,129
283
30.7
97,994
11.5
26.8
97,994
2016E
402,395
5,009
407,403
10.2
257,493
149,911
8.8
37.3
10,866
492
17,118
155,671
10.1
38.7
47,480
311
30.7
107,880
10.1
26.8
107,880
(INR Million)
2017E
446,280
5,761
452,041
11.0
284,046
167,995
12.1
37.6
11,846
442
20,580
176,286
13.2
39.5
52,004
353
29.7
123,929
14.9
27.8
123,929
(INR Million)
2017E
7,953
352,948
360,901
511
10,862
372,275
241,756
94,867
146,889
25,000
142,006
116,885
25,122
231,340
115,994
24,454
58,016
32,876
172,960
82,171
16,431
74,357
58,380
372,275
2010
3,818
136,826
140,644
1,077
7,850
149,571
119,679
38,255
81,424
10,090
57,269
46,982
10,287
81,279
45,491
8,581
11,263
15,945
80,491
34,449
7,860
38,182
788
149,571
2011
7,738
151,795
159,533
1,093
8,019
168,645
127,658
44,208
83,451
13,334
55,547
42,189
13,358
97,901
52,692
8,851
22,432
13,926
81,588
39,792
7,362
34,435
16,313
168,644
2012
7,818
180,101
187,919
791
8,727
197,437
138,033
48,197
89,837
23,923
63,166
43,633
19,533
112,957
56,378
9,824
28,189
18,565
92,445
46,989
10,273
35,183
20,512
197,437
2013
7,902
214,977
222,879
664
12,037
235,580
165,884
54,698
111,186
15,786
70,603
50,594
20,009
142,600
66,002
11,633
36,150
28,815
104,595
50,571
12,540
41,485
38,006
235,580
2014
7,953
254,667
262,620
511
12,970
276,101
181,756
62,269
119,487
23,598
88,234
63,113
25,122
160,975
73,595
21,654
32,894
32,832
116,193
54,498
13,976
47,719
44,782
276,101
2015E
7,953
283,869
291,822
511
12,335
304,668
201,756
72,155
129,601
25,000
97,552
72,430
25,122
187,668
95,169
21,999
41,972
28,528
135,152
63,229
13,128
58,796
52,515
304,668
2016E
7,953
316,017
323,971
511
11,637
336,119
221,756
83,021
138,735
25,000
114,151
89,029
25,122
209,604
104,679
22,049
52,311
30,565
151,370
72,192
14,449
64,728
58,234
336,120
13 March 2015
5

ITC
Financials and valuations
Ratios
Y/E March
Basic (INR)
EPS
Cash EPS
BV/Share
DPS
Payout %
Valuation (x)
P/E
Cash P/E
EV/Sales
EV/EBITDA
P/BV
Dividend Yield (%)
Return Ratios (%)
RoE
RoCE
Working Capital Ratios
Debtor (Days)
Asset Turnover (x)
Leverage Ratio
Debt/Equity (x)
Cash Flow Statement
Y/E March
OP/(loss) before Tax
Int./Div. Received
Depreciation and Amort.
Interest Paid
Direct Taxes Paid
Incr in WC
Diff in dep
CF from Operations
Extraordinary Items
Incr Decr in FA
Pur of Investments
CF from Invest.
Issue of shares
Incr in Debt
Interest Income
Interest Paid
Dividend Paid
Others
CF from Fin. Activity
Incr of Cash
Add: Opening Balance
Closing Balance
2010
10.7
12.3
36.8
10.0
93.8
2011
6.4
7.3
20.6
4.5
69.0
2012
7.9
8.8
24.0
4.5
57.1
2013
9.4
10.4
28.2
5.3
55.9
2014
11.0
12.2
33.0
6.0
54.3
2015E
12.3
13.6
36.7
7.4
60.0
2016E
13.6
14.9
40.7
8.1
60.0
2017E
15.6
17.1
45.4
9.3
60.0
32.5
28.5
14.5
41.7
9.4
2.9
53.7
47.4
12.4
35.5
16.8
1.3
43.9
39.4
10.5
29.5
14.4
1.3
36.9
33.3
8.8
24.4
12.3
1.5
31.3
28.4
7.9
20.7
10.5
1.7
28.1
25.5
7.0
18.6
9.4
2.1
25.5
23.2
6.3
16.9
8.5
2.4
22.2
20.3
5.6
14.9
7.6
2.7
29.3
38.5
33.2
42.5
35.5
44.6
36.1
45.5
36.2
45.2
35.3
44.0
35.0
43.4
36.2
44.1
15
1.2
15
1.3
14
1.3
13
1.3
18
1.2
22
1.2
20
1.2
19
1.2
0.0
0.0
0.0
0.0
0.0
0.0
0.0
0.0
(INR Million)
2017E
176,286
20,580
11,846
442
52,357
22,296
0
93,341
0
20,000
27,856
-47,856
0
0
20,580
442
64,728
4,810
-39,781
5,705
52,311
58,016
2010
60,153
3,756
6,087
820
19,464
-6,956
700
51,497
0
12,041
28,891
-40,933
7,207
-698
3,756
820
13,965
-5,091
-9,612
953
10,310
11,263
2011
72,682
5,798
6,560
679
22,806
-438
607
52,362
0
11,224
-1,722
-9,502
5,220
16
5,798
679
38,182
-3,864
-31,691
11,170
11,263
22,433
2012
88,975
8,253
6,985
980
27,352
-114
2,996
64,445
1
20,964
7,619
-28,582
7,650
-303
8,253
980
34,435
-10,292
-30,106
5,757
22,432
28,189
2013
106,842
9,387
7,956
1,059
32,658
16,494
1,454
58,771
2
19,714
7,437
-27,149
9,223
-127
9,387
1,059
35,183
-5,903
-23,662
7,961
28,189
36,150
2014
126,591
11,071
8,999
236
38,739
22,551
1,428
64,893
3
23,684
17,631
-41,313
6,911
-153
11,071
236
41,485
-2,946
-26,837
-3,257
36,150
32,893
2015E
141,405
14,114
9,886
546
43,411
7,972
0
86,340
0
21,402
9,318
-30,720
0
0
14,114
546
47,719
-12,390
-46,542
9,078
32,894
41,972
2016E
155,671
17,118
10,866
492
47,791
11,978
0
90,141
0
20,000
16,599
-36,599
0
0
17,118
492
58,796
-1,034
-43,203
10,339
41,972
52,311
13 March 2015
6

ITC
Corporate profile: ITC
Company description
ITC is an associate of BAT (British American
Tobacco) controls more than 2/3rd of the cigarette
market in India. ITC has emerged as a diversified
conglomerate
with
leading
presence
in
Paperboards, Hotels and Processed foods. E-
Choupal, the agri rural initiative of the company has
been widely appreciated for its foresight in
harnessing the potential in the rural market.
Exhibit 18: Sensex rebased
ITC
480
430
380
330
280
Mar-14
Jun-14
Sep-14
Dec-14
Mar-15
Sensex - Rebased
Shareholding pattern (%)
Dec-14
Promoter
DII
FII
Others
0.0
34.8
21.0
44.2
Sep-14
0.0
34.8
20.5
44.6
Dec-13
0.0
34.3
19.5
46.1
Top holders
Holder Name
Tobacco Manufacturers India Ltd
LIC of India
Specified Undertaking Of the Unit Trust Of India
Myddleton Investment Company Ltd
New India Assurance Company Ltd
% Holding
24.8
14.5
11.2
4.1
1.9
Note: FII Includes depository receipts
Top management
Name
Yogesh Chander Deveshwar
Biswa Behari Chatterjee
Designation
Chairman
Executive VP & CS
Directors
Name
Yogesh Chander Deveshwar
Anil Baijal*
S S H Rehman*
Meera Shankar*
Serajul Haq Khan*
Sunil Behari Mathur*
Angara Venkata Girija Kumar*
Pillappakkam Bahukutumbi
Ramanujam*
R E Lerwill*
Name
Kurush Noshir Grant
Krishnamoorthy Vaidyanath
Biswa Behari Chatterjee
Arun Duggal*
Nakul Anand
Pradeep Vasant Dhobale
S Banerjee*
S B Mainak
Kurush Noshir Grant
*Independent
Auditors
Name
Deloitte Haskins & Sells
P Raju Iyer
S Mahadevan & Co
Shome & Banerjee
Type
Statutory
Cost Auditor
Cost Auditor
Cost Auditor
MOSL forecast v/s consensus
EPS (INR)
FY15
FY16
FY17
MOSL forecast
12.3
13.6
15.6
Consensus
forecast
12.4
14.0
16.1
Variation (%)
-1.1
-2.7
-3.2
13 March 2015
7

This document has been prepared by Motilal Oswal Securities Limited (hereinafter referred to as Most) to provide information about the company(ies) and/sector(s), if any, covered in the report and may be
ITC
distributed by it and/or its affiliated company(ies). This report is for personal information of the selected recipient/s and does not construe to be any investment, legal or taxation advice to you. This research report does
not constitute an offer, invitation or inducement to invest in securities or other investments and Motilal Oswal Securities Limited (hereinafter referred as MOSt) is not soliciting any action based upon it. This report is not
for public distribution and has been furnished to you solely for your general information and should not be reproduced or redistributed to any other person in any form. This report does not constitute a personal
recommendation or take into account the particular investment objectives, financial situations, or needs of individual clients. Before acting on any advice or recommendation in this material, investors should consider
whether it is suitable for their particular circumstances and, if necessary, seek professional advice. The price and value of the investments referred to in this material and the income from them may go down as well as
up, and investors may realize losses on any investments. Past performance is not a guide for future performance, future returns are not guaranteed and a loss of original capital may occur.
MOSt and its affiliates are a full-service, integrated investment banking, investment management, brokerage and financing group. We and our affiliates have investment banking and other business relationships with a
some companies covered by our Research Department. Our research professionals may provide input into our investment banking and other business selection processes. Investors should assume that MOSt and/or
its affiliates are seeking or will seek investment banking or other business from the company or companies that are the subject of this material and that the research professionals who were involved in preparing this
material may educate investors on investments in such business. The research professionals responsible for the preparation of this document may interact with trading desk personnel, sales personnel and other
parties for the purpose of gathering, applying and interpreting information. Our research professionals are paid on the profitability of MOSt which may include earnings from investment banking and other business.
MOSt generally prohibits its analysts, persons reporting to analysts, and members of their households from maintaining a financial interest in the securities or derivatives of any companies that the analysts cover.
Additionally, MOSt generally prohibits its analysts and persons reporting to analysts from serving as an officer, director, or advisory board member of any companies that the analysts cover. Our salespeople, traders,
and other professionals or affiliates may provide oral or written market commentary or trading strategies to our clients that reflect opinions that are contrary to the opinions expressed herein, and our proprietary
trading and investing businesses may make investment decisions that are inconsistent with the recommendations expressed herein. In reviewing these materials, you should be aware that any or all of the foregoing
among other things, may give rise to real or potential conflicts of interest. MOSt and its affiliated company(ies), their directors and employees and their relatives may; (a) from time to time, have a long or short position
in, act as principal in, and buy or sell the securities or derivatives thereof of companies mentioned herein. (b) be engaged in any other transaction involving such securities and earn brokerage or other compensation
or act as a market maker in the financial instruments of the company(ies) discussed herein or act as an advisor or lender/borrower to such company(ies) or may have any other potential conflict of interests with
respect to any recommendation and other related information and opinions.; however the same shall have no bearing whatsoever on the specific recommendations made by the analyst(s), as the recommendations
made by the analyst(s) are completely independent of the views of the affiliates of MOSt even though there might exist an inherent conflict of interest in some of the stocks mentioned in the research report
Reports based on technical and derivative analysis center on studying charts company's price movement, outstanding positions and trading volume, as opposed to focusing on a company's fundamentals and, as
such, may not match with a report on a company's fundamental analysis. In addition MOST has different business segments / Divisions with independent research separated by Chinese walls catering to different set
of customers having various objectives, risk profiles, investment horizon, etc, and therefore may at times have different contrary views on stocks sectors and markets.
Unauthorized disclosure, use, dissemination or copying (either whole or partial) of this information, is prohibited. The person accessing this information specifically agrees to exempt MOSt or any of its affiliates or
employees from, any and all responsibility/liability arising from such misuse and agrees not to hold MOSt or any of its affiliates or employees responsible for any such misuse and further agrees to hold MOSt or any of
its affiliates or employees free and harmless from all losses, costs, damages, expenses that may be suffered by the person accessing this information due to any errors and delays. The information contained herein is
based on publicly available data or other sources believed to be reliable. Any statements contained in this report attributed to a third party represent MOSt’s interpretation of the data, information and/or opinions
provided by that third party either publicly or through a subscription service, and such use and interpretation have not been reviewed by the third party. This Report is not intended to be a complete statement or
summary of the securities, markets or developments referred to in the document. While we would endeavor to update the information herein on reasonable basis, MOSt and/or its affiliates are under no obligation to
update the information. Also there may be regulatory, compliance, or other reasons that may prevent MOSt and/or its affiliates from doing so. MOSt or any of its affiliates or employees shall not be in any way
responsible and liable for any loss or damage that may arise to any person from any inadvertent error in the information contained in this report. MOSt or any of its affiliates or employees do not provide, at any time,
any express or implied warranty of any kind, regarding any matter pertaining to this report, including without limitation the implied warranties of merchantability, fitness for a particular purpose, and non-infringement.
The recipients of this report should rely on their own investigations.
This report is intended for distribution to institutional investors. Recipients who are not institutional investors should seek advice of their independent financial advisor prior to taking any investment decision based on
this report or for any necessary explanation of its contents.
Most and it’s associates may have managed or co-managed public offering of securities, may have received compensation for investment banking or merchant banking or brokerage services, may have received any
compensation for products or services other than investment banking or merchant banking or brokerage services from the subject company in the past 12 months.
Most and it’s associates have not received any compensation or other benefits from the subject company or third party in connection with the research report.
Subject Company may have been a client of Most or its associates during twelve months preceding the date of distribution of the research report
MOSt and/or its affiliates and/or employees may have interests/positions, financial or otherwise of over 1 % at the end of the month immediately preceding the date of publication of the research in the securities
mentioned in this report. To enhance transparency, MOSt has incorporated a Disclosure of Interest Statement in this document. This should, however, not be treated as endorsement of the views expressed in the
report.
Motilal Oswal Securities Limited is under the process of seeking registration under SEBI (Research Analyst) Regulations, 2014.
There are no material disciplinary action that been taken by any regulatory authority impacting equity research analysis activities
Analyst Certification
The views expressed in this research report accurately reflect the personal views of the analyst(s) about the subject securities or issues, and no part of the compensation of the research analyst(s) was, is, or will be
directly or indirectly related to the specific recommendations and views expressed by research analyst(s) in this report. The research analysts, strategists, or research associates principally responsible for preparation
of MOSt research receive compensation based upon various factors, including quality of research, investor client feedback, stock picking, competitive factors and firm revenues
Disclosure of Interest Statement
Analyst ownership of the stock
Served as an officer, director or employee
ITC
No
No
Disclosures
Regional Disclosures (outside India)
For U.S.
This report is not directed or intended for distribution to or use by any person or entity resident in a state, country or any jurisdiction, where such distribution, publication, availability or use would be contrary to law,
regulation or which would subject MOSt & its group companies to registration or licensing requirements within such jurisdictions.
Motilal Oswal Securities Limited (MOSL) is not a registered broker - dealer under the U.S. Securities Exchange Act of 1934, as amended (the"1934 act") and under applicable state laws in the United States. In
addition MOSL is not a registered investment adviser under the U.S. Investment Advisers Act of 1940, as amended (the "Advisers Act" and together with the 1934 Act, the "Acts), and under applicable state laws in the
United States. Accordingly, in the absence of specific exemption under the Acts, any brokerage and investment services provided by MOSL, including the products and services described herein are not available to or
intended for U.S. persons.
This report is intended for distribution only to "Major Institutional Investors" as defined by Rule 15a-6(b)(4) of the Exchange Act and interpretations thereof by SEC (henceforth referred to as "major institutional
investors"). This document must not be acted on or relied on by persons who are not major institutional investors. Any investment or investment activity to which this document relates is only available to major
institutional investors and will be engaged in only with major institutional investors. In reliance on the exemption from registration provided by Rule 15a-6 of the U.S. Securities Exchange Act of 1934, as amended (the
"Exchange Act") and interpretations thereof by the U.S. Securities and Exchange Commission ("SEC") in order to conduct business with Institutional Investors based in the U.S., MOSL has entered into a chaperoning
agreement with a U.S. registered broker-dealer, Motilal Oswal Securities International Private Limited. ("MOSIPL"). Any business interaction pursuant to this report will have to be executed within the provisions of this
chaperoning agreement.
The Research Analysts contributing to the report may not be registered /qualified as research analyst with FINRA. Such research analyst may not be associated persons of the U.S. registered broker-dealer, MOSIPL,
and therefore, may not be subject to NASD rule 2711 and NYSE Rule 472 restrictions on communication with a subject company, public appearances and trading securities held by a research analyst account.
Motilal Oswal Capital Markets Singapore Pte Limited is acting as an exempt financial advisor under section 23(1)(f) of the Financial Advisers Act(FAA) read with regulation 17(1)(d) of the Financial Advisors
Regulations and is a subsidiary of Motilal Oswal Securities Limited in India. This research is distributed in Singapore by Motilal Oswal Capital Markets Singapore Pte Limited and it is only directed in Singapore to
accredited investors, as defined in the Financial Advisers Regulations and the Securities and Futures Act (Chapter 289), as amended from time to time.
In respect of any matter arising from or in connection with the research you could contact the following representatives of Motilal Oswal Capital Markets Singapore Pte Limited:
Anosh Koppikar
Kadambari Balachandran
Email : anosh.Koppikar@motilaloswal.com
Email : kadambari.balachandran@motilaloswal.com
Contact : (+65)68189232
Contact : (+65) 68189233 / 65249115
Office Address : 21 (Suite 31),16 Collyer Quay,Singapore 04931
For Singapore
Motilal Oswal Securities Ltd
13 March 2015
Motilal Oswal Tower, Level 9, Sayani Road, Prabhadevi, Mumbai 400 025
Phone: +91 22 3982 5500 E-mail: reports@motilaloswal.com
8