Sector Update | 28 April 2015
Technology
Is the party over?
Revenue miss across top tier; pricing pressure, and a contrarian perspective
n
n
n
n
Weak revenue trends suggest pressure to growth from new technologies at tier-I. But
Accenture’s example suggests capabilities can drive sanguine growth
Currencies and seasonal US weakness seem to be key factors dragging revenues,
than any structural concerns
Pricing pressure is increasingly evident, but its impact on margins not yet
Currency-led earnings pressures may weigh on near-term valuations
Digital is BIG, but is it for the BIG?
That is the question coming up after the revenue miss across top tier in 4QFY15,
with noticeable pricing pressure in at least two of the top four and the consequent
fear that Digital may be cannibalizing more existing revenue than adding new ones.
But we do not believe it is a absolute gloomy scenario for larger companies in the
long run yet. Those gunning to aggressively build capabilities will still flourish –
Accenture, ~2x size of TCS, proved this recently (2 quarters of guidance uptick).
Growth dismal but not falling off a cliff, currencies are!
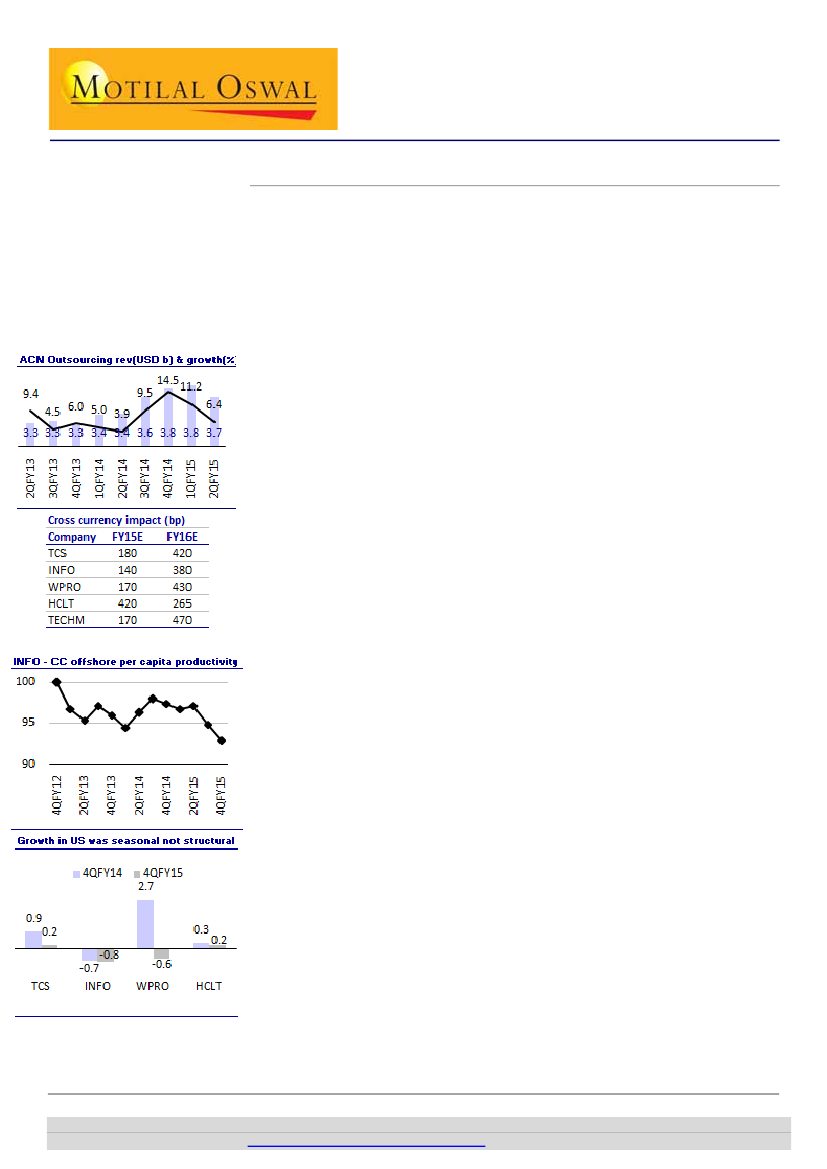
Constant currency (CC) growth in 4QFY15 came below expectations across the
board. But we note that YoY CC growth in 4QFY15 decelerated at TCS, has been the
same as 3Q at INFO, within a range at WPRO and has accelerated at HCLT in the last
two quarters. Even weak Americas was more seasonal than structural – growth
band was same as 4QFY14, with the exception of WPRO.
Pricing is a trend to watch for; factors protecting OPM
INFO’s pricing declined 1.7% QoQ in CC in each of the last two quarters, but margin
performance remained strong. TCS’ realization has been trending down, without
hurting its margin band, and likewise for WPRO. Currency and then utilization have
had offsetting impact at TCS, INFO and WPRO. This quarter we heard lot of
commentary on progress in automation, which is encouraging and imperative.
Prefer change resilience, though near term stress may prevail
n
n
INFO guided for 380bp impact from cross currency to USD revenue growth, and
has greater exposure to USD bookings. Thus, WPRO, TECHM and TCS may suffer
~450bp hit in FY16E, with marginally higher impact on earnings too. Hence, EPS
growth across tier-I will likely be in high single digits, with leaders managing low
double digits, at best. That will likely weigh on near-term valuations.
As the new order establishes itself, industry growth may struggle to overcome
low double digits in the foreseeable future. In this shift, betting in the sector is
getting increasingly selective than being secular. Our preference is for
companies that are more resilient to these pressures either due to quicker
adoption of new offerings going forward (INFO – build and buy), or growth
drivers insulated due to lower penetration (HCLT – Engineering Services and
TECHM – Network Services).
Ashish Chopra
(Ashish.Chopra@MotilalOswal.com); +91 22 3982 5424
Siddharth Vora
(Siddharth.Vora@MotilalOswal.com); +91 22 3982 5585
Investors are advised to refer through disclosures made at the end of the Research Report.
Motilal Oswal research is available on
www.motilaloswal.com/Institutional-Equities,
Bloomberg, Thomson Reuters, Factset and S&P Capital.

Technology | Update
Growth disappointed, yes…
…but while seasonality and currency prevailed, YoY CC is a different picture
Constant currency growth in 4QFY15 came largely below expectations across the
board, on top of the weak 4Q seasonality. However, only one quarter back, the
muted expectations of 3Q seasonality were well beaten too.
Exhibit 1: CC QoQ growth came below estimate across the board in 4Q, while there were beats in seasonally weak 3Q
4QFY15 CC USD revenue growth (%)
Expected
2.7
1.6
2.7
Actual
2.5
1.2
3.9
2.7
3.1
2.5
2.8 2.6
3
3QFY15 CC USD revenue growth (%)
Expected
Actual
3.7
6.2
3.3
TCS
-0.4
INFO
WPRO
HCLT
TCS
INFO
WPRO
HCLT
Source: Company, MOSL
The scenario is a lot less bleak when we look at the trend across the companies in
constant currency YoY:
n
Over the past four quarters, only TCS witnessed a growth trajectory, which is
declining (1.5pp).
n
At INFO and WPRO, it has been range bound and slightly volatile.
n
HCLT, contrary to peers, has seen some acceleration in the past couple of
quarters – despite continuous slowing in IMS. Engineering services is providing
the offsetting impact at HCLT.
Exhibit 2: Growth deceleration at TCS and WPRO
Source: Company, MOSL
28 April 2015
2

Technology | Update
Disconcerting trend in the US…
…not so worrisome, except for de-energized WPRO
YoY growth in US intact at INFO, HCLT
Weak growth in the US was one of the alarming trend witnessed across the top tier
IT, with all companies’ QoQ growth ranging between -0.8% to +0.2%. However, on a
closer observation, it appears more of seasonality than a structural issue:
n
Even in 4QFY14, with the exception of WPRO, sequential growth across the top
tier was between -0.7% to +0.9%.
n
Also, on a YoY basis, growth from the US is stable across INFO and HCLT, and
declined in TCS marginally on the back of client-specific issues in Telecom.
WPRO, however, reflected a more disconcerting trend, with two quarters of
double digit growth coming down to 6.7% - possibly on headwinds in the Energy
vertical.
Exhibit 3: Ex-WPRO, growth in US reflected the similar trend Exhibit 4: YoY, like in overall company, growth is reducing at
of last year
TCS, and more disconcertingly at WPRO
4QFY14
4QFY15
2.7
1QFY15
2QFY15
3QFY15
4QFY15
0.9
0.2
0.3 0.2
TCS
-0.7 -0.8
INFO
-0.6
WPRO
HCLT
TCS
INFO
WPRO
HCLT
Source: Company, MOSL
Management commentary too did not cite any secular nature of trouble for the
weak performance of the region:
n
TCS:
We do not see any headwinds in North America. This quarter has been a
very marginal growth on a constant currency basis because the quarter itself is
pretty muted and then we have had the hit that we took in Telecom which also
come from North America. But other than that, there is nothing else.
n
INFO:
There is no real difference between Europe and North America. It may
vary from industry to industry. For instance, in manufacturing, we are seeing
better pipeline in Americas than in Europe.
n
WIPRO:
The kind of work that we are getting in from the US, the ‘Run’ business
pricing is clearly under pressure, because of consolidation, but at the ‘Change’
side of the business, we are finding significant opportunities coming up
especially around Digital.
n
HCLT:
On the ESI side, we saw negative growth in this quarter, for two specific
reasons, both of them from North America - Large fixed price projects that
completed in the OND quarter and moved from build into run. We continue to
see churn in Americas in the renewal market and we continue to believe that's
an important market for us and we should see growth at least on the ITO side
and the engineering side and some of the non-discretionary spend.
28 April 2015
3

Technology | Update
Reading into the alarming pricing
Two quarters of decline at INFO; sharp ADM plummet at WPRO
INFO’s pricing decline of 1.7% QoQ in CC for the second consecutive quarter was
one of the more troublesome data-points during the quarter. That, along with
WPRO’s decline in ADM business and TCS’ largely cooling revenue productivity is a
key area one needs to be watchful of.
Pricing pressure in traditional businesses is not new and has now been ongoing for a
couple of years at least. While the pricing declines are evident at INFO, its levers of
curtailing the proportion of onsite salary costs and utilization, among others, have
been aggressively exercised in the past, driving a healthy performance on
profitability.
Exhibit 5: INFO and TCS both have seen pricing pressure in constant currency basis during FY13-15
INFO - Qoq change in per capita productivity - CC
Onsite
110
105
100
95
90
Offshore
102
100
98
96
94
92
TCS - CC Picing indexed at 100
Source: Company, MOSL
Exhibit 6: Declining ADM revenue for WPRO is indicative of pricing pressure in traditional
services
ADM Revenues (USD m)
-3.8
-9.7
-2.7
-1.6
-0.4
Change (YoY %)
-4.2
-11.5
-14.1
-24.2
328
4QFY13
329
1QFY14
331
2QFY14
334
3QFY14
327
4QFY14
313
1QFY15
291
2QFY15
287
3QFY15
248
4QFY15
Source: Company, MOSL
Interestingly, margins across the board are not yet reflecting pressures of the same.
This can be explained for every company, however, in our view:
n
TCS, on the other hand, saw the benefits of massive currency depreciation flow
into its books, but that has corrected back to normal in FY15.
n
WPRO, like INFO, after the currency benefit, had the lever of utilization, which
has been nearly exploited to its potential.
28 April 2015
4

Technology | Update
n
HCLT has been an aggressor as far as hunting down deals is concerned. Hence,
we do not believe that the incremental downswing there will be the same,
especially with the margins reset to 21-22% guided band.
It is notable that the guidance on profitability hereon is stable across the board,
despite a fairly aggressive behavior prevalent in the market. Commentary at INFO
has been of expanding margins in the long run. Productivity improvement measures
have been ongoing across the industry for a long time now, and 4QFY15 saw the
articulation of scale around automation/productivity by every company.
Management commentary on automation and artificial intelligence for productivity
gains is incrementally becoming very prominent:
n
TCS:
We are now ready for the formal launch of our new Artificial Intelligence-
based IT and business operation automation platform. We call this entirely new
category of platforms Service-as-a-Software, and these will increasingly
automate many activities and whose self-learning capabilities will yield
productivity gains that will actually improve with time because of its
intelligence. It is a horizontal platform, and can be applied for IT Services as well
as BPS and IMS in automating many of the tasks and it has got neuroscience-
based engine which will continuously learn. We have done five pilots and all five
have been extremely well received and given very-very good results. We are
already talking to clients and we will be formally launching it.
n
INFO:
Infosys Automation Platform, which brings automation to our existing
services in IMS, has been deployed already in 9 projects and has a pipeline of 31
projects. We are able to show almost 40% productivity improvements in our
deployments with IAP. Infosys also now has a strong AI practice, which has seen
a spike in the number of AI projects over the last eight months. Especially, in
engineering and finance, where we have proven success in providing solutions
to complex and diverse problems, we will increase our revenue per employee to
USD80,000 by deploying automation and innovation in the existing businesses.
Towards H2, more and more effects of this automation as well as some of the
new kinds of projects will start to contribute to the revenue.
n
WPRO:
We have invested in the 350 member team for about two years in
Hyper-automation and AI engine. We have deployed the automation platform
across 45 accounts, leading to significant improvements in productivity. We
clearly see that commoditized service is under pressure, but we have been able
to kind of get some of that back primarily by reducing effort. So in effect, what
has happened is, realization by itself has not changed substantially (pricing
pressure has been offset from productivity gains from automation).
n
HCLT:
Cloud-enablement and Automation are dominant themes in most of the
contracts (IMS deals) that we are engaging in. Automation is a big theme where
we are continuing to invest, and we are seeing good results of those
investments.
The trend witnessed in comments above is encouraging and there is more to come
from here. This can sustain profitability in the medium to long term, given a lot of
scope for the same. It does cannibalize revenue, but the industry needs to do more
in newer services to offset that pressure and sustain growth momentum.
28 April 2015
5

Technology | Update
Thus, the Digital/Automation imperatives
As being reflected in performance at ahead-of-curve Accenture
In the series of misses during the quarter, Accenture’s second consecutive quarter
of beat-n-raise mode of operations thus far in 1HFY15 (year-end September) was
almost forgotten.
The beat:
In constant currency, Accenture’s revenue growth during the quarter was
12% YoY, compared to the company’s guided band of ~7-10% YoY, adjusted for the
impact of foreign currencies.
The raise:
For FY15, Accenture increased its guidance for revenue growth in
constant currency to 8-10%, from previously guided 5-8%. However, in reported
currency, the guidance stands at 0-2%, from 0-3% previously, as the company is now
baking in 8pp negative impact from cross currencies in FY15, compared to 5pp
negative impact earlier.
The suggestion:
Accenture’s commentary over the last few quarters and
accompanying performance suggest that with the right capabilities, Digital will be a
needle mover of the industry’s performance. Accenture’s CC growth in consulting
was in double digits too. 20% of Accenture’s business is currently from Digital
segments, which is ~USD6b. Assuming all acquisitions are being directed towards
the Digital initiative, the run-rate from the same is currently USD300-450m.
Capabilities from these have helped propel Accenture’s growth to double digits.
Indian peers have cited a lot of intent, but outcomes have remained elusive.
Exhibit 7: Consulting and Outsourcing both grew in double digits, adjusted for foreign currency impacts
Consulting (USD b)
Growth (YoY %)
5.7
-0.6
-3.0
4.0
3.8
1.7
-2.5
3.9
3.8
-0.6 -1.5
3.9
3.7
4.1
4.0
4.1
3.8
5.6
3.9
3.8
9.0
3.3
Outsourcing (USD b)
Growth (YoY %)
14.5
9.4
4.5
3.3
3.3
6.0
3.3
9.5
5.0
3.4
3.9
3.4
3.6
3.8
11.2
6.4
3.8
3.7
Source: Company, MOSL
28 April 2015
6

Technology | Update
Prefer change resilience
Buy INFO, TECHM, HCLT; prefer tier I IT over tier II
n
n
n
n
n
Budgets for CY15 have remained flattish at best, and Nasscom’s guidance of 12-
14% growth for the industry has assumed continued share gain in the services
pie for Indian IT. However, as standardized on-the-cloud as-a-service solutions
quickly gain share over customized on-premise solutions, there is risk of
volume/pricing pressure on the existing business.
As the new order establishes itself, industry growth may not see a pick-up in the
foreseeable future. But in the case of companies, expect to see performances
significantly divergent, as some crack the code to growth over others.
Companies are choosing their battles in Digital/Automation and not all will
flourish in the due course.
In such a scenario, our preference is for companies that are most resilient to
these pressures either due to quicker adoption of offerings (INFO – combination
of build and buy), or growth drivers in areas that may be insulated due to lower
penetration yet big enough to move the needle on Financial Performance (HCLT
– Engineering Services and TECHM – Network Services).
Impact from cross currencies will weigh on growth in revenue and earnings for
FY16 at least. INFO guided for 380bp impact from the same to USD revenue
growth. It is notable that at ~70% of revenue bookings in USD, it is more
protected than peers from cross currency headwinds. Thus, WPRO, TECHM and
TCS may suffer anywhere between 450-500bp hit on USD revenue in FY16E. Lest
the INR depreciates, earnings growth across the board is unlikely to exceed high
single digits, with outperformers managing low double digits, at best.
In terms of valuation, while TCS and HCLT enjoy a premium to their 10-year
average PE, INFO and WPRO are trading at a discount to their historical
averages. The discount is steeper at WPRO, implying strong upside on growth
recovery. The premium at HCLT matches the discount at WPRO, justified given
the company’s sustained growth leadership, with solid margin expansion over
the last few years.
Exhibit 8: TCS one-year forward PE
30
24
18
12
6
7.0
PE (x)
Median(x)
Peak(x)
Min(x)
18.8
18.2
Avg(x)
25.8
19.6
Exhibit 9: INFO one-year forward PE
32
24
16
8
PE (x)
Median(x)
Peak(x)
Min(x)
Avg(x)
29.6
18.8
18.3
10.5
17.5
Source: MOSL, Company
28 April 2015
7

Technology | Update
Exhibit 10: WPRO one-year forward PE
32
25
18
11
4
PE (x)
Median(x)
Peak(x)
Min(x)
25.1
16.2
16.2
6.0
14.1
Avg(x)
24
19
14
9
4
5.8
Exhibit 11: HCLT one-year forward PE
PE (x)
Median(x)
Peak(x)
Min(x)
15.2
14.3
16.3
Avg(x)
22.6
Source: MOSL, Company
Comparative valuations
Company
Mkt cap Rating
(USD b)
TCS
Infosys
Wipro
HCL Tech
TechM
Cognizant
Tier-I Agg
77.5
35.5
20.8
19.5
9.0
36.4
198.7
Neutral
Buy
Neutral
Buy
Buy
Not Rated
TP
(INR)
2,650
2,400
600
1,025
800
Upside
(%)
6.2
22.4
12.9
17.8
31.4
EPS (INR)
P/E (x)
RoE (%)
FY15-17E
CAGR (%)
USD
rev.
EPS
13.4
10.3
8.0
12.7
19.5
16.8
15.9
10.6
8.8
12.6
21.9
16.5
FY15E FY16E FY17E FY15E FY16E FY17E FY15E FY16E FY17E
110.8 125.4
107.9 112.2
35.1
50.4
32.1
2.3
36.6
55.8
38.7
2.7
148.9
131.9
41.6
63.9
47.8
3.2
22.5
18.2
15.1
17.3
19.0
25.3
19.6
19.9
17.5
14.5
15.6
15.7
22.2
17.6
16.8
14.9
12.8
13.6
12.7
18.7
14.9
38.5
26.0
23.0
32.2
26.7
20.7
27.9
38.0
23.5
20.7
29.4
25.5
19.2
26.0
36.3
24.3
20.7
27.7
25.8
18.9
25.6
28 April 2015
8

Technology | Update
NOTES
28 April 2015
9

This document has been prepared by Motilal Oswal Securities Limited (hereinafter referred to as Most) to provide information about the company(ies) and/sector(s), if any, covered in the report and may be
Technology | Update
distributed by it and/or its affiliated company(ies). This report is for personal information of the selected recipient/s and does not construe to be any investment, legal or taxation advice to you. This research report does
not constitute an offer, invitation or inducement to invest in securities or other investments and Motilal Oswal Securities Limited (hereinafter referred as MOSt) is not soliciting any action based upon it. This report is not
for public distribution and has been furnished to you solely for your general information and should not be reproduced or redistributed to any other person in any form. This report does not constitute a personal
recommendation or take into account the particular investment objectives, financial situations, or needs of individual clients. Before acting on any advice or recommendation in this material, investors should consider
whether it is suitable for their particular circumstances and, if necessary, seek professional advice. The price and value of the investments referred to in this material and the income from them may go down as well as
up, and investors may realize losses on any investments. Past performance is not a guide for future performance, future returns are not guaranteed and a loss of original capital may occur.
MOSt and its affiliates are a full-service, integrated investment banking, investment management, brokerage and financing group. We and our affiliates have investment banking and other business relationships with a
some companies covered by our Research Department. Our research professionals may provide input into our investment banking and other business selection processes. Investors should assume that MOSt and/or
its affiliates are seeking or will seek investment banking or other business from the company or companies that are the subject of this material and that the research professionals who were involved in preparing this
material may educate investors on investments in such business. The research professionals responsible for the preparation of this document may interact with trading desk personnel, sales personnel and other
parties for the purpose of gathering, applying and interpreting information. Our research professionals are paid on the profitability of MOSt which may include earnings from investment banking and other business.
MOSt generally prohibits its analysts, persons reporting to analysts, and members of their households from maintaining a financial interest in the securities or derivatives of any companies that the analysts cover.
Additionally, MOSt generally prohibits its analysts and persons reporting to analysts from serving as an officer, director, or advisory board member of any companies that the analysts cover. Our salespeople, traders,
and other professionals or affiliates may provide oral or written market commentary or trading strategies to our clients that reflect opinions that are contrary to the opinions expressed herein, and our proprietary
trading and investing businesses may make investment decisions that are inconsistent with the recommendations expressed herein. In reviewing these materials, you should be aware that any or all of the foregoing
among other things, may give rise to real or potential conflicts of interest. MOSt and its affiliated company(ies), their directors and employees and their relatives may; (a) from time to time, have a long or short position
in, act as principal in, and buy or sell the securities or derivatives thereof of companies mentioned herein. (b) be engaged in any other transaction involving such securities and earn brokerage or other compensation
or act as a market maker in the financial instruments of the company(ies) discussed herein or act as an advisor or lender/borrower to such company(ies) or may have any other potential conflict of interests with
respect to any recommendation and other related information and opinions.; however the same shall have no bearing whatsoever on the specific recommendations made by the analyst(s), as the recommendations
made by the analyst(s) are completely independent of the views of the affiliates of MOSt even though there might exist an inherent conflict of interest in some of the stocks mentioned in the research report
Reports based on technical and derivative analysis center on studying charts company's price movement, outstanding positions and trading volume, as opposed to focusing on a company's fundamentals and, as
such, may not match with a report on a company's fundamental analysis. In addition MOST has different business segments / Divisions with independent research separated by Chinese walls catering to different set
of customers having various objectives, risk profiles, investment horizon, etc, and therefore may at times have different contrary views on stocks sectors and markets.
Unauthorized disclosure, use, dissemination or copying (either whole or partial) of this information, is prohibited. The person accessing this information specifically agrees to exempt MOSt or any of its affiliates or
employees from, any and all responsibility/liability arising from such misuse and agrees not to hold MOSt or any of its affiliates or employees responsible for any such misuse and further agrees to hold MOSt or any of
its affiliates or employees free and harmless from all losses, costs, damages, expenses that may be suffered by the person accessing this information due to any errors and delays. The information contained herein is
based on publicly available data or other sources believed to be reliable. Any statements contained in this report attributed to a third party represent MOSt’s interpretation of the data, information and/or opinions
provided by that third party either publicly or through a subscription service, and such use and interpretation have not been reviewed by the third party. This Report is not intended to be a complete statement or
summary of the securities, markets or developments referred to in the document. While we would endeavor to update the information herein on reasonable basis, MOSt and/or its affiliates are under no obligation to
update the information. Also there may be regulatory, compliance, or other reasons that may prevent MOSt and/or its affiliates from doing so. MOSt or any of its affiliates or employees shall not be in any way
responsible and liable for any loss or damage that may arise to any person from any inadvertent error in the information contained in this report. MOSt or any of its affiliates or employees do not provide, at any time,
any express or implied warranty of any kind, regarding any matter pertaining to this report, including without limitation the implied warranties of merchantability, fitness for a particular purpose, and non-infringement.
The recipients of this report should rely on their own investigations.
This report is intended for distribution to institutional investors. Recipients who are not institutional investors should seek advice of their independent financial advisor prior to taking any investment decision based on
this report or for any necessary explanation of its contents.
Most and it’s associates may have managed or co-managed public offering of securities, may have received compensation for investment banking or merchant banking or brokerage services, may have received any
compensation for products or services other than investment banking or merchant banking or brokerage services from the subject company in the past 12 months.
Most and it’s associates have not received any compensation or other benefits from the subject company or third party in connection with the research report.
Subject Company may have been a client of Most or its associates during twelve months preceding the date of distribution of the research report
MOSt and/or its affiliates and/or employees may have interests/positions, financial or otherwise of over 1 % at the end of the month immediately preceding the date of publication of the research in the securities
mentioned in this report. To enhance transparency, MOSt has incorporated a Disclosure of Interest Statement in this document. This should, however, not be treated as endorsement of the views expressed in the
report.
Motilal Oswal Securities Limited is under the process of seeking registration under SEBI (Research Analyst) Regulations, 2014.
There are no material disciplinary action that been taken by any regulatory authority impacting equity research analysis activities
Analyst Certification
The views expressed in this research report accurately reflect the personal views of the analyst(s) about the subject securities or issues, and no part of the compensation of the research analyst(s) was, is, or will be
directly or indirectly related to the specific recommendations and views expressed by research analyst(s) in this report. The research analysts, strategists, or research associates principally responsible for preparation
of MOSt research receive compensation based upon various factors, including quality of research, investor client feedback, stock picking, competitive factors and firm revenues
Disclosure of Interest Statement
§
Analyst ownership of the stock
§
Served as an officer, director or employee
Companies where there is interest
No
No
Disclosures
Regional Disclosures (outside India)
For U.S.
This report is not directed or intended for distribution to or use by any person or entity resident in a state, country or any jurisdiction, where such distribution, publication, availability or use would be contrary to law,
regulation or which would subject MOSt & its group companies to registration or licensing requirements within such jurisdictions.
Motilal Oswal Securities Limited (MOSL) is not a registered broker - dealer under the U.S. Securities Exchange Act of 1934, as amended (the"1934 act") and under applicable state laws in the United States. In
addition MOSL is not a registered investment adviser under the U.S. Investment Advisers Act of 1940, as amended (the "Advisers Act" and together with the 1934 Act, the "Acts), and under applicable state laws in the
United States. Accordingly, in the absence of specific exemption under the Acts, any brokerage and investment services provided by MOSL, including the products and services described herein are not available to or
intended for U.S. persons.
This report is intended for distribution only to "Major Institutional Investors" as defined by Rule 15a-6(b)(4) of the Exchange Act and interpretations thereof by SEC (henceforth referred to as "major institutional
investors"). This document must not be acted on or relied on by persons who are not major institutional investors. Any investment or investment activity to which this document relates is only available to major
institutional investors and will be engaged in only with major institutional investors. In reliance on the exemption from registration provided by Rule 15a-6 of the U.S. Securities Exchange Act of 1934, as amended (the
"Exchange Act") and interpretations thereof by the U.S. Securities and Exchange Commission ("SEC") in order to conduct business with Institutional Investors based in the U.S., MOSL has entered into a chaperoning
agreement with a U.S. registered broker-dealer, Motilal Oswal Securities International Private Limited. ("MOSIPL"). Any business interaction pursuant to this report will have to be executed within the provisions of this
chaperoning agreement.
The Research Analysts contributing to the report may not be registered /qualified as research analyst with FINRA. Such research analyst may not be associated persons of the U.S. registered broker-dealer, MOSIPL,
and therefore, may not be subject to NASD rule 2711 and NYSE Rule 472 restrictions on communication with a subject company, public appearances and trading securities held by a research analyst account.
Motilal Oswal Capital Markets Singapore Pte Limited is acting as an exempt financial advisor under section 23(1)(f) of the Financial Advisers Act(FAA) read with regulation 17(1)(d) of the Financial Advisors
Regulations and is a subsidiary of Motilal Oswal Securities Limited in India. This research is distributed in Singapore by Motilal Oswal Capital Markets Singapore Pte Limited and it is only directed in Singapore to
accredited investors, as defined in the Financial Advisers Regulations and the Securities and Futures Act (Chapter 289), as amended from time to time.
In respect of any matter arising from or in connection with the research you could contact the following representatives of Motilal Oswal Capital Markets Singapore Pte Limited:
Anosh Koppikar
Kadambari Balachandran
Email : anosh.Koppikar@motilaloswal.com
Email : kadambari.balachandran@motilaloswal.com
Contact : (+65)68189232
Contact : (+65) 68189233 / 65249115
Office Address : 21 (Suite 31),16 Collyer Quay,Singapore 04931
For Singapore
Motilal Oswal Securities Ltd
28 April 2015
Motilal Oswal Tower, Level 9, Sayani Road, Prabhadevi, Mumbai 400 025
Phone: +91 22 3982 5500 E-mail: reports@motilaloswal.com
10