28 April 2015
4QFY15 Results Update | Sector:
Financials
Andhra Bank
BSE SENSEX
27,396
Bloomberg
Equity Shares (m)
M.Cap. (INR b) / (USD b)
52-Week Range (INR)
1, 6, 12 Rel. Per (%)
Avg Val/Vol ‘000
Free float (%)
S&P CNX
8,286
ANDB IN
602.8
46.2/0.7
110 / 61
-2/-1/-7
410/4755
39.0
CMP: INR77
TP: INR120 (+56%)
Buy
Strong core performance; Positive asset quality guidance by management
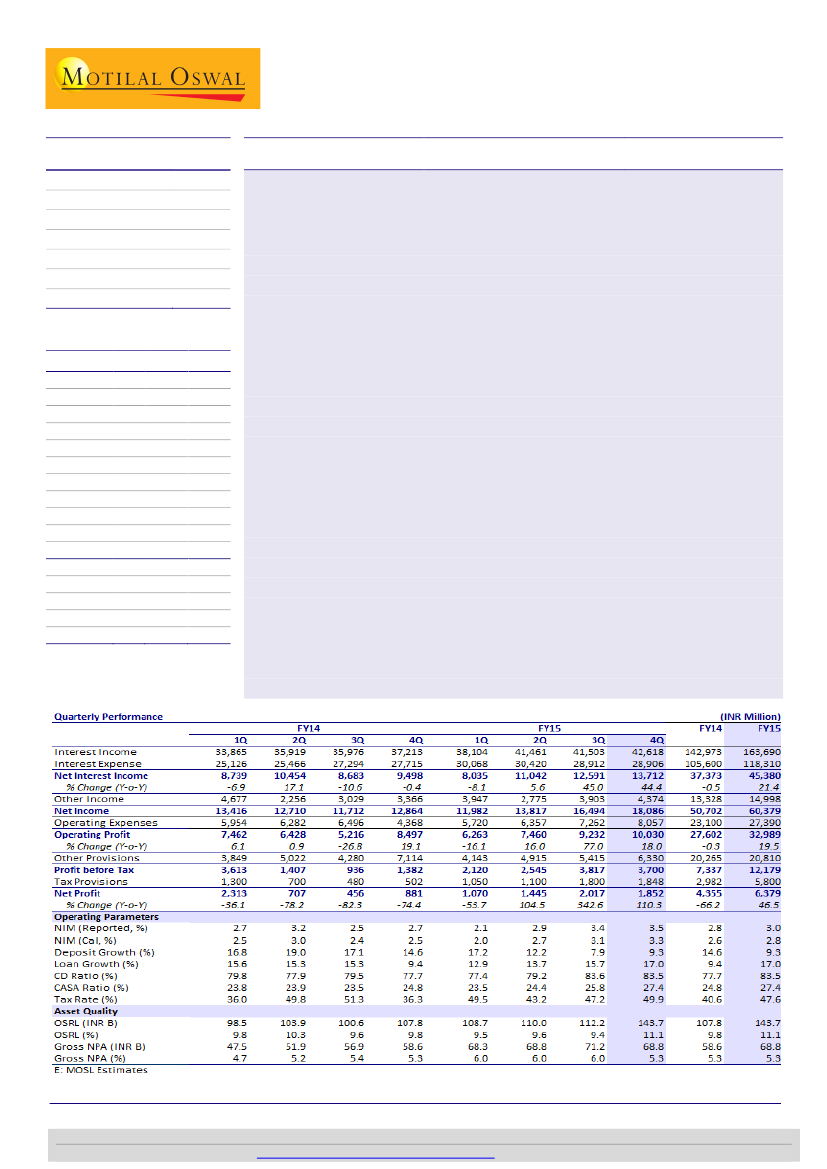
Andhra Bank’s (ANDB) 4QFY15 PAT was at INR1.9b (2x YoY on a lower base),
driven by healthy NIM (3.5%, 12 quarter high), strong loan growth (+17% YoY) and
lower credit costs (1.6% vs. 2.5% in 4QFY14).
Slippages during the quarter declined to a 4 quarter low of INR7.7b vs. INR9b in
3QFY15. Agriculture GNPA declined 20% QoQ to INR10.6b led by strong recoveries
(INR3b+ in 4Q) in AP/Telangana. Management is confident of recovering another
INR5-6b over the next couple of quarters (Agri NPA target of 3% by 2QFY16 vs.
5.2% currently and 7.2% in 1QFY15).
Bank continued to report healthy NIM (3.5%, +5bp QoQ) led by interest write-back
on Agriculture NPA recoveries (INR300m) from AP/Telangana. Management
guided that the margins would remain at similar levels over the next few quarters.
Other highlights:
(1) fees grew 21% QoQ (only 2% YoY on higher base) led by
strong traction in processing fees (INR1,132m) led by pickup in growth in 4QFY15,
(2) PCR, including technical write-offs, improved 580bp QoQ to 59%, (3) Bank
restructured INR31.3b in 4Q vs INR22.9b in 9M and (4) CASA ratio improved 151bp
QoQ to 27.4% (growth of 21% YoY and 15% QoQ). (5) CET 1 at 7.5%. Bank to raise
Tier I bonds in 1Q; equity raising unlikely in near term
Valuation and view:
Declining trend in slippages and zero restructuring pipeline
were the key positives. Over FY13-14, ANDB's earnings were severely hit due to
rising NPAs and further impacted in 1QFY15 due to a spike in Agriculture NPAs.
With clarity emerging on the farm loan waiver scheme and management’s focus
on recoveries, we believe earnings would improve gradually going forward
(INR5b+ of interest write-back and upgrade/recoveries of INR5-6b Agri related
NPAs). We expect RoA/RoE to improve to 0.7%/14% by FY17E led by normalized
tax rate and healthy margins. Maintain
Buy
with a TP of INR120 (0.6x FY17E BV).
Financials & Valuation (INR Billion)
2016E
NII
55
OP
40
NP
12
NIM (%)
3.0
EPS (INR)
20.6
EPS Gr. (%) 94.8
BV/Sh. (INR) 170
ABV/Sh.(INR) 145
ROE (%)
12.2
ROA (%)
0.6
D. Payout(%) 29.0
Valuations
P/E(X)
3.7
P/BV (X)
0.45
P/ABV (X)
0.5
Div. Yield (%) 6.7
Y/E MAR
2017E 2018E
62
74
43
52
15
19
2.9
2.9
25.5
31.4
23.6
23.0
188
210
172
193
14.2
15.7
0.7
0.7
29.0
29.0
3.0
0.41
0.4
8.3
2.4
0.36
0.4
10.2
Alpesh Mehta
(Alpesh.Mehta@MotilalOswal.com); +91 22 3982 5415
Vallabh Kulkarni
(Vallabh.Kulkarni@MotilalOswal.com); +91 22 3982 5430
Investors are advised to refer through disclosures made at the end of the Research Report.
Motilal Oswal research is available on
www.motilaloswal.com/Institutional-Equities,
Bloomberg, Thomson Reuters, Factset and S&P Capital.

Andhra Bank
Strong Agri NPA recoveries aid GNPA; Positive outlook by management
Slippages declined to a four
quarter low of INR7.7b
GNPA declined 68bp QoQ at 5.3% led by lower slippages and strong recoveries
in AP/Telangana farm NPA portfolio. Reported PCR increased 580bp QoQ to 59%
in 4QFY15 resulting in NNPA declining 77bp to 2.9% vs 3.7% in the previous
quarter.
Slippages during the quarter declined to a 4 quarter low of INR7.7b vs. INR9b in
3QFY15. As per the management, slippage run rate would remain near these
levels over the next couple of quarters and subside further as the economic
growth picks up.
Agriculture GNPA declined 20% QoQ to INR10.6b led by strong recoveries
(INR3b+ in 4Q) in AP/Telangana. Management is confident of recovering
another INR5-6b over the next couple of quarter (Agri NPA target of 3% by
2QFY16 vs. 5.2% currently and 7.2% in 1QFY15).
Fresh restructuring increased sharply during the quarter (INR31.3b vs INR22.9b
in 9M – one major account from Power sector). OSRL stood at INR 144b (11.1%
of loans). Management stated that, unlike a few other banks who have reported
results thus far, the restructured pipeline is Nil.
Loan growth (+17% YoY)
was mainly driven by SME
(+21% YoY and +14% QoQ)
and retail segment (+20%
YoY and +7% QoQ)
Other highlights
Loans grew 17% YoY (+6% QoQ), while deposits grew at 9% YoY and QoQ each.
CD ratio declined to 81.3% in 4QFY15 vs. 83.6% in 3QFY15.
Loan growth was mainly driven by SME (+21% YoY and +14% QoQ) and Retail
segment (+20% YoY and +7% QoQ).
Within, retail segment growth was mainly driven by Housing loans (+36% YoY
and 14% QoQ) which is 50% of total retail book. Non Agriculture gold loan book
declined 11% QoQ (formed 16% of the bank’s total retail book).
CASA deposits growth was at a twenty quarter high at 21% YoY to INR424b
(CASA ratio of 27.4% - improvement of 151bp QoQ and 255bp YoY). SA/CA
deposits increased by 13%/23% QoQ and 18%/30% YoY.
Buy with a target price of
INR120 (0.6x FY17E BV)
Valuation and view
Declining trend in slippages and zero restructuring pipeline were the key
positives.
Over FY13-14, ANDB's earnings were severely hit due to rising NPAs and further
impacted in 1QFY15 due to a spike in Agriculture NPAs.
With clarity emerging on the farm loan waiver scheme and management’s focus
on recoveries, we believe earnings would improve gradually going forward
(INR5b+ of interest write-back and upgrade/recoveries of INR5-6b Agri related
NPAs).
We expect RoA/RoE to improve to 0.7%/14% by FY17E led by normalized tax
rate and healthy margins. Maintain
Buy
with a TP of INR120 (0.6x FY17E BV).
28 April 2015
2

Andhra Bank
Exhibit 1: We upgrade our FY16/17 estimates to factor in higher NIM
INR B
Net Interest Income
Other Income
Total Income
Operating Expenses
Operating Profits
Provisions
PBT
Tax
PAT
Margins (%)
Credit Cost (%)
RoA (%)
RoE (%)
Old Estimates
FY16E
FY17E
50.5
59.3
16.3
18.0
66.8
77.3
31.1
36.1
35.7
41.2
20.2
22.2
15.5
19.0
5.0
5.7
10.5
13.3
2.84
2.88
1.30
1.20
0.4
0.6
7.3
11.0
New Estimates
% Change
FY16E
FY17E
FY18E
FY16E
FY17E
55.3
62.4
73.9
9.5
5.2
16.7
18.4
20.4
2.3
2.4
72.0
80.8
94.3
7.7
4.6
32.3
37.4
42.7
3.6
3.5
39.7
43.4
51.6
11.3
5.5
21.0
20.3
23.2
4.0
-8.5
18.7
23.1
28.4
20.7
21.8
6.3
7.7
9.5
26.4
36.1
12.4
15.4
18.9
18.1
15.7
2.97
2.88
2.91
1.35
1.15
1.00
0.4
0.6
0.7
6.8
12.2
14.2
Source: MOSL, Company
Exhibit 2: One year forward P/BV
Exhibit 3: One year forward P/E
Source: MOSL, Company
28 April 2015
3

Andhra Bank
Exhibit 4: DuPont Analysis: Gradual improvement in profitability led by decline in credit costs and tax rate (%)
Y/E MARCH
Net Interest Income
Fee income
Fee to core Income
Core Income
Operating Expenses
Cost to Core Income
Employee cost
Emp. to total exp (%)
Others
Core Operating Profit
Trading and others
Operating Profit
Provisions
NPA
Others
PBT
Tax
Tax Rate
RoA
Leverage (x)
RoE
FY08
2.57
0.84
24.57
3.41
1.75
51.19
0.98
56.03
0.77
1.66
0.37
2.03
0.27
0.23
0.04
1.76
0.66
37.27
1.11
16.26
17.97
FY09
2.60
0.75
22.42
3.35
1.77
52.65
1.00
56.51
0.77
1.59
0.47
2.06
0.62
0.29
0.33
1.44
0.39
27.28
1.04
18.13
18.94
FY10
2.76
0.75
21.40
3.52
1.70
48.33
1.04
61.06
0.66
1.82
0.46
2.28
0.47
0.45
0.02
1.81
0.49
27.16
1.32
19.71
25.96
FY11
3.23
0.71
17.95
3.94
1.71
43.43
1.11
64.77
0.60
2.23
0.19
2.42
0.65
0.56
0.08
1.77
0.50
28.30
1.27
18.28
23.24
FY12
3.21
0.60
15.71
3.81
1.54
40.45
0.98
63.73
0.56
2.27
0.14
2.41
0.85
0.50
0.35
1.56
0.41
26.29
1.15
16.74
19.25
FY13
2.77
0.56
16.70
3.33
1.50
45.17
0.95
63.17
0.55
1.82
0.22
2.04
0.73
0.58
0.15
1.31
0.36
27.21
0.95
17.04
16.19
FY14
2.38
0.54
18.36
2.92
1.47
50.46
0.88
59.86
0.59
1.45
0.31
1.76
1.29
1.07
0.22
0.47
0.19
40.64
0.28
18.26
5.07
FY15
2.57
0.60
18.89
3.17
1.55
48.96
0.96
61.98
0.59
1.62
0.25
1.87
1.18
1.15
0.03
0.69
0.33
47.59
0.36
18.75
6.79
FY16E
2.78
0.60
17.66
3.37
1.62
48.07
1.02
62.89
0.60
1.75
0.24
2.00
1.06
1.01
0.04
0.94
0.31
33.50
0.62
19.60
12.24
FY17E
FY18E
2.70
2.73
0.58
0.56
17.73
17.13
3.28
3.30
1.62
1.58
49.31
47.86
1.02
0.99
63.18
62.91
0.60
0.59
1.66
1.72
0.21
0.19
1.88
1.91
0.88
0.86
0.84
0.75
0.04
0.11
1.00
1.05
0.33
0.35
33.50
33.50
0.66
0.70
21.42
22.54
14.24
15.74
Source: MOSL, Company
28 April 2015
4

Andhra Bank
Story in charts
Exhibit 5: Loan growth driven by MSME and Retail segments
32
22 20
Loans (INR b)
YoY Gr. (%)
17
13 14 16
22 20
20
15
18
Exhibit 6: Bank utilized other funding avenues in 4Q
Deposits (INR b)
YoY Growth (%)
9
18 16 15 15
17 14 16 14
9
19 17
15 14 17 17
15 17 12
8
Source: MOSL, Company
Exhibit 7: Margin improvement (%) led by interest write-back Exhibit 8: GNPA ratio declined led by higher recoveries
3.8 3.8 3.8
GNPA (%)
3.3 3.3 3.1 3.4
3.0
2.7
3.2
2.5 2.7
2.9
2.1
3.4 3.5
82
62
65 71
NNPA (%)
PCR (reported %)
60
53 48 50 53
53 52 50
45 45 46
59
Source: MOSL, Company
Exhibit 9: Gross slippages at 4 quarter low (INRb)
21.6
Exhibit 10: Credit cost remained stable QoQ (%)
2.5
1.6 1.6
8.3 9.2
4.0
11.8
6.5
8.9
7.2 6.9
5.1
9.8 9.0
7.7
0.6
1.2
0.2
0.5
0.7
0.8
0.6 0.7
1.1
1.3
0.8
1.3 1.4
Source: MOSL, Company
28 April 2015
5

Andhra Bank
Exhibit 11: Quarterly Snapshot
FY14
INR m
Profit and Loss
Net Interest Income
Other Income
Trading profits
Recoveries
Forex
Others (Ex non core)
Total Income
Operating Expenses
Employee
Others
Operating Profits
Provisions
PBT
Taxes
PAT
Asset Quality
GNPA
NNPA
GNPA (%)
NNPA (%)
PCR (Reported, %)
Slippages
Slippage Ratio
Ratios (%)
Fees to Total Income
Cost to Core Income
Tax Rate
CASA (Reported)
Loan/Deposit
Margins (%)
Yield on loans
Yield On Investments
Cost of deposits
Margins
Balance Sheet (INR B)
Loans
Deposits
CASA Deposits
Break up of Loans
Agriculture Adv
SME Credit
Retail Loans
Other loans
1Q
2Q
3Q
4Q
1Q
2Q
FY15
3Q
4Q
Variation (%)
QoQ
YoY
9
12
7
127
-63
21
10
11
13
8
9
17
-3
3
-8
-3
-13
-68
-77
580
-29
-66
44
30
190
33
-38
9
41
84
187
11
18
-11
168
268
110
17
10
2
-18
638
70
77
Cumulative Numbers
FY14 FY15 YoY Gr (%)
37,373
13,328
4,008
1,081
887
7,353
50,702
23,100
13,829
9,271
27,602
20,265
7,337
2,982
4,356
45,380
14,998
3,665
765
1,832
8,736
60,379
27,394
16,980
10,415
32,984
20,802
12,182
5,798
6,384
21
13
-9
-29
106
19
19
19
23
12
19
3
66
94
47
17
10
2
-18
638
8,739 10,454 8,683 9,498
4,677 2,256 3,029 3,366
2,861
207
520
420
122
434
308
218
283
115
258
231
1,412 1,501 1,944 2,497
13,416 12,710 11,712 12,864
5,954 6,282 6,496 4,368
3,852 4,011 4,149 1,817
2,103 2,271 2,347 2,550
7,462 6,428 5,216 8,497
3,849 5,022 4,280 7,114
3,613 1,407
936
1,382
1,300
700
480
502
2,313
707
456
881
47,484 51,872 56,925 58,576
32,117 34,774 36,534 33,425
4.7
5.2
5.4
5.3
3.3
3.5
3.6
3.1
45.0
44.6
45.8
52.6
11,817 7,232 6,933 5,053
5.5
3.3
3.1
2.0
8,035 11,042 12,591 13,712
3,947
2,775 3,903 4,374
954
355
1,139 1,217
255
91
128
291
795
500
393
144
1,942
1,828 2,243 2,723
11,982 13,817 16,494 18,086
5,720
6,357 7,262 8,057
3,395
3,732 4,628 5,224
2,325
2,625 2,634 2,832
6,263
7,460 9,232 10,030
4,143
4,915 5,415 6,330
2,120
2,545 3,817 3,700
1,050
1,100 1,800 1,848
1,070
1,445 2,017 1,852
68,272 68,843 71,181 68,765
43,215 43,158 42,642 36,886
6.0
6.0
6.0
5.3
3.9
3.9
3.7
2.9
48.2
50.3
53.1
58.9
21,601 9,801 9,046 7,689
8.6
3.9
3.5
2.8
61,671 68,765
38,772 36,886
5.3
5.3
3.1
2.9
52.6
58.9
10.5
58.7
36.0
23.8
79.8
11.2
7.6
7.8
2.7
1,004
1,258
300
171
170
144
520
11.8
52.5
49.8
23.9
77.9
11.4
7.9
7.7
3.2
1,007
1,293
309
181
166
146
515
16.6
61.1
51.3
23.5
79.5
11.2
8.0
7.8
2.5
1,047
1,317
310
187
167
151
543
19.4
36.4
36.3
24.8
77.7
11.0
8.3
7.9
2.7
1,102
1,418
352
203
183
165
551
16.2
57.3
49.5
23.5
77.4
10.7
8.1
7.9
2.1
1,142
1,475
347
212
186
171
572
13.2
49.4
43.2
24.4
79.2
11.5
8.1
7.8
2.9
1,149
1,451
354
208
186
173
582
13.6
49.0
47.2
25.8
83.6
11.7
8.2
7.7
3.4
1,188
1,421
367
198
195
186
610
15.1
49.0
49.9
27.4
83.5
11.7
8.2
7.6
3.5
1,295
1,550
424
204
222
198
670
0
3
-5
5
9
9
15
3
14
7
10
67
-10
-33
83
18
9
21
1
21
20
22
14.5
51.6
40.6
25
77.7
11.2
8.1
7.8
2.8
1,102
1,418
352
14.5
50.6
47.6
27
83.5
11.4
8.2
7.7
3.0
1,295
1,550
424
16
14
-8
24
18
9
21
203
204
1
183
222
21
165
198
20
551
670
22
Source: MOSL, Company
28 April 2015
6

Andhra Bank
Exhibit 12: Valuation metrics
62.34
Rating
ICICIBC*
Buy
HDFCB
Buy
AXSB
Buy
KMB*
Neutral
YES
Buy
IIB
Buy
DCBB
Buy
FB
Buy
JKBK
Neutral
SIB
Buy
Private Aggregate
SBIN (cons)* Buy
PNB
Buy
BOI
Neutral
BOB
Neutral
UNBK
Buy
INBK
Buy
CRPBK
Neutral
ANDB
Buy
IDBI
Neutral
DBNK
Neutral
Public Aggregate
HDFC*
Buy
LICHF
Buy
IHFL
Buy
IDFC
Buy
RECL
Buy
POWF
Buy
SHTF
Buy
MMFS
Buy
BAF
Buy
NBFC Aggregate
CMP
(INR)
327
1,004
535
1,339
826
827
118
127
99
24
272
161
215
174
143
147
58
77
75
49
1,228
437
573
167
317
271
990
274
3,989
Mcap
(USDb)
30.4
40.4
20.2
16.5
5.5
7.0
0.5
1.7
0.8
0.5
123.6
32.6
4.7
2.2
1.2
1.5
1.1
0.2
0.7
1.9
0.4
46.5
30.7
3.5
3.4
4.3
5.0
5.7
3.6
2.5
3.2
62.0
EPS (INR)
FY16
22.9
51.2
37.5
49.2
60.9
43.2
7.3
13.0
13.6
3.7
29.0
26.8
50.3
24.1
36.6
28.7
16.5
17.9
14.4
9.7
38
33
63
13
66
55
78
17
219
FY17
27.4
64.0
44.0
60.4
76.4
54.6
9.5
15.6
18.1
4.7
36.2
36.2
64.3
30.8
47.1
33.5
21.9
22.5
19.7
13.6
46
39
77
14
75
63
92
20
267
P/E (x)
FY16
11.4
19.6
14.3
27.2
13.6
19.1
16.3
9.8
7.2
6.5
17.2
9.0
6.0
4.3
7.2
3.9
5.1
3.5
4.3
5.2
5.0
7.5
20.4
13.3
9.1
13.3
4.8
4.9
12.7
15.9
18.2
14.4
FY17
9.2
15.7
12.2
22.2
10.8
15.2
12.4
8.2
5.4
5.1
14.2
7.2
4.5
3.4
5.7
3.0
4.4
2.6
3.4
3.8
3.6
5.9
15.4
11.2
7.5
11.6
4.2
4.3
10.8
13.4
15.0
12.4
BV (INR)
FY16
131
287
219
371
332
227
63
100
137
29
231
231
455
184
320
287
141
169
157
130
165
198
213
109
300
288
494
113
1,137
FY17
151
336
255
427
393
274
72
112
151
33
260
263
511
208
359
313
158
185
173
141
192
229
245
120
358
334
573
128
1,360
P/BV (x)
FY16
1.99
3.50
2.45
3.61
2.48
3.64
1.88
1.27
0.72
0.82
2.78
1.13
0.70
0.47
0.94
0.45
0.51
0.41
0.45
0.47
0.38
0.82
4.74
2.21
2.69
1.27
1.06
0.94
2.00
2.43
3.51
2.66
FY17
1.67
2.99
2.10
3.13
2.10
3.02
1.64
1.14
0.65
0.73
2.41
1.00
0.61
0.42
0.84
0.40
0.47
0.36
0.42
0.43
0.35
0.74
3.67
1.91
2.34
1.14
0.89
0.81
1.73
2.15
2.93
2.32
RoA (%)
FY16
1.72
1.97
1.79
1.86
1.68
1.90
1.12
1.20
0.81
0.78
0.77
0.77
0.46
0.70
0.57
0.63
0.54
0.55
0.58
0.36
2.53
1.43
3.90
2.20
3.50
3.18
2.27
2.62
2.94
FY17
1.78
2.02
1.75
1.86
1.70
1.97
1.17
1.19
0.95
0.86
0.84
0.91
0.49
0.78
0.64
0.63
0.64
0.60
0.69
0.44
2.53
1.42
3.87
2.19
3.36
3.11
2.44
2.72
2.88
RoE (%)
FY16
16.3
19.2
18.4
14.3
19.9
20.7
12.3
13.7
10.4
13.3
12.8
12.2
11.6
13.7
12.0
10.4
12.3
11.0
9.5
7.7
23.8
17.8
31.9
11.5
24.2
20.6
16.3
16.1
21.0
FY17
17.2
20.6
18.5
15.0
21.1
21.8
14.1
14.7
12.6
15.2
14.5
14.6
13.3
15.7
13.9
11.2
14.7
12.7
11.9
10.0
24.9
18.3
33.5
12.0
22.8
20.1
17.7
17.0
21.4
*Multiples adj. for value of key ventures/Investments; For ICICI Bank and HDFC Ltd BV is adjusted for investments in subsidiaries
# Div Yield based on FY14 declared dividend; UR: Under Review
Source: Company, MOSL
28 April 2015
7

Andhra Bank
Financials and valuations
Income Statement
Y/E March
Interest Income
Interest Expense
Net Interest Income
Change (%)
Non Interest Income
Net Income
Change (%)
Operating Expenses
Pre Provision Profits
Change (%)
Provisions (excl tax)
PBT
Tax
Tax Rate (%)
PAT
Change (%)
Pref. Dividend (Incl tax)
Profits for Equity SH
Change (%)
Equity Dividend (Incl tax)
Core PPP*
Change (%)
*Core PPP is (NII+Fee income-Opex)
Balance Sheet
Y/E March
Share Capital
Reserves & Surplus
Net Worth
Deposits
Change (%)
Borrowings
Other Liabilities & Prov.
Total Liabilities
Current Assets
Investments
Change (%)
Loans
Change (%)
Fixed Assets
Other Assets
Total Assets
Asset Quality
GNPA (INR M)
NNPA (INR M)
GNPA Ratio
NNPA Ratio
PCR (Excl Tech. write off)
E: MOSL Estimates
28 April 2015
2011
82,913
50,703
32,210
46.8
8,970
41,179
30.3
17,049
24,131
33.3
6,460
17,671
5,000
28.3
12,671
21.2
0.0
12,671
21.2
3,577
22,210
54.0
2012
113,387
75,794
37,593
16.7
8,599
46,193
12.2
18,042
28,150
16.7
9,907
18,243
4,796
26.3
13,447
6.1
0.0
13,447
6.1
3,577
26,559
19.6
2013
129,097
91,527
37,570
-0.1
10,474
48,044
4.0
20,372
27,672
-1.7
9,962
17,711
4,819
27.2
12,891
-4.1
0.0
12,891
-4.1
3,273
24,727
-6.9
2014
142,973
105,600
37,373
-0.5
13,328
50,702
5.5
23,100
27,602
-0.3
20,265
7,337
2,982
40.6
4,355
-66.2
0.0
4,355
-66.2
756
22,678
-8.3
2015
163,686
118,306
45,380
21.4
14,998
60,379
19.1
27,394
32,984
19.5
20,802
12,182
5,798
47.6
6,384
46.6
0.0
6,384
46.6
1,405
28,554
25.9
2016E
182,946
127,674
55,273
21.8
16,719
71,992
19.2
32,270
39,721
20.4
21,021
18,700
6,265
33.5
12,436
94.8
0.0
12,436
94.8
3,622
34,855
22.1
2017E
209,680
147,262
62,418
12.9
18,420
80,838
12.3
37,412
43,426
9.3
20,313
23,113
7,743
33.5
15,370
23.6
0.0
15,370
23.6
4,477
38,460
10.3
(INR Million)
2018E
243,976
170,027
73,949
18.5
20,352
94,301
16.7
42,706
51,595
18.8
23,169
28,427
9,523
33.5
18,904
23.0
0.0
18,904
23.0
5,506
46,529
21.0
2011
5,596
59,328
64,924
921,563
18.6
76,397
26,123
1,089,007
104,590
242,040
21.0
714,354
27.3
3,175
24,849
1,089,007
2012
5,596
69,198
74,794
1,058,512
14.9
82,406
33,931
1,249,642
86,456
296,289
22.4
836,418
17.1
3,026
27,454
1,249,642
2013
5,596
78,816
84,412
1,237,956
17.0
111,193
29,428
1,462,989
64,059
376,324
27.0
983,733
17.6
3,035
35,839
1,462,989
2014
5,896
81,478
87,375
1,418,451
14.6
131,851
35,733
1,673,409
94,406
453,566
20.5
1,076,442
9.4
4,339
44,656
1,673,409
2015
6,029
94,612
100,641
1,550,122
9.3
153,072
47,868
1,851,704
76,638
464,994
2.5
1,259,547
17.0
12,636
37,889
1,851,704
2016E
6,029
96,464
102,492
1,829,144
18.0
141,163
56,235
2,129,035
97,602
534,743
15.0
1,448,479
15.0
6,533
41,677
2,129,035
(INR Million)
2017E
2018E
6,029
6,029
107,357
120,755
113,386
126,784
2,158,390
2,546,901
18.0
18.0
158,157
171,303
65,312
73,847
2,495,246
2,918,834
118,577
137,850
609,608
694,953
14.0
14.0
1,709,206
2,016,863
18.0
18.0
7,843
9,153
50,013
60,015
2,495,246
2,918,834
(%)
83,099
16,293
3.99
0.81
80.4
9,956
2,737
1.38
0.38
72.2
17,980
7,559
2.12
0.90
58.0
37,145
24,092
3.73
2.45
35.1
58,576
33,425
5.32
3.11
42.9
68,765
37,526
5.33
2.98
45.4
65,248
23,229
4.38
1.60
64.4
68,643
14,468
3.89
0.85
78.9
8

Andhra Bank
Financials and valuations
Ratios
Y/E March
Spreads Analysis (%)
Avg. Yield-Earning Assets
Avg. Yield on loans
Avg. Yield on Investments
Avg. Cost-Int. Bear. Liab.
Avg. Cost of Deposits
Interest Spread
Net Interest Margin
Profitability Ratios (%)
RoE
RoA
Int. Expense/Int.Income
Fee Income/Net Income
Non Int. Inc./Net Income
Efficiency Ratios (%)
Cost/Income*
Empl. Cost/Op. Exps.
Busi. per Empl. (INR m)
NP per Empl. (INR lac)
* ex treasury
Asset-Liability Profile (%)
Loans/Deposit Ratio
CASA Ratio
Investment/Deposit Ratio
G-Sec/Investment Ratio
CAR
Tier 1
Valuation
Book Value (INR)
Change (%)
Price-BV (x)
Adjusted BV (INR)
Price-ABV (x)
EPS (INR)
Change (%)
Price-Earnings (x)
Dividend Per Share (INR)
Dividend Yield (%)
E: MOSL Estimates
2011
9.2
10.5
6.8
5.5
5.4
3.7
3.6
2012
10.5
12.0
7.3
7.1
7.0
3.4
3.5
2013
10.2
11.3
7.4
7.4
7.4
2.9
3.0
2014
9.8
10.8
7.2
7.3
7.4
2.5
2.6
2015
10.0
10.9
7.6
7.3
7.4
2.7
2.8
2016E
9.8
10.7
7.4
7.0
7.0
2.9
3.0
2017E
9.7
10.6
7.2
6.9
6.8
2.8
2.9
2018E
9.6
10.5
7.2
6.8
6.7
2.9
2.9
23.2
1.3
61.2
17.1
21.8
19.2
1.1
66.8
15.2
18.6
16.2
1.0
70.9
15.7
21.8
5.1
0.28
73.9
16.6
26.3
6.8
0.4
72.3
17.5
24.8
12.2
0.6
69.8
16.5
23.2
14.2
0.7
70.2
16.6
22.8
15.7
0.7
69.7
16.2
21.6
43.4
64.8
104.8
8.9
40.4
63.7
120.9
9.2
45.2
63.2
130.2
8.2
50.5
59.9
134.7
2.5
49.0
62.0
131.2
3.2
48.1
62.9
134.7
5.5
49.3
63.2
149.5
6.4
47.9
62.9
167.2
7.5
77.5
29.1
26.3
94.0
14.4
9.7
79.0
26.4
28.0
90.2
13.2
9.0
79.5
25.7
30.4
87.6
11.8
8.5
75.9
24.8
32.0
88.0
10.8
8.1
81.3
27.3
30.0
80.0
10.6
8.0
79.2
27.0
29.2
82.1
7.8
7.6
79.2
27.1
28.2
85.0
7.4
7.1
79.2
27.2
27.3
88.0
7.0
6.8
116.0
27.6
0.7
112.8
0.7
22.6
5.0
3.4
5.5
7.2
133.7
15.2
0.6
124.9
0.6
24.0
6.1
3.2
5.5
7.2
150.8
12.9
0.5
122.9
0.6
23.0
-4.1
3.3
5.0
6.5
148.2
-1.8
0.5
111.3
0.7
7.4
-67.9
10.4
1.1
1.4
166.9
12.7
0.5
126.5
0.6
10.6
43.4
7.2
2.0
2.6
170.0
1.8
0.45
145.0
0.5
20.6
94.8
3.7
5.2
6.7
188.1
10.6
0.41
172.5
0.4
25.5
23.6
3.0
6.4
8.3
210.3
11.8
0.4
192.7
0.4
31.4
23.0
2.4
7.8
10.2
28 April 2015
9

Andhra Bank
Corporate profile
Company description
Andhra Bank, established in 1923, is a Hyderabad
based mid-sized Public Sector Bank. The bank has a
wide network of 2,507 branches and 2,232 ATMs
with focus on Southern India. The bank also has
two representative offices at New Jersey and
Dubai. Government of India holds 61% stake in the
bank.
Exhibit 13: Sensex rebased
Exhibit 14: Shareholding pattern (%)
Mar-15
Promoter
DII
FII
Others
61.0
15.7
7.8
15.5
Dec-14
60.1
16.3
7.6
16.0
Mar-14
60.1
10.9
11.5
17.4
Exhibit 15: Top holders
Holder Name
LIC of India
LIC of India Money Plus Growth Fund
HDFC Standard Life Insurance Company Ltd
% Holding
6.0
1.0
1.0
Note: FII Includes depository receipts
Exhibit 16: Top management
Name
C VR Rajendran
S. K. Kalra
S.V. Venkatasubramanian
Designation
Chairman & Managing Director
Executive Director
General Manager & CFO
Exhibit 17: Directors
Name
C V R Rajendran
K Thamaraiselvan
Amit Goel
Naina Sharma
Pankaj Chaturvedi
N Venkata Ramana Reddy
K Raghuraman
Name
Nandlal L Sarda
G R Sundaravadivel
Satish Kumar Kalra
K K Misra
Anandrao Vishnu Patil
E E Karthak
Y Amarnath
*Independent
Exhibit 18: Auditors
Name
C R Sagdeo & Co
Nag & Associates
Patro & Co
R Subramanian & Co
Type
Statutory
Statutory
Statutory
Statutory
Exhibit 19: MOSL forecast v/s consensus
EPS
(INR)
FY16
FY17
MOSL
forecast
20.6
25.5
Consensus
forecast
16.7
22.9
Variation
(%)
23.5
11.4
28 April 2015
10

Andhra Bank
NOTES
28 April 2015
11

Andhra
and may
This document has been prepared by Motilal Oswal Securities Limited (hereinafter referred to as Most) to provide information about the company(ies) and/sector(s), if any, covered in the report
Bank
be
distributed by it and/or its affiliated company(ies). This report is for personal information of the selected recipient/s and does not construe to be any investment, legal or taxation advice to you. This research report does
not constitute an offer, invitation or inducement to invest in securities or other investments and Motilal Oswal Securities Limited (hereinafter referred as MOSt) is not soliciting any action based upon it. This report is not
for public distribution and has been furnished to you solely for your general information and should not be reproduced or redistributed to any other person in any form. This report does not constitute a personal
recommendation or take into account the particular investment objectives, financial situations, or needs of individual clients. Before acting on any advice or recommendation in this material, investors should consider
whether it is suitable for their particular circumstances and, if necessary, seek professional advice. The price and value of the investments referred to in this material and the income from them may go down as well as
up, and investors may realize losses on any investments. Past performance is not a guide for future performance, future returns are not guaranteed and a loss of original capital may occur.
MOSt and its affiliates are a full-service, integrated investment banking, investment management, brokerage and financing group. We and our affiliates have investment banking and other business relationships with a
some companies covered by our Research Department. Our research professionals may provide input into our investment banking and other business selection processes. Investors should assume that MOSt and/or
its affiliates are seeking or will seek investment banking or other business from the company or companies that are the subject of this material and that the research professionals who were involved in preparing this
material may educate investors on investments in such business. The research professionals responsible for the preparation of this document may interact with trading desk personnel, sales personnel and other
parties for the purpose of gathering, applying and interpreting information. Our research professionals are paid on the profitability of MOSt which may include earnings from investment banking and other business.
MOSt generally prohibits its analysts, persons reporting to analysts, and members of their households from maintaining a financial interest in the securities or derivatives of any companies that the analysts cover.
Additionally, MOSt generally prohibits its analysts and persons reporting to analysts from serving as an officer, director, or advisory board member of any companies that the analysts cover. Our salespeople, traders,
and other professionals or affiliates may provide oral or written market commentary or trading strategies to our clients that reflect opinions that are contrary to the opinions expressed herein, and our proprietary
trading and investing businesses may make investment decisions that are inconsistent with the recommendations expressed herein. In reviewing these materials, you should be aware that any or all of the foregoing
among other things, may give rise to real or potential conflicts of interest. MOSt and its affiliated company(ies), their directors and employees and their relatives may; (a) from time to time, have a long or short position
in, act as principal in, and buy or sell the securities or derivatives thereof of companies mentioned herein. (b) be engaged in any other transaction involving such securities and earn brokerage or other compensation
or act as a market maker in the financial instruments of the company(ies) discussed herein or act as an advisor or lender/borrower to such company(ies) or may have any other potential conflict of interests with
respect to any recommendation and other related information and opinions.; however the same shall have no bearing whatsoever on the specific recommendations made by the analyst(s), as the recommendations
made by the analyst(s) are completely independent of the views of the affiliates of MOSt even though there might exist an inherent conflict of interest in some of the stocks mentioned in the research report
Reports based on technical and derivative analysis center on studying charts company's price movement, outstanding positions and trading volume, as opposed to focusing on a company's fundamentals and, as
such, may not match with a report on a company's fundamental analysis. In addition MOST has different business segments / Divisions with independent research separated by Chinese walls catering to different set
of customers having various objectives, risk profiles, investment horizon, etc, and therefore may at times have different contrary views on stocks sectors and markets.
Unauthorized disclosure, use, dissemination or copying (either whole or partial) of this information, is prohibited. The person accessing this information specifically agrees to exempt MOSt or any of its affiliates or
employees from, any and all responsibility/liability arising from such misuse and agrees not to hold MOSt or any of its affiliates or employees responsible for any such misuse and further agrees to hold MOSt or any of
its affiliates or employees free and harmless from all losses, costs, damages, expenses that may be suffered by the person accessing this information due to any errors and delays. The information contained herein is
based on publicly available data or other sources believed to be reliable. Any statements contained in this report attributed to a third party represent MOSt’s interpretation of the data, information and/or opinions
provided by that third party either publicly or through a subscription service, and such use and interpretation have not been reviewed by the third party. This Report is not intended to be a complete statement or
summary of the securities, markets or developments referred to in the document. While we would endeavor to update the information herein on reasonable basis, MOSt and/or its affiliates are under no obligation to
update the information. Also there may be regulatory, compliance, or other reasons that may prevent MOSt and/or its affiliates from doing so. MOSt or any of its affiliates or employees shall not be in any way
responsible and liable for any loss or damage that may arise to any person from any inadvertent error in the information contained in this report. MOSt or any of its affiliates or employees do not provide, at any time,
any express or implied warranty of any kind, regarding any matter pertaining to this report, including without limitation the implied warranties of merchantability, fitness for a particular purpose, and non-infringement.
The recipients of this report should rely on their own investigations.
This report is intended for distribution to institutional investors. Recipients who are not institutional investors should seek advice of their independent financial advisor prior to taking any investment decision based on
this report or for any necessary explanation of its contents.
Most and it’s associates may have managed or co-managed public offering of securities, may have received compensation for investment banking or merchant banking or brokerage services, may have received any
compensation for products or services other than investment banking or merchant banking or brokerage services from the subject company in the past 12 months.
Most and it’s associates have not received any compensation or other benefits from the subject company or third party in connection with the research report.
Subject Company may have been a client of Most or its associates during twelve months preceding the date of distribution of the research report
MOSt and/or its affiliates and/or employees may have interests/positions, financial or otherwise of over 1 % at the end of the month immediately preceding the date of publication of the research in the securities
mentioned in this report. To enhance transparency, MOSt has incorporated a Disclosure of Interest Statement in this document. This should, however, not be treated as endorsement of the views expressed in the
report.
Motilal Oswal Securities Limited is under the process of seeking registration under SEBI (Research Analyst) Regulations, 2014.
There are no material disciplinary action that been taken by any regulatory authority impacting equity research analysis activities
Analyst Certification
The views expressed in this research report accurately reflect the personal views of the analyst(s) about the subject securities or issues, and no part of the compensation of the research analyst(s) was, is, or will be
directly or indirectly related to the specific recommendations and views expressed by research analyst(s) in this report. The research analysts, strategists, or research associates principally responsible for preparation
of MOSt research receive compensation based upon various factors, including quality of research, investor client feedback, stock picking, competitive factors and firm revenues
Disclosure of Interest Statement
Analyst ownership of the stock
Served as an officer, director or employee
ANDHRA BANK
No
No
Disclosures
Regional Disclosures (outside India)
For U.S.
This report is not directed or intended for distribution to or use by any person or entity resident in a state, country or any jurisdiction, where such distribution, publication, availability or use would be contrary to law,
regulation or which would subject MOSt & its group companies to registration or licensing requirements within such jurisdictions.
Motilal Oswal Securities Limited (MOSL) is not a registered broker - dealer under the U.S. Securities Exchange Act of 1934, as amended (the"1934 act") and under applicable state laws in the United States. In
addition MOSL is not a registered investment adviser under the U.S. Investment Advisers Act of 1940, as amended (the "Advisers Act" and together with the 1934 Act, the "Acts), and under applicable state laws in the
United States. Accordingly, in the absence of specific exemption under the Acts, any brokerage and investment services provided by MOSL, including the products and services described herein are not available to or
intended for U.S. persons.
This report is intended for distribution only to "Major Institutional Investors" as defined by Rule 15a-6(b)(4) of the Exchange Act and interpretations thereof by SEC (henceforth referred to as "major institutional
investors"). This document must not be acted on or relied on by persons who are not major institutional investors. Any investment or investment activity to which this document relates is only available to major
institutional investors and will be engaged in only with major institutional investors. In reliance on the exemption from registration provided by Rule 15a-6 of the U.S. Securities Exchange Act of 1934, as amended (the
"Exchange Act") and interpretations thereof by the U.S. Securities and Exchange Commission ("SEC") in order to conduct business with Institutional Investors based in the U.S., MOSL has entered into a chaperoning
agreement with a U.S. registered broker-dealer, Motilal Oswal Securities International Private Limited. ("MOSIPL"). Any business interaction pursuant to this report will have to be executed within the provisions of this
chaperoning agreement.
The Research Analysts contributing to the report may not be registered /qualified as research analyst with FINRA. Such research analyst may not be associated persons of the U.S. registered broker-dealer, MOSIPL,
and therefore, may not be subject to NASD rule 2711 and NYSE Rule 472 restrictions on communication with a subject company, public appearances and trading securities held by a research analyst account.
Motilal Oswal Capital Markets Singapore Pte Limited is acting as an exempt financial advisor under section 23(1)(f) of the Financial Advisers Act(FAA) read with regulation 17(1)(d) of the Financial Advisors
Regulations and is a subsidiary of Motilal Oswal Securities Limited in India. This research is distributed in Singapore by Motilal Oswal Capital Markets Singapore Pte Limited and it is only directed in Singapore to
accredited investors, as defined in the Financial Advisers Regulations and the Securities and Futures Act (Chapter 289), as amended from time to time.
In respect of any matter arising from or in connection with the research you could contact the following representatives of Motilal Oswal Capital Markets Singapore Pte Limited:
Anosh Koppikar
Kadambari Balachandran
Email : anosh.Koppikar@motilaloswal.com
Email : kadambari.balachandran@motilaloswal.com
Contact : (+65)68189232
Contact : (+65) 68189233 / 65249115
Office Address : 21 (Suite 31),16 Collyer Quay,Singapore 04931
For Singapore
Motilal Oswal Securities Ltd
28 April 2015
Motilal Oswal Tower, Level 9, Sayani Road, Prabhadevi, Mumbai 400 025
Phone: +91 22 3982 5500 E-mail: reports@motilaloswal.com
12