29 April 2015
1QCY15 Results Update | Sector:
Cement
Ambuja Cements
BSE SENSEX
27,226
Bloomberg
Equity Shares (m)
M.Cap. (INR b)/(USD b)
52-Week Range (INR)
1, 6, 12 Rel. Per (%)
Avg Val(INRm)/Vol‘000
Free float (%)
S&P CNX
8,240
ACEM IN
1,549.8
370.2/5.8
287/192
-3/6/-3
473/2,078
49.7
n
Financials & Valuation (INR Billion)
Y/E Dec
2014 2015E 2016E
Sales
EBITDA
NP
Adj. EPS (INR)
EPS Gr. (%)
BV/Sh. (INR)
RoE (%)
RoCE (%)
P/E (x)
P/BV (x)
EV/EBITDA (x)
99.1
18.6
13.2
8.5
25.9
65.6
13.4
18.7
28.0
98.8 113.0
17.8 24.1
12.2 17.2
6.1
8.7
-27.9 41.5
94.9 99.3
8.4
9.0
11.9 12.7
27.4 19.4
1.8
17.9
172
1.7
13.0
165
CMP: INR239
n
TP: INR260 (+9%)
Neutral
Double digit volume whammy; cost benefits protects margins; Neutral
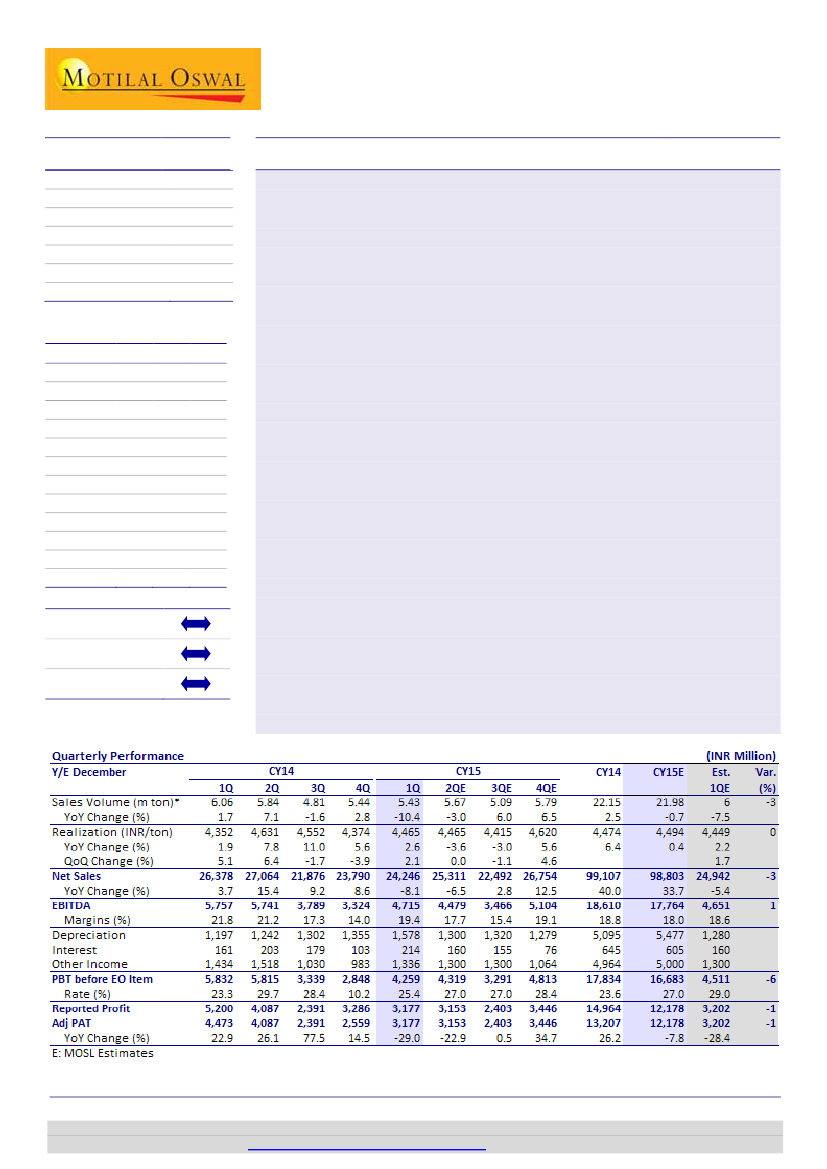
Double digit volume dip led weakest March-Q volume since CY11:
ACEM’s
1QCY15 cement volume de-grew 10.4% YoY (flat QoQ) at 5.43mt (est. of ~8%
de-growth), with the western region being the weakest contributor.
Realizations stood in line at INR4,465/ton (+2.1% QoQ), with worst trend in
north. Revenue down 8.1% YoY (+1.9% QoQ) to INR24.2b (v/s est. of INR24.9b).
Cost benefits percolate; freight cost was dampener:
Cost benefits came from
(1) lower energy cost due to mix-optimization (higher imported coal) and 4-5%
QoQ moderation in pet coke price, (2) 15-20% QoQ decline in packaging cost
(lower of crude prices) and (3) lower advertisement expenses and spares.
However, the benefits were negated by higher freight (+10% QoQ) due to high
inter-unit clinker logistics and increase in rail freight cost.
Good margins despite volume cliff:
EBITDA de-grew 18% YoY (42% QoQ) to
~INR4.7b (in-line), translating into better-than-expected EBITDA margin of
19.4% (-2.4pp YoY). EBITDA/ton improved by INR257 QoQ (-INR81 YoY) to
INR868 (v/s est. of ~INR829). PAT stood at INR3.17b (v/s est. of INR3.2b), as
lower tax rates (25% v/s est. of 29%) offset the higher depreciation.
Modest cost push ahead; CY15 margins can expand on 1% YoY price rise:
With
the benefits of lower input cost and savings in packaging cost, ACEM is likely to
witness no major inflationary push in CY15 (~1% YoY). Thus, realizations growth
of >1% YoY (v/s est. of flat) would trigger an expansion in profitability.
Maintain Neutral on sub-normal volume lever, fair valuation:
We cut
CY15E/16E EPS by 5%/1% to INR6.1/INR8.7. With limited expansion plan and
weak industry demand growth, ACEM is likely to underperform in volume
growth over the near term. Anticipated synergy befits are delayed. We value
ACEM at USD175/ton (25% discount to UTCEM’s target valuation), translating
into a target price of INR260 (implied EV/EBITDA of 13.3x CY16E), with 9%
upside to CMP. Maintain
Neutral.
n
3.6
18.3
EV/Ton (USD) 185
Estimate change
TP change
Rating change
n
n
Sandipan Pal
(Sandipan.Pal@MotilalOswal.com); +91 22 3982 5436
Jinesh Gandhi
(Jinesh@MotilalOswal.com); +91 22 3982 5416
Investors are advised to refer through disclosures made at the end of the Research Report.
Motilal Oswal research is available on
www.motilaloswal.com/Institutional-Equities,
Bloomberg, Thomson Reuters, Factset and S&P Capital.

Ambuja Cements
Double digit volume whammy; realizations in line
n
n
n
ACEM’s 1QCY15 cement volume de-grew 10.4% YoY (flat QoQ) at 5.43mt v/s est
of ~8% de-growth. Realizations stood at INR4,465/ton (+2.1% QoQ) v/s
estimates of 2.2% QoQ uptick.
Double digit volume de-growth was attributable to mid-teen YoY de-growth in
west and 5-6% de-growth in north and east.
Net sales de-grew by 8.1% YoY (+1.9% QoQ) to INR24.2b (v/s est of INR24.9b).
Cost benefits protect margins; higher freight cost a drag
n
n
n
n
n
EBITDA de-grew 18% YoY (42% QoQ) to ~INR4.7b (v/s est ~IN4.6b), translating
into EBITDA margin of 19.4% (+5.4pp QoQ and -2.4pp YoY) v/s est of 18.6%.
EBITDA/ton improved INR257 QoQ (-INR81 YoY) to INR868 (v/s est ~INR829).
Cost benefits came from (1) lower energy cost due to change in mix (more
imported coal) and 4-5% QoQ moderation in pet coke price, (2) 15-20% QoQ
decline in packaging cost (softening of crude prices), and (3) lower
advertisement expenses and spares.
However the benefits were negated by (a) higher freight cost (+10% QoQ) due
to higher inter-unit clinker logistics, and overall increase in rail freight cost, and
(b) lower savings on operating leverage (weak volume)
PAT was down 29% YoY to INR3.17b (v/s est of INR3.20b), as lower tax rates
(25% v/s est of 29%) offsets higher depreciation.
Exhibit 2:
Cost savings drives margin
EBITDA (INR m)
28.428.2
18.5
26.2
20.121.0
18.5
EBITDA Margin (%)
21.8 21.2
19.4
17.3
14.0
12.6 13.2
Exhibit 1:
Volumes and realizations trends anticipated
Volume (MT)
Net Realization (INR/ton)
5.7 6.2 5.6 4.8 5.4 6.0 5.5 4.9 5.3 6.1 5.8 4.8 5.4 5.4
Source: Company, MOSL
Exhibit 3: In line realizations and lower cost led beat in EBTIDA/ton
EBITDA (INR/Ton)
Source: Company, MOSL
29 April 2015
2

Ambuja Cements
Exhibit 4: Income statement (INR/ton)
Net Realization
Raw Material
Staff Cost
Power & Fuel
Freight
Other exp
Total Cost
EBITDA
1QCY15
4,465
391
273
989
1,143
802
3,597
868
1QCY14
4,352
433
213
954
1,088
714
3,402
950
YoY (%)
0.5
12.6
46.3
6.5
-5.1
28.1
10.6
-35.7
4QCY14
4,374
488
311
1,017
1,032
915
3,763
611
QoQ (%)
2.1
-19.8
-12.5
-2.8
10.8
-12.4
-4.4
42.1
Source: MOSL, Company
Other updates and management outlook
n
n
n
Coal block at Gare-Palma in Chhattisgarh is expected to commence mining
operations in CY18 and the company is expected to reap benefits in the long
term of the INR3.7b capital spends.
Macro factors and key government reforms such as ‘Housing for All’ and focus
on infrastructure are expected to be key triggers for the sector.
Rural demand outlook remain dampener amidst expectation on uptick in
government spending over near-term.
Cutting CY15/16 EPS by 1-5%
n
n
We are cutting EPS for CY15/CY16 by 5%/1% to INR6.1/INR8.7 respectively, to
factor in for (a) lower volume and realizations, (b) higher freight cost, (c) higher
depreciation partly offset by (d) lower packaging cost
We factor in for flat/5% YoY volume growth in CY15/16, and flat/INR20 per bag
YoY rise in realizations in CY15/16.
Exhibit 5: Revised estimates
(INR b)
Volumes (MT)
Realizations (INR/Ton)
Net Sales
EBITDA (INR/Ton)
Net Profit
EPS (INR)
Rev
22.0
4,494
98.8
808
12.2
6.1
CY15E
Old
22.6
4,489
101.4
815
12.8
6.4
Chg (%)
-2.7
0.1
-2.6
-0.9
-4.7
-4.7
Rev
23.1
4,894
113.0
1,044
17.2
8.7
CY16E
Old
23.7
4,889
116.0
1,053
17.4
8.8
Chg (%)
-2.7
0.1
-2.6
-0.8
-0.9
-0.9
Source: MOSL
29 April 2015
3

Ambuja Cements
Valuation and views
n
n
n
n
n
ACEM has strong market mix, efficient operations driving superior portability
along with healthy balance sheet with ~INR24b of net cash as on Dec-2014.
ACC’s acquisition, through Holcim’s restructuring transaction (albeit taking
higher than anticipated time), doubles ACEM’s capacity along with potential
synergistic benefits. However the benefits would be deferred due to global
consolidation between Holcim and Lafarge.
Barring synergies, there has been separate efforts to reduce cost viz. 1) lower
freight cost by 10% (RFID implementation, reducing demurrage time, third party
transporters), (2) higher alternate fuel usage (from 4% to 10%) etc.
Nonetheless, with limited expansion plan and weak industry demand growth,
ACEM could lose on market share and is likely to drive sub-par volume growth
over near future.
At 20-25% lower profitability than UTCEM, we value ACEM at USD175/ton (25%
discount to UTCEM’s target valuation), translating into target price of INR260
(implied EV/EBITDA 13.3x CY16E). It offers 9% upside at CMP. Maintain
Neutral.
Exhibit 6: Quarterly trends (INR/ton)
1QCY13 2QCY13 3QCY13 4QCY13
Realization
4,271 4,297 4,099 4,142
Raw Material
410
189
435
406
Staff Cost
203
242
266
226
Power & fuel
963 1,018
935
946
Freight
1,082 1,125 1,040 1,093
Other expenditure
754
822
904
924
Total Cost per ton
3,412 3,396 3,581 3,595
EBITDA
859
901
518
546
1QCY14 2QCY14 3QCY14 4QCY14
4,352 4,631 4,552 4,374
433
298
309
488
213
241
296
311
954 1,068 1,061 1,017
1,088 1,165 1,141 1,032
714
876
956
915
3,402 3,649 3,763 3,763
950
982
788
611
1QCY15
4,465
391
273
989
1,143
802
3,597
868
Source: MOSL, Company
29 April 2015
4

Ambuja Cements
Story in charts
Exhibit 7: Near-term expansion visibility limited
Capacity (MT)
95
75
18
19
25
19
25
20
27
21
28
22
29
22
81
78
79
75
75
30
74
30
76
30
18.7
19.4
24.7
15.5
Dispatches (MT)
Cap. Util (%)
Exhibit 8: Profitability improvement hinges in pricing
28.4
EBITDA (INR b)
26.4
24.7
22.8
25.5
17.0
18.8
18.0
Margin (%)
21.3
22
22
23
17.6
18.2
18.6
17.8
24.1
CY08
CY09
CY10
CY11
CY12
CY13
CY14 CY15E CY16E
CY08 CY09 CY10 CY11 CY12 CY13 CY14 CY15E CY16E
Source: Company, MOSL
Exhibit 9: Trend in EBITDA/ton
Exhibit 10: EPS growth likely to under-perform peers
EPS (INR)
10.0
7.6
7.8
8.1
8.2
6.8
22.4
0.6
-32.4
EPS Growth (%)
8.5
25.9
6.1
8.7
41.5
2.1
-11.2
CY08
CY09
4.3
-27.9
CY10
CY11
CY12
CY13
CY14 CY15E CY16E
Source: Company, MOSL
Exhibit 11: Lower in return ratios factor in ACC consolidation
Exhibit 12: B/S strength to address cash outgo on merger
CFO (INR m)
CAPEX (INR m)
14
14
9
7
21
14
9
19
7
19
10
9
24
FCF (INR m)
S/A RoE (%)
19.4
22.2
17.9
16.2
18.1
11.4
13.4
8.4
9.0
17
11
9
13
12
8
19
17
6
12
12
-3
12
CY08
CY09
CY10
CY11
CY12
CY13 CY14E CY15E CY16E
22
CY08 CY09 CY10 CY11 CY12 CY13 CY14E CY15E CY16E
Source: Company, MOSL
29 April 2015
5

Ambuja Cements
Financials and valuations
Income Statement
Y/E December
Net Sales
Change (%)
Total Expenditure
% of Sales
EBITDA
Change (%)
Margin (%)
Depreciation
EBIT
Interest
Other Income - Rec.
PBT before EO Exp.
EO Exp/(Inc)
PBT after EO Exp.
Current Tax
Deferred Tax
Tax Rate (%)
Reported PAT
PAT Adj for EO Items
Change (%)
Margin (%)
2010
73,902
4.4
55,666
75.3
18,236
-2.3
24.7
3,872
14,364
487
2,476
16,353
-265
16,619
3,532
450
24.0
12,636
12,434
4.7
16.8
2011
85,043
15.1
65,656
77.2
19,387
6.3
22.8
4,452
14,935
526
2,978
17,387
358
17,029
3,613
1,127
27.8
12,289
12,547
0.9
14.8
2012
96,749
13.8
72,074
74.5
24,675
27.3
25.5
5,373
19,302
757
4,042
22,588
3,570
19,018
6,048
0
31.8
12,971
15,435
23.0
16.0
2013
90,868
-6.1
75,386
83.0
15,482
-37.3
17.0
4,901
10,581
651
4,349
14,280
-3,269
17,549
4,603
0
26.2
12,946
10,464
-32.2
11.5
2014
99,107
9.1
80,497
81.2
18,610
20.2
18.8
5,095
13,515
645
4,964
17,834
-1,757
19,591
4,627
0
23.6
14,964
13,207
26.2
2015E
98,803
-0.3
81,039
82.0
17,764
-4.5
18.0
5,477
12,287
605
5,000
16,683
0
16,683
4,171
334
27.0
12,178
12,178
-7.8
(INR Million)
2016E
112,977
14.3
88,867
78.7
24,110
35.7
21.3
5,588
18,522
587
6,000
23,934
0
23,934
6,223
479
28.0
17,233
17,233
41.5
13.3
12.3
15.3
Balance Sheet
Y/E December
Equity Share Capital
Total Reserves
Net Worth
Def. Liabilities
Total Loans
Capital Employed
Gross Block
Less: Accum. Depn.
Net Fixed Assets
Capital WIP
Investments
Curr. Assets
Inventory
Debtors
Cash & Bank Bal
Others
Curr. Liability & Prov.
Creditors
Provisions
Net Current Assets
Appl. of Funds
E: MOSL Estimates
2010
3,060
70,241
73,301
5,309
650
79,260
87,788
31,511
56,278
9,307
6,260
31,353
9,019
1,282
16,482
4,571
23,942
12,976
10,966
7,412
79,260
2011
3,069
77,626
80,694
6,436
466
87,597
97,023
35,158
61,865
4,868
8,643
40,043
9,250
2,409
20,691
7,694
27,822
15,909
11,913
12,221
87,597
2012
3,084
84,966
88,051
5,483
395
93,929
101,836
43,213
58,624
5,201
16,558
43,864
9,839
2,134
22,537
9,353
30,318
15,904
14,414
13,545
93,929
2013
3,092
91,764
94,855
5,643
292
100,790
108,262
47,637
60,625
6,949
17,885
44,187
9,339
2,315
23,411
9,122
28,856
17,845
11,011
15,332
100,790
2014
3,100
2015E
3,966
(INR Million)
2016E
3,966
97,934
101,033
5,890
191
107,115
118,711
52,732
64,173
5,000
21,727
48,108
8,884
2,280
24,581
12,364
31,894
19,806
12,088
16,215
107,115
183,462
187,428
6,224
500
194,152
124,711
58,209
66,502
6,000
119,507
33,441
10,151
2,436
11,379
9,474
31,297
17,762
13,535
2,144
194,152
192,229
196,195
6,703
500
203,398
135,211
63,797
71,414
7,500
119,507
39,931
11,607
2,786
14,705
10,833
34,954
19,478
15,476
4,977
203,398
29 April 2015
6

Ambuja Cements
Financials and valuations
Ratios
Y/E December
Basic (INR)
EPS
Cash EPS
BV/Share
DPS
Payout (%)
Valuation (x)
P/E
Cash P/E
P/BV
EV/Sales
EV/EBITDA
EV/Ton (Cap) - US$
Dividend Yield (%)
Return Ratios (%)
RoE
RoCE
Working Capital Ratios
Asset Turnover (x)
Debtor (Days)
Work Cap (Days)
Leverage Ratio (x)
Current Ratio
Debt/Equity
2010
8.1
10.7
48.4
2.6
31.4
29.4
22.4
4.9
4.6
18.8
221
1.1
17.9
23.8
0.9
6
37
1.3
0.0
16.2
22.9
1.0
10
52
1.4
0.0
18.1
27.3
1.0
8
51
1.4
0.0
2011
8.2
11.1
53.0
3.2
46.4
2012
10.0
13.5
57.5
3.6
49.5
2013
6.8
9.9
61.8
3.6
49.9
35.3
24.0
3.9
3.5
20.8
179
1.5
11.4
16.1
0.9
9
62
1.5
0.0
2014
8.5
11.8
65.6
5.0
61.8
28.0
20.2
3.6
3.4
18.3
185
2.1
13.4
18.7
0.9
8
60
1.5
0.0
2015E
6.1
8.9
94.9
3.9
70.3
27.4
18.9
1.8
3.2
17.9
172
1.6
8.4
11.9
0.5
9
8
1.1
0.0
2016E
8.7
11.5
99.3
3.9
49.1
19.4
14.6
1.7
2.8
13.0
165
1.6
9.0
12.7
0.6
9
16
1.1
0.0
Cash Flow Statement
Y/E December
Op. Profit before Tax
Interest/Div. Recd.
Direct Taxes Paid
(Inc)/Dec in WC
CF from Operations
EO Income
CF from Op. incl EO Exp
(inc)/dec in FA
(Pur)/Sale of Invest.
CF from Investments
Issue of Shares
(Inc)/Dec in Debt
Interest Paid
Dividend Paid
CF from Fin. Activity
Inc/Dec of Cash
Add: Beginning Bal.
Closing Balance
E: MOSL Estimates
2010
18,236
2,476
-3,983
2,617
19,347
265
19,612
-7,870
965
-6,905
-42
-534
-487
-3,972
-5,035
7,673
8,809
16,482
2011
20,260
1,555
-4,722
-203
16,890
0
16,890
-6,233
196
-6,037
462
738
-251
-5,697
-4,748
6,105
16,482
22,586
2012
25,393
2,340
-6,399
-417
20,917
0
20,917
-6,870
601
-6,269
831
-636
-275
-4,964
-5,044
9,604
20,691
30,295
2013
15,482
4,349
-4,603
-913
14,316
3,269
17,585
-8,650
-1,326
-9,976
322
57
-651
-6,462
-6,735
874
22,537
23,411
2014
18,610
4,964
-4,627
287
19,234
1,757
20,991
-6,694
-3,843
-10,537
455
147
-645
-9,241
-9,284
1,170
23,411
24,581
2015E
17,764
5,000
-4,504
868
19,128
0
19,128
-8,806
-97,779
-106,585
82,779
643
-605
-8,563
74,255
-13,202
24,581
11,379
(INR Million)
2016E
24,110
6,000
-6,702
492
23,901
0
23,901
-12,000
0
-12,000
0
479
-587
-8,466
-8,575
3,326
11,379
14,705
29 April 2015
7

Ambuja Cements
Corporate profile: Ambuja Cements
Company description
Ambuja Cement, a part of the Holcim group, is the
third largest cement company in India with total
capacity of 28.8mt under its control. It is one of the
lowest cost producers of cement, with focus on
structurally sound markets of North, West and
East. It is also the largest exporter of cement from
India.
Exhibit 13: Sensex rebased
Exhibit 14:
Shareholding pattern (%)
Mar-15
Promoter
DII
FII
Others
50.3
9.6
32.5
7.6
Dec-14
50.4
9.8
32.1
7.8
Mar-14
50.5
9.4
32.2
8.0
Exhibit 15:
Top holders
Holder Name
LIC of India
Aberdeen Global Indian Equity Mauritius
Oppenheimer Developing Markets Fund
Genesis Indian Investment Company Ltd
% Holding
6.4
3.2
2.9
1.6
Note: FII Includes depository receipts
Exhibit 16:
Top management
Name
N S Sekhsaria
Suresh Neotia
Bernard Terver
Ajai Kapur
Bernard Fontana
Designation
Chairman
Chairman Emeritus
Vice Chairman
Managing Director & CEO
Director
Exhibit 17:
Directors
Name
N S Sekhsaria*
Suresh Neotia
Ajai Kapur
Bernard Fontana
Omkar Goswami*
Nasser Munjee*
Name
Haigreve Khaitan*
Rajendra P Chitale*
Shailesh Haribhakti*
Bernard Terver
B L Taparia
Usha Sangwan
*Independent
Exhibit 18: Auditors
Name
S R B C & Co LLP
P M Nanabhoy & Co
Type
Statutory
Cost Auditor
Exhibit 19:
MOSL forecast v/s consensus
EPS
(INR)
CY15
CY16
MOSL
forecast
6.1
8.7
Consensus
forecast
12.8
12.2
Variation
(%)
-52.3
-28.5
29 April 2015
8

Ambuja Cements
NOTES
29 April 2015
9

Disclosures
Ambuja
report and may
This document has been prepared by Motilal Oswal Securities Limited (hereinafter referred to as Most) to provide information about the company(ies) and/sector(s), if any, covered in the
Cements
be
distributed by it and/or its affiliated company(ies). This report is for personal information of the selected recipient/s and does not construe to be any investment, legal or taxation advice to you. This research report does
not constitute an offer, invitation or inducement to invest in securities or other investments and Motilal Oswal Securities Limited (hereinafter referred as MOSt) is not soliciting any action based upon it. This report is not
for public distribution and has been furnished to you solely for your general information and should not be reproduced or redistributed to any other person in any form. This report does not constitute a personal
recommendation or take into account the particular investment objectives, financial situations, or needs of individual clients. Before acting on any advice or recommendation in this material, investors should consider
whether it is suitable for their particular circumstances and, if necessary, seek professional advice. The price and value of the investments referred to in this material and the income from them may go down as well as
up, and investors may realize losses on any investments. Past performance is not a guide for future performance, future returns are not guaranteed and a loss of original capital may occur.
MOSt and its affiliates are a full-service, integrated investment banking, investment management, brokerage and financing group. We and our affiliates have investment banking and other business relationships with a
some companies covered by our Research Department. Our research professionals may provide input into our investment banking and other business selection processes. Investors should assume that MOSt and/or
its affiliates are seeking or will seek investment banking or other business from the company or companies that are the subject of this material and that the research professionals who were involved in preparing this
material may educate investors on investments in such business. The research professionals responsible for the preparation of this document may interact with trading desk personnel, sales personnel and other
parties for the purpose of gathering, applying and interpreting information. Our research professionals are paid on the profitability of MOSt which may include earnings from investment banking and other business.
MOSt generally prohibits its analysts, persons reporting to analysts, and members of their households from maintaining a financial interest in the securities or derivatives of any companies that the analysts cover.
Additionally, MOSt generally prohibits its analysts and persons reporting to analysts from serving as an officer, director, or advisory board member of any companies that the analysts cover. Our salespeople, traders,
and other professionals or affiliates may provide oral or written market commentary or trading strategies to our clients that reflect opinions that are contrary to the opinions expressed herein, and our proprietary
trading and investing businesses may make investment decisions that are inconsistent with the recommendations expressed herein. In reviewing these materials, you should be aware that any or all of the foregoing
among other things, may give rise to real or potential conflicts of interest. MOSt and its affiliated company(ies), their directors and employees and their relatives may; (a) from time to time, have a long or short position
in, act as principal in, and buy or sell the securities or derivatives thereof of companies mentioned herein. (b) be engaged in any other transaction involving such securities and earn brokerage or other compensation
or act as a market maker in the financial instruments of the company(ies) discussed herein or act as an advisor or lender/borrower to such company(ies) or may have any other potential conflict of interests with
respect to any recommendation and other related information and opinions.; however the same shall have no bearing whatsoever on the specific recommendations made by the analyst(s), as the recommendations
made by the analyst(s) are completely independent of the views of the affiliates of MOSt even though there might exist an inherent conflict of interest in some of the stocks mentioned in the research report
Reports based on technical and derivative analysis center on studying charts company's price movement, outstanding positions and trading volume, as opposed to focusing on a company's fundamentals and, as
such, may not match with a report on a company's fundamental analysis. In addition MOST has different business segments / Divisions with independent research separated by Chinese walls catering to different set
of customers having various objectives, risk profiles, investment horizon, etc, and therefore may at times have different contrary views on stocks sectors and markets.
Unauthorized disclosure, use, dissemination or copying (either whole or partial) of this information, is prohibited. The person accessing this information specifically agrees to exempt MOSt or any of its affiliates or
employees from, any and all responsibility/liability arising from such misuse and agrees not to hold MOSt or any of its affiliates or employees responsible for any such misuse and further agrees to hold MOSt or any of
its affiliates or employees free and harmless from all losses, costs, damages, expenses that may be suffered by the person accessing this information due to any errors and delays. The information contained herein is
based on publicly available data or other sources believed to be reliable. Any statements contained in this report attributed to a third party represent MOSt’s interpretation of the data, information and/or opinions
provided by that third party either publicly or through a subscription service, and such use and interpretation have not been reviewed by the third party. This Report is not intended to be a complete statement or
summary of the securities, markets or developments referred to in the document. While we would endeavor to update the information herein on reasonable basis, MOSt and/or its affiliates are under no obligation to
update the information. Also there may be regulatory, compliance, or other reasons that may prevent MOSt and/or its affiliates from doing so. MOSt or any of its affiliates or employees shall not be in any way
responsible and liable for any loss or damage that may arise to any person from any inadvertent error in the information contained in this report. MOSt or any of its affiliates or employees do not provide, at any time,
any express or implied warranty of any kind, regarding any matter pertaining to this report, including without limitation the implied warranties of merchantability, fitness for a particular purpose, and non-infringement.
The recipients of this report should rely on their own investigations.
This report is intended for distribution to institutional investors. Recipients who are not institutional investors should seek advice of their independent financial advisor prior to taking any investment decision based on
this report or for any necessary explanation of its contents.
Most and it’s associates may have managed or co-managed public offering of securities, may have received compensation for investment banking or merchant banking or brokerage services, may have received any
compensation for products or services other than investment banking or merchant banking or brokerage services from the subject company in the past 12 months.
Most and it’s associates have not received any compensation or other benefits from the subject company or third party in connection with the research report.
Subject Company may have been a client of Most or its associates during twelve months preceding the date of distribution of the research report
MOSt and/or its affiliates and/or employees may have interests/positions, financial or otherwise of over 1 % at the end of the month immediately preceding the date of publication of the research in the securities
mentioned in this report. To enhance transparency, MOSt has incorporated a Disclosure of Interest Statement in this document. This should, however, not be treated as endorsement of the views expressed in the
report.
Motilal Oswal Securities Limited is under the process of seeking registration under SEBI (Research Analyst) Regulations, 2014.
There are no material disciplinary action that been taken by any regulatory authority impacting equity research analysis activities
Analyst Certification
The views expressed in this research report accurately reflect the personal views of the analyst(s) about the subject securities or issues, and no part of the compensation of the research analyst(s) was, is, or will be
directly or indirectly related to the specific recommendations and views expressed by research analyst(s) in this report. The research analysts, strategists, or research associates principally responsible for preparation
of MOSt research receive compensation based upon various factors, including quality of research, investor client feedback, stock picking, competitive factors and firm revenues
Disclosure of Interest Statement
§
Analyst ownership of the stock
§
Served as an officer, director or employee
AMBUJA CEMENTS LTD
No
No
Regional Disclosures (outside India)
For U.S.
This report is not directed or intended for distribution to or use by any person or entity resident in a state, country or any jurisdiction, where such distribution, publication, availability or use would be contrary to law,
regulation or which would subject MOSt & its group companies to registration or licensing requirements within such jurisdictions.
Motilal Oswal Securities Limited (MOSL) is not a registered broker - dealer under the U.S. Securities Exchange Act of 1934, as amended (the"1934 act") and under applicable state laws in the United States. In
addition MOSL is not a registered investment adviser under the U.S. Investment Advisers Act of 1940, as amended (the "Advisers Act" and together with the 1934 Act, the "Acts), and under applicable state laws in the
United States. Accordingly, in the absence of specific exemption under the Acts, any brokerage and investment services provided by MOSL, including the products and services described herein are not available to or
intended for U.S. persons.
This report is intended for distribution only to "Major Institutional Investors" as defined by Rule 15a-6(b)(4) of the Exchange Act and interpretations thereof by SEC (henceforth referred to as "major institutional
investors"). This document must not be acted on or relied on by persons who are not major institutional investors. Any investment or investment activity to which this document relates is only available to major
institutional investors and will be engaged in only with major institutional investors. In reliance on the exemption from registration provided by Rule 15a-6 of the U.S. Securities Exchange Act of 1934, as amended (the
"Exchange Act") and interpretations thereof by the U.S. Securities and Exchange Commission ("SEC") in order to conduct business with Institutional Investors based in the U.S., MOSL has entered into a chaperoning
agreement with a U.S. registered broker-dealer, Motilal Oswal Securities International Private Limited. ("MOSIPL"). Any business interaction pursuant to this report will have to be executed within the provisions of this
chaperoning agreement.
The Research Analysts contributing to the report may not be registered /qualified as research analyst with FINRA. Such research analyst may not be associated persons of the U.S. registered broker-dealer, MOSIPL,
and therefore, may not be subject to NASD rule 2711 and NYSE Rule 472 restrictions on communication with a subject company, public appearances and trading securities held by a research analyst account.
Motilal Oswal Capital Markets Singapore Pte Limited is acting as an exempt financial advisor under section 23(1)(f) of the Financial Advisers Act(FAA) read with regulation 17(1)(d) of the Financial Advisors
Regulations and is a subsidiary of Motilal Oswal Securities Limited in India. This research is distributed in Singapore by Motilal Oswal Capital Markets Singapore Pte Limited and it is only directed in Singapore to
accredited investors, as defined in the Financial Advisers Regulations and the Securities and Futures Act (Chapter 289), as amended from time to time.
In respect of any matter arising from or in connection with the research you could contact the following representatives of Motilal Oswal Capital Markets Singapore Pte Limited:
Anosh Koppikar
Kadambari Balachandran
Email : anosh.Koppikar@motilaloswal.com
Email : kadambari.balachandran@motilaloswal.com
Contact : (+65)68189232
Contact : (+65) 68189233 / 65249115
Office Address : 21 (Suite 31),16 Collyer Quay,Singapore 04931
For Singapore
Motilal Oswal Securities Ltd
29 April 2015
Motilal Oswal Tower, Level 9, Sayani Road, Prabhadevi, Mumbai 400 025
Phone: +91 22 3982 5500 E-mail: reports@motilaloswal.com
10