5 May 2015
4QFY15 Results Update | Sector:
Financials
Kotak Mahindra Bank
BSE SENSEX
27,440
Bloomberg
Equity Shares (m)
52-Week Range (INR)
1, 6, 12 Rel. Per (%)
Free float (%)
Financials & Valuation (INR b)
Y/E Mar
NII
OP
NP
NIM (%)
EPS (INR)
EPS Gr. (%)
Cons. BV.
( ) RoE
Cons.
( )
RoA (%)
Payout (%)
Valuations
P/E(X)
(
)
P/BV (X)
2016E 2017E 2018E
72.4
86.2 103.8
49.5
28.3
4.1
46.9
370.7
13.5
1.5
2.7
30.4
61.7
35.8
4.1
57.9
23.6
427.4
14.5
1.6
2.9
24.6
75.6
43.7
4.0
70.3
21.4
496.1
15.2
1.6
2.9
20.3
2.9
0.1
S&P CNX
8,325
KMB IN
911.6
1,474/785
8/29/54
60.0
CMP: INR1,424
TP: INR1,355 (-5%)
Neutral
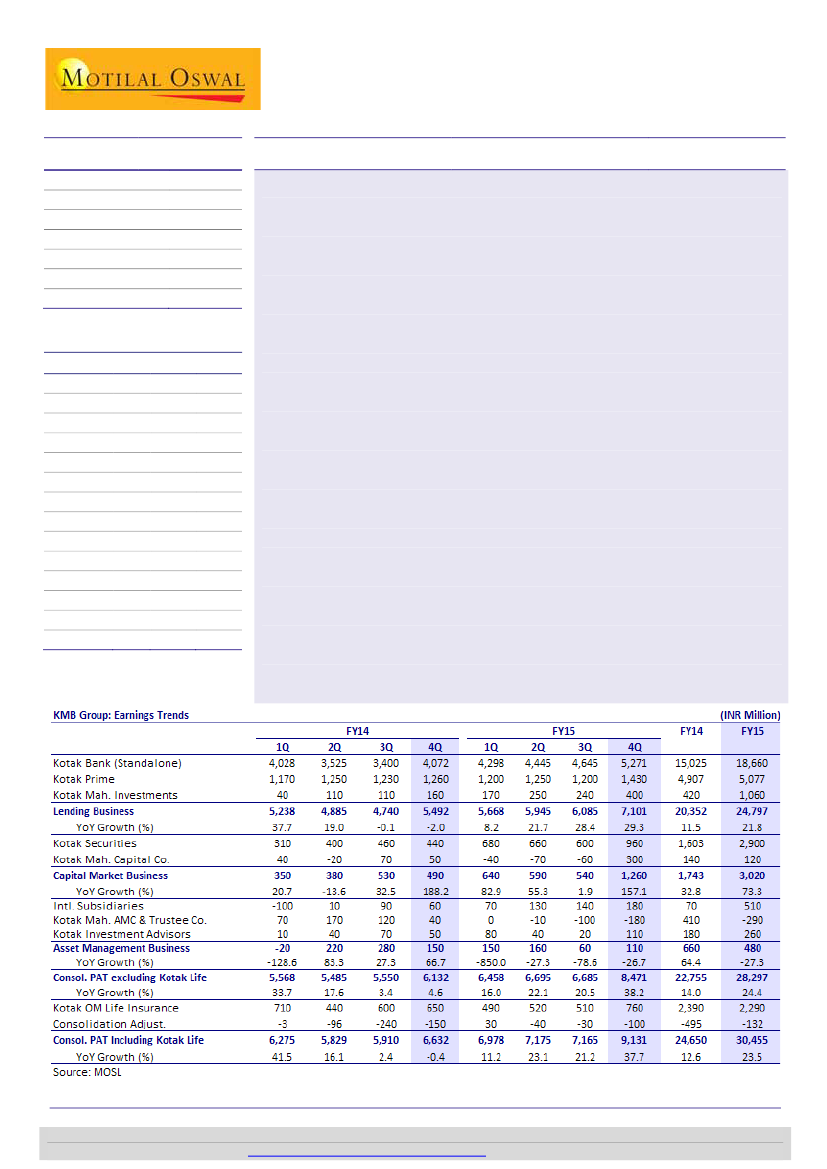
Strong beat on lending PAT; other verticals show improvement
KMB’s consolidated PAT for 4QFY15 beat our estimate by 18%, led by (a) strong fee
income (+41% YoY, +19% QoQ), (b) higher non-core income (INR2.8b v/s INR0.6b in
4QFY14), and (c) healthy asset quality (NSL stable QoQ at 1.2%) in banking business.
Capital market related business also reported strong beat (INR1.26b v/s our estimate
of INR0.7b) – its share in consolidated PAT rose to a 16-quarter high of 14%.
n
Banking business:
Standalone PAT grew 30% YoY (on a lower base) to INR5.3b
(11% beat). Total income grew 37% YoY, driven by healthy fees (+41% YoY) and
higher non-core income. KMB accounted for INR0.54b of integration-related
expenses, adjusted for which opex grew 25% YoY and PAT grew 39% YoY. Loan
growth (ex-CV) remains healthy at 28% YoY, driven by unsecured retail loans
(10% of loans, +35% YoY), mortgages (22% of loans, +22% YoY) and corporate
banking (31% of loans, +41% YoY). Share of retail deposits (CASA+TD less than
INR50m) grew 700bp YoY to 70%.
n
Other highlights:
(1) K-Sec’s market share improved 10bp QoQ to 2.9%, (2)
domestic AMC AUM increased 9% QoQ to INR395b, but reported a loss of
INR180m (higher distribution commission, in line with competition), (3) NIM
(consolidated) was flat YoY at 4.9%, and (4) the bank announced 1:1 bonus
shares and dividend of INR0.9/share.
Valuation and view:
Merger with VYSB places KMB in a sweet spot, with strong
presence across geographies and products, and continued healthy capitalization
(CET 1 of 16.5%). The merged entity will be India’s fourth-largest private sector bank,
with a loan book of INR1.3t and loan market share of 1.8%+. KMB’s premium
multiples are likely to sustain, considering the strong growth and operating leverage
available across businesses. While we are positive on the business, at 3.3x
consolidated BV and 25x EPS, upside is limited. Reiterate
Neutral;
our SOTP-based
TP is INR1,355 (pro-forma merged).
M.Cap. (INR b) / (USD b) 1,298.1/20.5
Avg Val(INR m)/Vol ‘000 1,474/1,324
3.8
3.3
(C
)
Div. Yield (%)
0.1
0.1
* Proforma merged (KMB+VYSB)
Investors are advised to refer through disclosures made at the end of the Research Report.
Alpesh Mehta
(Alpesh.Mehta@MotilalOswal.com); +91 22 3982 5415
Vallabh Kulkarni
(Vallabh.Kulkarni@MotilalOswal.com); +91 22 3982 5430
Motilal Oswal research is available on
www.motilaloswal.com/Institutional-Equities,
Bloomberg, Thomson Reuters, Factset and S&P Capital.

Kotak Mahindra Bank
Exhibit 1: KMB Actual vs expectation
KMB Group: Qtrly. Performance
Kotak Bank (Standalone)
Kotak Prime
Kotak Mah. Investments
Lending Business
YoY Growth (%)
Kotak Securities
Kotak Mah. Capital Co.
Capital Market Business
YoY Growth (%)
Intl. Subsidiaries
Kotak Mah. AMC & Trustee Co.
Kotak Investment Advisors
Asset Management Business
YoY Growth (%)
Consol. PAT excluding Kotak Life
YoY Growth (%)
Kotak OM Life Insurance
Consolidation Adjust.
Consol. PAT Including Kotak Life
YoY Growth (%)
4QFY15A
5,271
1,430
400
7,101
29.3
960
300
1,260
157.1
180
-180
110
110
-26.7
8,471
38.2
760
-100
9,131
37.7
4QFY15E
4,745
1,360
275
6,380
16.2
613
45
658
34.3
160
67
20
247
64.7
7,285
18.8
512
-35
7,762
17.0
v/s Est.
11
5
45
11
57
567
91
13
-369
450
-55
16
48
186
18
Strong growth continues
Beat led by banking and capital market related business
Source: MOSL, Company
Comments
Strong Non-interest income contribution
Stable asset quality, healthy growth and high non-core
income contribution drove beat
Income +30% QoQ; PAT margin up 630bp QoQ
First qtr of profits, post 3 quarters of loss
Share in cons. PAT at 14% vs average of 7% over FY13-15
Higher distribution related expenses
Lending Business: Strong growth and healthy asset quality performance
High fee growth, strong
trading income and
recoveries led to PAT beat
of 11% in banking business
n
n
n
Loan growth largely driven
by corporate banking,
mortgages and personal
loans
Dependence on bulk
deposits continues to
reduce; share of retail
deposits up 700bp YoY
to 70%
n
n
On the standalone basis NIM improved 17bp QoQ to 4.87%. The bank reported
strong trading gains (INR1.6b v/s INR120m/1.2b in 4QFY14/3QFY15) and
recoveries from written-off accounts (INR1.2b v/s INR460m last year and
quarter ago). Fee income was also healthy at INR3.9b (+41% YoY and +19% QoQ)
led by MF distribution and corporate fees
Reported operating expenses grew, +14% QoQ and +33% YoY, to INR9.3b;
however adjusted for integration expenses, Opex was in-line (+25% YoY).
In one of the most challenging quarter for financials KMB reported strong asset
quality performance with Net stress loans down 6bp QoQ to 116bp (one of the
lowest in the system).
Consolidated loan growth (ex-CV) was robust at 28% YoY driven by unsecured
retail loans (+35% YoY), mortgages (+22% YoY) and corporate banking (+41%
YoY). Led by seasonality agri loans grew 12% QoQ. Risk aversion in CV loans
continues (+3.5% QoQ and -4.4% YoY) and its share in overall loans declined to
5.9% vs 7.6% a year ago (stable QoQ)
SA deposits grew 14% QoQ and 39% YoY and new SA customer addition per
quarter remains healthy at 0.24m. SA deposits as a proportion of overall
deposits stood at 19% (17% a quarter ago). KMB further reduced its reliance on
CDs which formed 5% of overall deposits as compared to 7% in 9MFY15, 10% as
of FY14 and peak of 21.5% at end of 3QFY13.
Exhibit 2: Trend in lending business profitability – Strong growth however, contribution from capital mkt business improve
Total lending profits
QoQ Growth (%)
YoY Growth (%)
% Share to total profits
1QFY13 2QFY13 3QFY13 4QFY13 1QFY14 2QFY14 3QFY14 4QFY14 1QFY15 2QFY15 3QFY15 4QFY15
3,804
4,104
4,747
5,602
5,238 4,885 4,740 5,492 5,668 5,945 6,085 7,101
-5
8
16
18
-6
-7
-3
16
3
5
2
17
9
16
24
40
38
19
0
-2
8
22
28
29
85
80
80
87
83
82
77
81
82
82
85
77
Source: MOSL, Company
5 May 2015
2

Kotak Mahindra Bank
Exhibit 3: Kotak Mahindra Bank (Standalone) – Strong trading gains and recoveries drove profitability
Y/E March
Interest Income
Interest Expense
Net Interest Income
% Change (Y-o-Y)
Other Income
Net Income
% Change (Y-o-Y)
Operating Expenses
Operating Profit
% Change (Y-o-Y)
Other Provisions
Profit before Tax
Tax Provisions
Net Profit
% Change (Y-o-Y)
Loan growth (%)
Cost to Income Ratio (%)
Tax Rate (%)
1Q
21,900
12,734
9,167
27.1
4,624
13,791
43.3
6,003
7,788
73.7
1,689
6,099
2,071
4,028
42.6
19.4
43.5
34.0
FY14
2Q
3Q
21,723
21,923
12,482
12,796
9,241
9,127
21.9
10.9
2,971
2,997
12,212
12,125
21.0
7.5
6,147
6,277
6,065
5,847
25.8
2.1
723
697
5,343
5,150
1,817
1,750
3,525
3,400
25.7
-6.0
11.4
5.8
50.3
51.8
34.0
34.0
4Q
22,125
12,459
9,665
7.0
3,405
13,070
3.1
6,999
6,071
-7.1
-62
6,133
2,061
4,072
-6.7
9.4
53.6
33.6
1Q
22,864
12,842
10,022
9.3
3,998
14,020
1.7
7,364
6,655
-14.5
140
6,515
2,217
4,298
6.7
12.6
52.5
34.0
FY15
2Q
3Q
23,525
25,001
13,136
14,407
10,389
10,594
12.4
16.1
4,665
4,941
15,054
15,535
23.3
28.1
7,717
8,160
7,336
7,376
21.0
26.1
537
299
6,800
7,077
2,355
2,431
4,445
4,645
26.1
36.6
20.4
21.6
51.3
52.5
34.6
34.4
FY14
FY15
4Q
25,809
87,671
97,199
14,578
50,471
54,961
11,232
37,200
42,237
16.2
16.0
13.5
6,681
13,997
20,285
17,913
51,198
62,522
37.1
17.3
22.1
9,306
25,426
32,547
8,607
25,772
29,975
41.8
19.5
16.3
669
3,047
1,645
7,938
22,725
28,330
2,667
7,699
9,670
5,271
15,025
18,660
29.5
10.4
24.2
24.8
9.4
24.8
51.9
49.7
52.1
33.6
33.9
34.1
Source: MOSL, Company
Exhibit 4: Corporate loans key growth driver (INR m)
4QFY15
Comm. Vehicles
Car Loans (Prime)
PL/CC/SENP
Home loans
Corp Banking
Business Banking
Agri
Others
Total Loans
Inv. / Treasury Assets
52,040
146,910
62,980
147,090
245,460
64,220
121,060
46,560
886,320
336,720
4QFY14
54,410
132,230
46,670
120,990
173,190
53,880
104,680
30,870
716,920
277,880
YoY
%
-4
11
35
22
42
19
16
51
24
21
3QFY15
50,270
141,960
59,680
137,380
259,330
60,790
108,490
42,680
860,580
333,090
QoQ
%
4
3
6
7
-5
6
12
9
3
1
Exhibit 5: KMPL: Loan growth remains muted (+10% YoY)
Auto Loans (INR b)
Other Loans (INR b)
Source: MOSL, Company
Exhibit 6: Consolidated NIMs improve 20bp QoQ (Cum, %)
Exhibit 7: Asset quality (incl stressed assets) stable QoQ
GNPA (%)
NNPA (%)
Source: MOSL, Company
5 May 2015
3

Kotak Mahindra Bank
Weak quarter for most non-lending businesses
K-Sec market share
increased by 10bp to 2.9%
in 4QFY15
n
n
n
n
Capital market related business PAT was at INR1.3b (91% beat) driven by strong
profitability in the securities division. K-sec net profit increased 60% QoQ to
INR960m (+118% YoY) and its market share improved 10bp QoQ.
Asset management business reported loss of INR180m vs. loss of INR100m in
3QFY15 and profit of INR40m in 4QFY14. PAT of international subsidiaries
improved to INR180m (+200% YoY and +29% QoQ).
Overall AUM increased 13% QoQ to INR806b. Within which domestic AUM
increased 34% YoY. Domestic debt AUMs remained flat on QoQ and YoY basis.
Life insurance profit increased 17% YoY and 49% QoQ to INR 760m.
Exhibit 9: K-Sec market share increased 10bp QoQ (%)
33
2.7 2.9 2.9 2.9 2.5 2.5 2.6 2.5
2.2 2.4 2.3 2.3
2.9 2.7 2.8 2.9
Exhibit 8: K-Sec : Strong impr. In profitability (INR b)
Tot. Inc.
28
PAT
26 26
16
19 18
17
8
PATM (%)
30
29 27
27 28
26
21
Source: MOSL, Company
Exhibit 10: Investment Banking: Earnings trend (INR m)
Tot. Inc.
PAT
Exhibit 11: Kotak AMC: Strong improvement in equity AUM
Eq. AUM
PMS AUM
Offshore AUM
210
157
125
120
101
99 100 102
97
102
97
96
72 76 73 77 82
71
59
36 30 29 32
34 28 31 30 36 34 47
31 34
15 15 10 14 10 11 11 11 13
6 6 6 7 7 7 8
Source: MOSL, Company
5 May 2015
4

Kotak Mahindra Bank
Exhibit 12: Trend in segment wise profitability (INR m)
1QFY13 2QFY13 3QFY13 4QFY13 1QFY14 2QFY14 3QFY14
Total lending profits
3,804
4,104
4,747
5,602
5,238 4,885 4,740
QoQ Growth (%)
-5
8
16
18
-6
-7
-3
YoY Growth (%)
9
16
24
40
38
19
0
% Share to total profits
85
80
80
87
83
82
77
Capital market related business 290
440
400
170
350
380
530
QoQ Growth (%)
-47
52
-9
-58
106
9
39
YoY Growth (%)
21
76
43
-69
21
-14
33
% Share to total profits
6
9
7
3
6
6
9
AMC Businesses
70
120
220
90
-20
220
280
QoQ Growth (%)
-56
71
83
-59
-122
27
YoY Growth (%)
-59
50
267
-44
-129
83
27
% Share to total profits
2
2
4
1
0
4
5
Life Insurance business
320
470
530
580
710
440
600
QoQ Growth (%)
-44
47
13
9
22
-38
36
YoY Growth (%)
-30
-11
13
2
122
-6
13
% Share to total profits
7
9
9
9
11
7
10
Consolidated PAT
4,484
5,134
5,897
6,442
6,278 5,925 6,150
QoQ Growth (%)
-15
14
15
9
-3
-6
4
YoY Growth (%)
3
17
27
22
40
15
4
% Share to total profits
100
100
100
100
100
100
100
Total consolidated PAT ex Life 4,164
4,664
5,367
5,862
5,568 5,485 5,550
QoQ Growth (%)
-12
12
15
9
-5
-1
1
YoY Growth (%)
7
21
29
24
34
18
3
% Share to total profits
93
91
91
91
89
93
90
# ex-consolidated adjustments
4QFY14
5,492
16
-2
81
490
-8
188
7
150
-46
67
2
650
8
12
10
6,782
10
5
100
6,132
10
5
90
1QFY15
5,668
3
8
82
640
31
83
9
150
0
-850
2
490
-25
-31
7
6,948
2
11
100
6,458
5
16
93
2QFY15 3QFY15 4QFY15
5,945 6,085 7,101
5
2
17
22
28
29
82
85
77
590
540
1,260
-8
-8
133
55
2
157
8
8
14
160
60
110
7
-63
83
-27
-79
-27
2
1
1
520
510
760
6
-2
49
18
-15
17
7
7
8
7,215 7,195 9,231
4
0
28
22
17
36
100
100
100
6,695 6,685 8,471
4
0
27
22
20
38
93
93
92
Source: MOSL, Company
Conference Call Highlights
Status on integration of VYSB operations with KMB
n
n
n
n
n
n
n
n
All employees of VYSB have been absorbed in the merged entity.
Merger related accounting will be based on pooling of assets method. In case of
any difference in accounting policy (depreciation, NPA provisioning etc)
between both banks, it will be routed through reserves. Normal integration
related expenses (Cheque book change, stamp duty, marketing, change in
technology, ATM screen changes etc) will be routed through P&L
Taxation, compliance, treasury function integrated on day zero. Wholesale
banking integrated within 30days
Retail business integration is still going on. Technology (core banking), ATM,
Branches will take at least 6-9months for full integration. Inter operability for
customers started for some services and on an average daily basis KMB is seeing
180-200 transaction on an a daily basis
Higher savings deposits cost for VYSB customers will lead to INR1b of additional
expenses (~10bp rise in cost of deposits).
KMB will start reporting merged entity numbers from 1QFY16
VYSB loan quality is largely on the expected lines and management has not
witnessed major negative surprises post merger
Total cost of integration (technology, stamp duty etc) is expected to be INR2-
2.25b (INR0.54b already expensed in 4Q and 1.5-1.75b expected in FY16). Large
part of the integration cost is expected to hit in 1HFY16
5 May 2015
5

Kotak Mahindra Bank
Other highlights
n
n
n
n
n
n
KMB remains risk averse on CV & CE business. Management is seeing some
improvement in HCV segment however, LCV remains an issue.
Corporate lending is driven by A and above rated corporate. While spreads are
lower, customer profitability is high led by fee income business. Growth is
coming largely from working capital short term loans and lesser duration term
loans
Loan against property : SME kind of customer profile – also backed by cash
flows; LAP: HL at 50:50; ING at 60:40
Strong fee income growth driven by MF distribution (to some extend one off),
DCM and debt syndication, Trade and forex related advisory, wholesale LC and
BG and Retail regular business. Over next five years expect fees growth to
outpace loan growth
Daily average CA growth stood at 28-30% YoY in FY15. Weighted average SA cost
declined from 5.47% in 3Q to 5.43% in 4Q
Guidance on key parameters a) 20% loan growth for FY16 b) KMB standalone
credit cost of 30-40bp vs 40bp in FY15
Valuation and view
n
Excess capitalisation is
leading to (tier-I ratio of
17%) relatively lower RoE of
~15% over FY16/18
n
n
n
Our SOTP-based target
price is INR1,355 (based on
pro-forma merger with
VYSB)
n
Merger with VYSB places KMB in a sweet spot with strong presence across
geographies, products and healthy capitalization (CET 1 of 16.5%). The merged
entity will be the fourth largest private sector bank with a loan book of INR1.3t
and market share of 1.8%+ of loans. Further, KMB’s conglomerate structure
places it in a very sweet position to ride the up-cycle across financial services.
Improvement in macro-economic environment coupled with strong Tier I of
~17% places KMB in a strong position to lever of growth opportunities in the
economy. To leverage on its geographical expansion, the management is
focusing on product penetration, with higher emphasis on Agriculture (will help
in priority sector loans), small business loans (untapped opportunity; creating
niche for itself) and mortgage loan. CV loans are bottoming out and likely to
show traction in ensuing quarters. We factor loan CAGR (incl VYSB) of 22% over
FY15/18 and PAT CAGR of ~21%.
Asset quality for KMB remains one of the best with net stress loans at 115bp.
With (1) management expectation of worst in CV/CE segment behind, (2) other
retail products showing better than factored in loss given default (LGD) and (3)
lower share of term/project loans in the corporate segment, we expect KMB to
continue best-in-class asset quality performance in ensuing quarters.
Post merger with VYSB, share of lending business in overall profitability is likely
to increase to 85% vs 81%. Improvement in capital market related business
profitability is encouraging. Capital light nature of these businesses can provide
upside to ROE if there is a strong improvement in business cycle.
Our SOTP is INR1,355
(based on pro-forma merger with VYSB) – 3.1xFY17E cons.
BV/EPS.
Backed by higher capitalization, diversified business loan book, strong
risk management and presence across financial services KMB historically traded
at a premium multiples (2.8x/19.3x Cons. BV/EPS) to peers despite relatively
lower ROE. While we are positive on the business, valuations at 3.1x/25x Cons
BV/EPS (pro-forma merged basis) limit the upside. Maintain
Neutral.
6
5 May 2015

Kotak Mahindra Bank
Exhibit 13: Kotak Mahindra: SOTP Valuation (FY17-based)
Value
(INR B)
1,093
960
114
19
54
30
10
14
67
65
2
20
1,234
1,299
-5.0
Value (USD
B)
17.3
15.2
1.8
0.3
0.8
0.5
0.2
0.2
1.1
1.0
0.0
0.3
19.6
20.6
INR per
share
1,199
1,053
125
21
59
33
15
11
74
71
3
22
1,354
1,425
-5.0
Source: MOSL, Company
% To Total Rationale
89
78
9
2
4
2
1
1
5
5
0
2
100
15x FY17E Earnings; Implied 2.2x Core BV
1x FY17E Free Networth
16x FY17E NBAP, APE CAGR of ~15% in FY15-18
Implied 3.1x PBV; ROE of ~15%
5% of FY17E Avg. AUM of INR600b
12% of FY17E AUM of INR81b
5% of FY17E AUM of INR277b
3.5x FY17E Core NW, ~1.6% RoA and ~15% Core RoE
2.5x FY17E Net Worth, ~20% Core RoE
1.5x FY17E Net Worth
Lending Business
Kotak Mahindra Bank
Kotak Prime (Car and other loans)
Kotak Investment Company (LAS)
Asset Management Business
Domestic Mutual Fund
Alternative Assets
Offshore Funds
Capital Markets related Business
Kotak Securities
Kotak Investment Banking (KMCC)
Kotak Life Insurance
Target Value
Current market cap.
Upside (%)
5 May 2015
7

Kotak Mahindra Bank
Exhibit 14: KMB – Consolidated earnings trend (Pre Merger)
Kotak Mahindra Bank (Standalone)
Kotak Mahindra Prime
Kotak Mahindra Investments
Lending Business
International subsidiaries
Kotak Mahindra AMC & Trustee Co
Kotak Investment Advisors
Asset Management Business
Kotak Securities
Kotak Mahindra Capital Company
Capital Market Business
Consol. PAT excluding Kotak Life
YoY Growth (%)
Kotak OM Life Insurance
Consolidation Adjust.
Consol. PAT Including Kotak Life
YoY Growth (%)
Business
Banking Business
Auto loans, debt capital markets
Primarily LAS
Asset management and inv. banking
Mutual funds management
Alternate asset management
Broking and distribution
Investment banking
FY08
2,939
1,006
426
4,372
645
79
135
859
4,087
1,153
5,240
10,470
FY09
2,761
1,570
137
4,468
243
161
480
885
1,065
128
1,193
6,546
-37
-719
143
161 -165
9,912 6,524
-34
FY10
5,611
1,664
347
7,622
799
725
398
1,921
2,601
239
2,840
12,382
89
692
-4
13,070
100
FY11
8,182
3,179
240
11,600
509
173
327
1,009
1,819
519
2,338
14,948
21
1,014
-294
15,667
20
FY12
10,851
3,849
153
14,852
-110
154
361
405
1,258
59
1,318
16,574
11
2,030
-282
18,322
17
FY13 FY14 FY15
13,607 15,025 18,660
4,307 4,907 5,077
336
420 1,060
18,250 20,352 24,797
60
70
510
35
410 -290
307
180
260
401
660
480
1,145 1,603 2,900
167
140
120
1,312 1,743 3,020
19,964 22,755 28,297
20
14
24
1,900 2,390 2,290
21 -495 -132
21,885 24,650 30,455
19
13
24
Source: MOSL, Company
Life insurance
Exhibit 15: KMB – Consolidated – Lending businesses dominate profitability (Pre Merger)
Kotak Mahindra Bank (Standalone)
Kotak Mahindra Prime
Kotak Mahindra Investments
Lending Business
International subsidiaries
Kotak Mahindra AMC & Trustee Co
Kotak Investment Advisors
Asset Management Business
Kotak Securities
Kotak Mahindra Capital Company
Capital Market Business
Consol. PAT excluding Kotak Life
Kotak OM Life Insurance
Consol. PAT Including Kotak Life
Business
Banking Business
Auto loans, debt capital markets
Primarily LAS
Asset management and inv. banking
Mutual funds management
Alternate asset management
Broking and distribution
Investment banking
FY08
30
10
4
44
7
1
1
9
41
12
53
106
-7
100
FY09
42
24
2
68
4
2
7
14
16
2
18
100
2
100
FY10
43
13
3
58
6
6
3
15
20
2
22
95
5
100
FY11
52
20
2
74
3
1
2
6
12
3
15
95
6
100
FY12
59
21
1
81
-1
1
2
2
7
0
7
90
11
100
FY13
62
FY14
61
FY15
61
Life insurance
20
20
17
2
2
3
83
83
81
0
0
2
0
2
-1
1
1
1
2
3
2
5
7
10
1
1
0
6
7
10
91
92
93
9
10
8
100
100
100
Source: MOSL, Company
5 May 2015
8

Kotak Mahindra Bank
Exhibit 16: KMB – Consolidated (Proforma merged with VYSB) - INR Million
KMB+VYSB
Kotak Mahindra Prime
Kotak Mahindra Investments
Lending Business
International subsidiaries
Kotak Mahindra AMC & Trustee Co
Kotak Investment Advisors
Asset Management Business
Kotak Securities
Kotak Mahindra Capital Company
Capital Market Business
Consol. PAT excluding Kotak Life
YoY Growth (%)
Kotak OM Life Insurance
Consolidation Adjust.
Consol. PAT Including Kotak Life
YoY Growth (%)
FY11
11,367
3,179
240
14,786
Asset management and inv. banking
509
Mutual funds management
173
Alternate asset management
327
1,009
Broking and distribution
1,819
Investment banking
519
2,338
18,133
22
Life insurance
1,014
-294
18,853
23
Business
Banking Business
Auto loans, debt capital markets
Primarily LAS
FY12
15,414
3,849
153
19,415
-110
154
361
405
1,258
59
1,318
21,137
17
2,030
-282
22,885
21
FY13
19,737
4,307
336
24,380
60
35
307
401
1,145
167
1,312
26,093
23
1,900
21
28,014
22
FY14
21,603
4,907
420
26,930
70
410
180
660
1,603
140
1,743
29,333
12
2,390
-495
31,228
11
FY15E FY16E FY17E FY18E
24,776 28,284 35,820 43,665
5,077 5,766 6,795 8,494
1,060 1,453 1,759 2,199
30,914 35,503 44,374 54,358
510
535
560
585
-290
289
346
416
260
310
360
410
480 1,134 1,266 1,411
2,900 3,534 4,331 5,197
120
161
185
213
3,020 3,695 4,516 5,410
34,413 40,331 50,157 61,179
17
17
24
22
2,290 2,519 2,771 3,048
-132 -125 -125 -125
36,571 42,725 52,803 64,102
17
17
24
21
Source: MOSL, Company
Exhibit 17: KMB – Consolidated (Proforma merged with VYSB) - INR Million
KMB+VYSB
Kotak Mahindra Prime
Kotak Mahindra Investments
Lending Business
International subsidiaries
Kotak Mahindra AMC & Trustee Co
Kotak Investment Advisors
Asset Management Business
Kotak Securities
Kotak Mahindra Capital Company
Capital Market Business
Consol. PAT excluding Kotak Life
Kotak OM Life Insurance
Consol. PAT Including Kotak Life
Business
Banking Business
Auto loans, debt capital markets
Primarily LAS
Asset management and inv. banking
Mutual funds management
Alternate asset management
Broking and distribution
Investment banking
FY11
60
17
1
78
3
1
2
5
10
3
12
96
5
100
FY12
67
17
1
85
0
1
2
2
5
0
6
92
9
100
FY13
70
15
1
87
0
0
1
1
4
1
5
93
7
100
FY14 FY15E FY16E FY17E FY18E
69
68
66
68
68
16
1
86
0
1
1
2
5
0
6
94
8
100
14
13
13
13
3
3
3
3
85
83
84
85
1
1
1
1
-1
1
1
1
1
1
1
1
1
3
2
2
8
8
8
8
0
0
0
0
8
9
9
8
94
94
95
95
6
6
5
5
100
100
100
100
Source: MOSL, Company
Life insurance
5 May 2015
9

Kotak Mahindra Bank
Exhibit 18: Financials:
Valuation metrics
62.34
Rating
ICICIBC*
Buy
HDFCB
Buy
AXSB
Buy
KMB*
Neutral
YES
Buy
IIB
Buy
DCBB
Buy
FB
Buy
JKBK
Neutral
SIB
Buy
Private Aggregate
SBIN (cons)*
Buy
PNB
Buy
BOI
Neutral
BOB
Neutral
UNBK
Buy
INBK
Buy
CRPBK
Neutral
ANDB
Buy
IDBI
Neutral
DBNK
Neutral
Public Aggregate
HDFC*
Buy
LICHF
Buy
DEWH
Buy
IHFL
Buy
IDFC
Buy
RECL
Buy
POWF
Buy
SHTF
Buy
MMFS
Buy
BAF
Buy
NBFC Aggregate
CMP
(INR)
328
987
566
1,424
857
836
122
135
97
24
272
166
223
170
145
144
57
78
75
50
1,180
441
446
589
167
318
277
848
271
4,280
Mcap
(USDb)
30.5
39.7
21.5
17.6
5.7
7.1
0.6
1.9
0.8
0.5
125.9
32.6
4.8
2.3
1.2
1.5
1.1
0.2
0.8
1.9
0.4
46.7
29.8
3.6
1.0
3.5
4.3
5.0
5.9
3.1
2.5
3.4
61.0
EPS (INR)
FY16
22.9
51.2
37.2
49.2
60.9
43.2
7.3
12.6
13.6
3.7
29.0
26.8
50.3
24.1
36.6
28.7
16.5
20.6
14.4
9.7
37
33
53
63
13
66
55
73
17
219
FY17
27.4
64.0
43.2
60.4
76.4
54.6
9.5
15.1
18.1
4.7
36.2
36.2
64.3
30.8
47.1
33.5
21.9
25.5
19.7
13.6
44
39
65
77
14
75
63
84
20
267
P/E (x)
FY16
11.5
19.3
15.2
28.9
14.1
19.3
16.8
10.7
7.2
6.4
17.6
9.0
6.2
4.4
7.1
4.0
5.0
3.5
3.8
5.2
5.1
7.5
19.8
13.4
8.4
9.4
13.2
4.8
5.0
11.6
15.7
19.5
14.3
FY17
9.2
15.4
13.1
23.6
11.2
15.3
12.8
8.9
5.4
5.0
14.4
7.2
4.6
3.5
5.5
3.1
4.3
2.6
3.1
3.8
3.7
5.9
14.8
11.3
6.9
7.7
11.6
4.2
4.4
10.1
13.2
16.1
12.4
BV (INR)
FY16
131
287
218
371
332
227
63
100
137
29
231
231
455
184
320
287
141
170
157
130
169
198
373
213
109
300
288
467
113
1,137
FY17
151
336
254
427
393
274
72
112
151
33
260
263
511
208
359
313
158
188
173
141
194
229
423
245
120
358
334
533
128
1,360
P/BV (x)
FY16
2.00
3.44
2.59
3.84
2.58
3.68
1.94
1.35
0.71
0.81
2.83
1.13
0.72
0.49
0.92
0.45
0.50
0.41
0.46
0.48
0.39
0.82
4.37
2.23
1.20
2.76
1.27
1.06
0.96
1.81
2.40
3.76
2.61
FY17
1.68
2.94
2.23
3.33
2.18
3.05
1.69
1.21
0.65
0.72
2.46
0.99
0.63
0.44
0.82
0.40
0.46
0.36
0.42
0.43
0.36
0.74
3.38
1.92
1.05
2.40
1.14
0.89
0.83
1.59
2.12
3.15
2.28
RoA (%)
FY16
1.72
1.97
1.75
1.86
1.68
1.90
1.12
1.19
0.81
0.78
0.77
0.77
0.46
0.70
0.57
0.63
0.54
0.62
0.58
0.36
2.52
1.43
1.28
3.90
2.20
3.50
3.18
2.27
2.62
2.94
FY17
1.78
2.02
1.69
1.86
1.70
1.97
1.17
1.19
0.95
0.86
0.84
0.91
0.49
0.78
0.64
0.63
0.64
0.66
0.69
0.44
2.55
1.42
1.27
3.87
2.19
3.36
3.11
2.56
2.72
2.88
RoE (%)
FY16
16.3
19.2
18.2
14.6
19.9
20.7
12.3
13.3
10.4
13.3
12.8
12.2
11.6
13.7
12.0
10.4
12.3
12.2
9.5
7.7
23.5
17.8
15.4
31.9
11.5
24.2
20.6
15.3
16.1
21.0
FY17
17.2
20.6
18.2
15.2
21.1
21.8
14.1
14.3
12.6
15.2
14.5
14.6
13.3
15.7
13.9
11.2
14.7
14.2
11.9
10.0
23.6
18.3
16.4
33.5
12.0
22.8
20.1
16.9
17.0
21.4
*Multiples adj. for value of key ventures/Investments; For ICICI Bank and HDFC Ltd BV is adjusted for investments in subsidiaries
5 May 2015
10

Kotak Mahindra Bank
Financials and valuations (KMB Pre merger)
Income Statement (Standalone)
Y/E March
2008
Interest Income
25,354
Interest Expense
13,096
Net Interest Income
12,258
Change (%)
97.8
Non Interest Income
4,635
Net Income
16,893
Change (%)
80.0
Operating Expenses
10,194
Pre Provision Profits
6,699
Change (%)
105.6
Provisions (excl tax)
2,721
PBT
3,978
Tax
1,038
Tax Rate (%)
26.1
Standalone PAT
2,939
Change (%)
107.9
Consolidated PAT
9,912
Change (%)
89.2
Equity Dividend (Incl tax)
335
Core PPP (Standlone)*
4,913
Change (%)
61.0
*Core PPP is (NII+Fee income-Opex)
2009
30,651
15,466
15,185
23.9
2,736
17,922
6.1
11,964
5,958
-11.1
1,697
4,261
1,500
35.2
2,761
-6.1
6,524
-34.2
278
5,650
15.0
2010
32,556
13,975
18,581
22.4
6,282
24,864
38.7
11,894
12,970
117.7
4,859
8,111
2,500
30.8
5,611
103.2
13,070
100.3
297
10,375
83.6
2011
41,898
20,922
20,976
12.9
7,805
28,781
15.8
15,533
13,248
2.1
1,371
11,877
3,695
31.1
8,182
45.8
15,667
19.9
462
11,083
6.8
2012
61,802
36,677
25,125
19.8
9,773
34,898
21.3
18,348
16,550
24.9
551
15,999
5,149
32.2
10,851
32.6
18,322
16.9
536
14,445
30.3
2013
80,425
48,368
32,057
27.6
11,607
43,663
25.1
22,097
21,566
30.3
1,846
19,721
6,113
31.0
13,607
25.4
21,885
19.4
597
19,194
32.9
2014
87,671
50,471
37,200
16.0
13,997
51,198
17.3
25,426
25,772
19.5
3,047
22,725
7,699
33.9
15,025
10.4
24,650
12.6
721
23,699
23.5
2015
97,199
54,961
42,237
13.5
20,285
62,522
22.1
32,547
29,975
16.3
1,645
28,330
9,670
34.1
18,660
24.2
30,455
23.5
820
26,475
11.7
Balance Sheet
(Standalone)
Y/E March
Equity Share Capital
Reserves & Surplus
Net Worth
Deposits
Change (%)
of which CASA Dep
Change (%)
Borrowings
Other Liabilities & Prov.
Total Liabilities
Current Assets
Investments
Change (%)
Loans
Change (%)
Fixed Assets
Other Assets
Total Assets
2008
3,447
31,908
35,355
164,236
49.3
46,699
55.9
59,015
24,517
283,124
21,495
91,420
33.2
155,522
42.4
2,102
12,584
283,124
2009
3,457
34,679
38,136
156,440
-4.7
51,181
9.6
67,340
25,202
287,119
11,407
91,102
-0.3
166,253
6.9
2,134
16,223
287,119
2010
3,481
41,370
44,851
238,865
52.7
74,631
45.8
61,405
29,242
374,363
23,003
125,127
37.3
207,751
25.0
4,276
14,207
374,363
2011
3,684
64,280
67,965
292,610
22.5
87,905
17.8
117,239
30,693
508,507
24,710
171,214
36.8
293,293
41.2
4,256
15,033
508,507
2012
3,703
75,756
79,459
385,365
31.7
124,024
41.1
165,955
25,888
656,668
26,346
215,668
26.0
390,792
33.2
4,500
19,362
656,668
2013
3,733
90,737
94,470
510,288
32.4
149,183
20.3
204,106
28,073
836,937
36,892
288,734
33.9
484,690
24.0
4,644
21,977
836,937
2014
3,852
118,899
122,751
590,723
15.8
188,279
26.2
128,956
33,424
875,853
59,799
254,845
-11.7
530,276
9.4
11,069
19,863
875,853
2015
3,862
137,549
141,411
748,603
26.7
272,170
44.6
121,497
48,610
1,060,121
62,624
304,211
19.4
661,607
24.8
12,067
19,612
1,060,121
Asset Quality (Standalone) (Excl. acquired NPA)
GNPA (INR m)
NNPA (INR m)
GNPA Ratio
NNPA Ratio
PCR (Incl acquired NPA)
PCR (Excl acquired NPA)
E: MOSL Estimates
1,500
573
0.96
0.37
39.0
61.8
4,475
2,055
2.65
1.24
42.4
54.1
4,983
2,572
2.37
1.24
53.1
48.4
3,618
1,461
1.22
0.50
65.0
59.6
4,778
2,243
1.21
0.57
61.4
53.0
6,321
3,036
1.30
0.63
58.9
52.0
9,334
5,736
1.75
1.08
45.9
38.6
11,212
6,091
1.68
0.92
50.8
45.7
5 May 2015
11

Kotak Mahindra Bank
Financials and valuations (KMB Pre merger)
Ratios (Standalone)
Y/E March
Spreads Analysis (%)
Avg. Yield-Earning Assets
Avg. Yield on loans
Avg. Yield on Investments
Avg. Cost-Int. Bear. Liab.
Avg. Cost of Deposits
Interest Spread
Net Interest Margin
Profitability Ratios (%)
Consolidated RoE
Standalone Core RoE
Standalone RoA
Int. Expense/Int.Income
Non Int. Inc./Net Income
Asset-Liability Profile (%)
Loans/Deposit Ratio
Loans/(Deposits+Borrowings)
CASA Ratio
Investment/Deposit Ratio
Invest/(Deposits+Borrowings)
CAR
Tier 1
2008
11.1
13.6
8.9
6.7
7.0
4.4
5.4
2009
11.7
15.5
6.1
6.9
6.8
4.7
5.8
2010
11.0
13.5
6.7
5.3
5.0
5.6
6.3
2011
10.4
12.8
6.5
5.9
5.6
4.5
5.2
2012
11.4
14.2
6.8
7.6
7.4
3.8
4.6
2013
11.5
14.0
7.4
7.6
7.5
3.8
4.6
2014
10.9
13.2
7.5
7.0
6.9
3.9
4.6
2015
10.8
12.5
7.9
6.9
6.6
3.9
4.7
21.9
12.7
1.2
51.7
27.4
10.6
8.2
1.0
50.5
15.3
18.1
14.6
1.7
42.9
25.3
16.6
15.4
1.9
49.9
27.1
15.4
15.4
1.9
59.3
28.0
15.5
16.3
1.8
60.1
26.6
14.4
14.4
1.8
57.6
27.3
14.8
14.6
1.9
56.5
32.4
94.7
69.7
28.4
55.7
40.9
106.3
74.3
32.7
58.2
40.7
20.0
16.1
87.0
69.2
31.2
52.4
41.7
18.3
15.4
100.2
71.6
30.0
58.5
41.8
19.9
18.0
101.4
70.9
32.2
56.0
39.1
17.5
15.7
95.0
67.8
29.2
56.6
40.4
16.0
14.7
89.8
73.7
31.9
43.1
35.4
19.0
17.9
88.4
76.0
36.4
40.6
35.0
19.0
17.9
Valuation
Book Value (INR)
51.3
55.2
7.6
94.3
11.7
48.6
92.3
3.7
-6.9
9.4
-34.4
0.4
64.4
16.8
113.6
20.4
57.5
111.0
7.7
105.8
18.8
98.9
0.4
92.2
43.2
148.8
30.9
86.5
147.4
10.5
36.4
21.3
13.3
0.5
107.3
16.3
174.2
17.1
100.9
172.1
14.2
35.3
24.7
16.3
0.6
0.0
126.5
17.9
204.3
17.3
118.7
201.4
17.7
25.0
29.3
18.5
0.7
0.1
159.4
25.9
247.6
21.2
148.6
242.4
18.8
6.3
32.0
9.2
0.8
0.1
183.1
14.9
286.8
15.8
172.0
281.3
23.3
24.0
39.4
23.2
0.9
0.1
BV Growth (%)
104.8
Consol BV (INR)
84.5
BV Growth (%)
70.5
Adjusted BV (INR)*
46.3
Adjusted Consol BV
83.9
Standalone EPS (INR)
4.0
EPS Growth (%)
92.9
Consol EPS (INR)
14.4
Con. EPS Growth (%)
79.1
Dividend Per Share (INR)
0.4
Dividend Yield (%)
E: MOSL Estimates; * For Investments in Subs and NPA,
5 May 2015
12

Kotak Mahindra Bank
Financials and valuations (KMB+VYSB - Proforma-merged)
Income Statement
Y/E March
Interest Income
Interest Expense
Net Interest Income
Change (%)
Non Interest Income
Net Income
Change (%)
Operating Expenses
Pre Provision Profits
Change (%)
Provisions (excl tax)
PBT
Tax
Tax Rate (%)
PAT
Change (%)
Consolidated PAT (incl VYSB)
Change (%)
2011
68,838
37,798
31,040
15.5
14,355
45,395
15.3
25,793
19,602
1.1
2,887
16,715
5,347
32.0
11,367
41.5
18,853
23.3
2012
100,370
63,162
37,208
19.9
16,471
53,679
18.2
29,450
24,229
23.6
1,688
22,541
7,127
31.6
15,414
35.6
22,885
21.4
2013
129,041
81,598
47,443
27.5
18,875
66,318
23.5
34,825
31,493
30.0
2,758
28,735
8,998
31.3
19,737
28.0
28,014
22.4
2014
139,722
84,991
54,731
15.4
22,668
77,399
16.7
40,353
37,046
17.6
4,545
32,501
10,898
33.5
21,603
9.5
31,228
11.5
2015
155,677
93,876
61,800
12.9
29,119
90,919
17.5
48,711
42,208
13.9
4,723
37,486
12,710
33.9
24,776
14.7
36,571
17.1
2016E
180,807
108,373
72,435
17.2
35,628
108,063
18.9
58,603
49,460
17.2
6,928
42,532
14,248
33.5
28,284
14.2
42,725
16.8
2017E
212,441
126,199
86,242
19.1
43,160
129,402
19.7
67,671
61,732
24.8
7,867
53,865
18,045
33.5
35,820
26.6
52,803
23.6
(INR Million)
2018E
254,527
150,717
103,810
20.4
52,319
156,129
20.7
80,553
75,577
22.4
9,914
65,662
21,997
33.5
43,665
21.9
64,102
21.4
Balance Sheet
Y/E March
Net Worth
Deposits
Change (%)
of which CASA Dep
Change (%)
Borrowings
Other Liabilities & Prov.
Total Liabilities
Current Assets
Investments
Change (%)
Loans
Change (%)
Fixed Assets
Other Assets
Total Assets
2011
94,577
594,552
19.5
192,491
21.1
158,709
50,809
898,646
49,924
281,797
22.6
529,314
34.7
9,284
28,326
898,646
2012
119,606
737,319
24.0
244,498
27.0
222,920
46,828
1,126,673
58,651
342,823
21.7
678,159
28.1
9,508
37,532
1,126,673
2013
140,913
923,628
25.3
283,534
16.0
269,219
51,542
1,385,301
65,226
471,517
37.5
802,410
18.3
9,640
36,508
1,385,301
2014
193,550
1,002,891
8.6
325,865
14.9
225,641
57,905
1,479,986
118,060
422,053
-10.5
888,565
10.7
16,315
34,994
1,479,986
2015
217,024
1,226,718
22.3
428,025
31.4
216,838
75,693
1,736,272
96,660
501,516
18.8
1,084,388
22.0
17,453
36,255
1,736,272
2016E
244,319
1,472,061
20.0
556,432
30.0
249,364
89,317
2,055,061
101,525
591,789
18.0
1,301,265
20.0
17,701
42,781
2,055,061
2017E
278,887
1,795,915
22.0
695,540
25.0
294,249
105,395
2,474,445
120,160
698,311
18.0
1,587,543
22.0
17,950
50,482
2,474,445
(INR Million)
2018E
321,026
2,226,934
24.0
869,425
25.0
338,387
126,474
3,012,820
142,493
824,007
18.0
1,968,554
24.0
18,198
59,569
3,012,820
Asset Quality
GNPA (INR m)
NNPA (INR m)
GNPA Ratio
NNPA Ratio
PCR (Excl Tech. write off)
E: MOSL Estimates
11,567
3,029
2.15
0.57
73.8
11,771
2,899
1.71
0.43
75.4
13,283
3,205
1.63
0.40
75.9
17,037
6,756
1.90
0.76
60.3
22,415
10,392
2.04
0.96
53.6
25,883
9,059
1.96
0.70
65.0
28,543
9,990
1.78
0.63
65.0
(%)
33,001
11,550
1.66
0.59
65.0
5 May 2015
13

Kotak Mahindra Bank
Financials and valuations (KMB+VYSB - Proforma-merged)
Ratios
Y/E March
Spreads Analysis (%)
Avg. Yield-Earning Assets
Avg. Yield on loans
Avg. Yield on Investments
Avg. Cost-Int. Bear. Liab.
Avg. Cost of Deposits
Interest Spread
Net Interest Margin
Profitability Ratios (%)
RoE
RoA
Consolidated ROE
Other Ratios (%)
Int. Expense/Int.Income
Non Int. Inc./Net Income
Cost/Income
Empl. Cost/Op. Exps.
Loans/Deposit Ratio
CASA Ratio
Investment/Deposit Ratio
2011
9.5
11.4
6.3
5.6
5.2
3.9
4.3
2012
10.8
12.8
7.3
7.4
7.0
3.4
4.0
2013
11.0
13.1
7.8
7.6
7.1
3.5
4.1
2014
10.5
12.4
7.7
7.0
6.8
3.5
4.1
2015
10.4
12.0
8.0
7.0
6.7
3.4
4.1
2016E
10.2
11.7
7.5
6.8
6.4
3.4
4.1
2017E
10.0
11.4
7.3
6.6
6.2
3.4
4.1
2018E
9.9
11.3
7.0
6.5
6.0
3.4
4.0
14.1
1.4
16.0
14.5
1.5
15.1
15.3
1.6
15.3
13.0
1.5
13.6
12.1
1.5
13.1
12.3
1.5
13.5
13.7
1.6
14.5
14.6
1.6
15.2
54.9
31.6
56.8
53.9
89.0
32.4
47.4
62.9
30.7
54.9
51.7
92.0
33.2
46.5
63.2
28.5
52.5
52.4
86.9
30.7
51.1
60.8
29.3
52.1
51.4
88.6
32.5
42.1
60.3
32.0
53.6
48.9
88.4
34.9
40.9
59.9
33.0
54.2
47.1
88.4
37.8
40.2
59.4
33.4
52.3
48.2
88.4
38.7
38.9
59.2
33.5
51.6
47.8
88.4
39.0
37.0
Valuation
Standalone Book Value (INR)
Change (%)
Consolidated BV (INR)
Change (%)
Price-BV (x)
Consolidated EPS (INR)
Change (%)
Price-Earnings (x)
Dividend Per Share (INR)
Dividend Yield (%)
E: MOSL Estimates
266.9
370.7
3.8
46.9
30.4
0.9
0.1
304.8
14.2
427.4
15.3
3.3
57.9
23.6
24.6
1.2
0.1
351.1
15.2
496.1
16.1
2.9
70.3
21.4
20.3
1.4
0.1
5 May 2015
14

Kotak Mahindra Bank
Corporate profile: Kotak Mahindra Bank
Company description
Kotak Mahindra Bank (KMB) is part of the larger
Kotak Mahindra Group led by Mr. Uday Kotak,
Founder and Managing Director of the Bank. The
group has a strong presence across financial
services value chain. Notably, KMB is the only bank
in India’s corporate history to be converted into a
bank from a non-banking finance company. The
bank has pan-India presence with 661 branches
across 371 locations and 1,195 ATMs as on
December 31, 2014. Recently, KMB announced
merger with VYSB in an all-stock deal, subject to
necessary approvals.
Exhibit 20: Shareholding pattern (%)
Mar-15
Promoter
DII
FII
Others
40.0
1.9
37.0
21.1
Dec-14
40.1
2.0
35.4
22.5
Mar-14
43.6
1.9
31.8
22.7
Exhibit 19: Sensex rebased
Exhibit 21: Top holders
Holder Name
Europacific Growth Fund
Canada Pension Plan Investment Board - Managed
Sumitomo Mitsui Banking Corporation
Natl Westminster Bank Plc As Depositary Of First
Caladium Investment Pte Ltd
% Holding
4.9
4.6
4.3
2.4
2.0
Note: FII Includes depository receipts
Exhibit 22: Top management
Name
Uday Kotak
C Jayaram
Dipak Gupta
Jaimin Bhatt
Shanti Ekambaram
Designation
Executive Vice Chairman & MD
Joint Managing Director
CFO
CPresident Corporate and IB
Exhibit 23: Directors
Name
Shankar Acharya*
C Jayaram
Dipak Gupta
Asim Ghosh*
Amit Desai*
Name
Prakash Apte*
N P Sarda
Uday Kotak
S Mahendra Dev*
Farida Khambata
*Independent
Exhibit 24: Auditors
Name
S B Billimoria & Co
Type
Statutory
Exhibit 25: MOSL forecast v/s consensus
EPS
(INR)
FY16
FY17
MOSL
forecast
46.9
57.9
Consensus
forecast
49.2
61.6
Variation
(%)
-4.6
-6.1
5 May 2015
15

Disclosures
This document has been prepared by Motilal Oswal Securities Limited (hereinafter referred to as Most) to provide information about the company(ies) and/sector(s), if any, covered in the report and may be
Kotak Mahindra Bank
distributed by it and/or its affiliated company(ies). This report is for personal information of the selected recipient/s and does not construe to be any investment, legal or taxation advice to you. This research report does
not constitute an offer, invitation or inducement to invest in securities or other investments and Motilal Oswal Securities Limited (hereinafter referred as MOSt) is not soliciting any action based upon it. This report is not
for public distribution and has been furnished to you solely for your general information and should not be reproduced or redistributed to any other person in any form. This report does not constitute a personal
recommendation or take into account the particular investment objectives, financial situations, or needs of individual clients. Before acting on any advice or recommendation in this material, investors should consider
whether it is suitable for their particular circumstances and, if necessary, seek professional advice. The price and value of the investments referred to in this material and the income from them may go down as well as
up, and investors may realize losses on any investments. Past performance is not a guide for future performance, future returns are not guaranteed and a loss of original capital may occur.
MOSt and its affiliates are a full-service, integrated investment banking, investment management, brokerage and financing group. We and our affiliates have investment banking and other business relationships with a
some companies covered by our Research Department. Our research professionals may provide input into our investment banking and other business selection processes. Investors should assume that MOSt and/or
its affiliates are seeking or will seek investment banking or other business from the company or companies that are the subject of this material and that the research professionals who were involved in preparing this
material may educate investors on investments in such business. The research professionals responsible for the preparation of this document may interact with trading desk personnel, sales personnel and other
parties for the purpose of gathering, applying and interpreting information. Our research professionals are paid on the profitability of MOSt which may include earnings from investment banking and other business.
MOSt generally prohibits its analysts, persons reporting to analysts, and members of their households from maintaining a financial interest in the securities or derivatives of any companies that the analysts cover.
Additionally, MOSt generally prohibits its analysts and persons reporting to analysts from serving as an officer, director, or advisory board member of any companies that the analysts cover. Our salespeople, traders,
and other professionals or affiliates may provide oral or written market commentary or trading strategies to our clients that reflect opinions that are contrary to the opinions expressed herein, and our proprietary
trading and investing businesses may make investment decisions that are inconsistent with the recommendations expressed herein. In reviewing these materials, you should be aware that any or all of the foregoing
among other things, may give rise to real or potential conflicts of interest. MOSt and its affiliated company(ies), their directors and employees and their relatives may; (a) from time to time, have a long or short position
in, act as principal in, and buy or sell the securities or derivatives thereof of companies mentioned herein. (b) be engaged in any other transaction involving such securities and earn brokerage or other compensation
or act as a market maker in the financial instruments of the company(ies) discussed herein or act as an advisor or lender/borrower to such company(ies) or may have any other potential conflict of interests with
respect to any recommendation and other related information and opinions.; however the same shall have no bearing whatsoever on the specific recommendations made by the analyst(s), as the recommendations
made by the analyst(s) are completely independent of the views of the affiliates of MOSt even though there might exist an inherent conflict of interest in some of the stocks mentioned in the research report
Reports based on technical and derivative analysis center on studying charts company's price movement, outstanding positions and trading volume, as opposed to focusing on a company's fundamentals and, as
such, may not match with a report on a company's fundamental analysis. In addition MOST has different business segments / Divisions with independent research separated by Chinese walls catering to different set
of customers having various objectives, risk profiles, investment horizon, etc, and therefore may at times have different contrary views on stocks sectors and markets.
Unauthorized disclosure, use, dissemination or copying (either whole or partial) of this information, is prohibited. The person accessing this information specifically agrees to exempt MOSt or any of its affiliates or
employees from, any and all responsibility/liability arising from such misuse and agrees not to hold MOSt or any of its affiliates or employees responsible for any such misuse and further agrees to hold MOSt or any of
its affiliates or employees free and harmless from all losses, costs, damages, expenses that may be suffered by the person accessing this information due to any errors and delays. The information contained herein is
based on publicly available data or other sources believed to be reliable. Any statements contained in this report attributed to a third party represent MOSt’s interpretation of the data, information and/or opinions
provided by that third party either publicly or through a subscription service, and such use and interpretation have not been reviewed by the third party. This Report is not intended to be a complete statement or
summary of the securities, markets or developments referred to in the document. While we would endeavor to update the information herein on reasonable basis, MOSt and/or its affiliates are under no obligation to
update the information. Also there may be regulatory, compliance, or other reasons that may prevent MOSt and/or its affiliates from doing so. MOSt or any of its affiliates or employees shall not be in any way
responsible and liable for any loss or damage that may arise to any person from any inadvertent error in the information contained in this report. MOSt or any of its affiliates or employees do not provide, at any time,
any express or implied warranty of any kind, regarding any matter pertaining to this report, including without limitation the implied warranties of merchantability, fitness for a particular purpose, and non-infringement.
The recipients of this report should rely on their own investigations.
This report is intended for distribution to institutional investors. Recipients who are not institutional investors should seek advice of their independent financial advisor prior to taking any investment decision based on
this report or for any necessary explanation of its contents.
Most and it’s associates may have managed or co-managed public offering of securities, may have received compensation for investment banking or merchant banking or brokerage services, may have received any
compensation for products or services other than investment banking or merchant banking or brokerage services from the subject company in the past 12 months.
Most and it’s associates have not received any compensation or other benefits from the subject company or third party in connection with the research report.
Subject Company may have been a client of Most or its associates during twelve months preceding the date of distribution of the research report
MOSt and/or its affiliates and/or employees may have interests/positions, financial or otherwise of over 1 % at the end of the month immediately preceding the date of publication of the research in the securities
mentioned in this report. To enhance transparency, MOSt has incorporated a Disclosure of Interest Statement in this document. This should, however, not be treated as endorsement of the views expressed in the
report.
Motilal Oswal Securities Limited is under the process of seeking registration under SEBI (Research Analyst) Regulations, 2014.
There are no material disciplinary action that been taken by any regulatory authority impacting equity research analysis activities
Analyst Certification
The views expressed in this research report accurately reflect the personal views of the analyst(s) about the subject securities or issues, and no part of the compensation of the research analyst(s) was, is, or will be
directly or indirectly related to the specific recommendations and views expressed by research analyst(s) in this report. The research analysts, strategists, or research associates principally responsible for preparation
of MOSt research receive compensation based upon various factors, including quality of research, investor client feedback, stock picking, competitive factors and firm revenues
Disclosure of Interest Statement
§
Analyst ownership of the stock
§
Served as an officer, director or employee
KOTAK MAHINDRA BANK LTD
No
No
Regional Disclosures (outside India)
For U.S.
This report is not directed or intended for distribution to or use by any person or entity resident in a state, country or any jurisdiction, where such distribution, publication, availability or use would be contrary to law,
regulation or which would subject MOSt & its group companies to registration or licensing requirements within such jurisdictions.
Motilal Oswal Securities Limited (MOSL) is not a registered broker - dealer under the U.S. Securities Exchange Act of 1934, as amended (the"1934 act") and under applicable state laws in the United States. In
addition MOSL is not a registered investment adviser under the U.S. Investment Advisers Act of 1940, as amended (the "Advisers Act" and together with the 1934 Act, the "Acts), and under applicable state laws in the
United States. Accordingly, in the absence of specific exemption under the Acts, any brokerage and investment services provided by MOSL, including the products and services described herein are not available to or
intended for U.S. persons.
This report is intended for distribution only to "Major Institutional Investors" as defined by Rule 15a-6(b)(4) of the Exchange Act and interpretations thereof by SEC (henceforth referred to as "major institutional
investors"). This document must not be acted on or relied on by persons who are not major institutional investors. Any investment or investment activity to which this document relates is only available to major
institutional investors and will be engaged in only with major institutional investors. In reliance on the exemption from registration provided by Rule 15a-6 of the U.S. Securities Exchange Act of 1934, as amended (the
"Exchange Act") and interpretations thereof by the U.S. Securities and Exchange Commission ("SEC") in order to conduct business with Institutional Investors based in the U.S., MOSL has entered into a chaperoning
agreement with a U.S. registered broker-dealer, Motilal Oswal Securities International Private Limited. ("MOSIPL"). Any business interaction pursuant to this report will have to be executed within the provisions of this
chaperoning agreement.
The Research Analysts contributing to the report may not be registered /qualified as research analyst with FINRA. Such research analyst may not be associated persons of the U.S. registered broker-dealer, MOSIPL,
and therefore, may not be subject to NASD rule 2711 and NYSE Rule 472 restrictions on communication with a subject company, public appearances and trading securities held by a research analyst account.
Motilal Oswal Capital Markets Singapore Pte Limited is acting as an exempt financial advisor under section 23(1)(f) of the Financial Advisers Act(FAA) read with regulation 17(1)(d) of the Financial Advisors
Regulations and is a subsidiary of Motilal Oswal Securities Limited in India. This research is distributed in Singapore by Motilal Oswal Capital Markets Singapore Pte Limited and it is only directed in Singapore to
accredited investors, as defined in the Financial Advisers Regulations and the Securities and Futures Act (Chapter 289), as amended from time to time.
In respect of any matter arising from or in connection with the research you could contact the following representatives of Motilal Oswal Capital Markets Singapore Pte Limited:
Anosh Koppikar
Kadambari Balachandran
Email : anosh.Koppikar@motilaloswal.com
Email : kadambari.balachandran@motilaloswal.com
Contact : (+65)68189232
Contact : (+65) 68189233 / 65249115
Office Address : 21 (Suite 31),16 Collyer Quay,Singapore 04931
For Singapore
Motilal Oswal Securities Ltd
5 May 2015
Motilal Oswal Tower, Level 9, Sayani Road, Prabhadevi, Mumbai 400 025
Phone: +91 22 3982 5500 E-mail: reports@motilaloswal.com
16