13 May 2015
4QFY15 Results Update | Sector: Consumer
Emami
BSE SENSEX
27,251
Bloomberg
Equity Shares (m)
M.Cap. (INR b)/(USD
b)
52-Week Range (INR)
1, 6, 12 Rel. Per (%)
Avg Val(INRm)/Vol‘000
Free float (%)
Financials & Valuation (INR b)
Y/E MAR
Sales
EBITDA
NP
EPS (INR)
EPS Gr. (%)
BV/Sh. (INR)
RoE (%)
RoCE (%)
P/E (x)
P/BV (x)
2015 2016E 2017E
22.2
5.4
4.9
21.6
21.7
54.3
45.3
44.0
43.6
17.3
25.9
6.9
6.1
27.0
25.1
66.0
44.9
44.8
34.9
14.3
30.7
8.4
7.5
32.9
22.0
80.8
44.8
45.4
28.6
11.6
n
n
S&P CNX
8,235
HMN IN
227.0
213.6/3.3
1,140/429
-10/22/100
157/209
27.3
n
CMP: INR941
n
TP: INR1,060 (+13%)
Buy
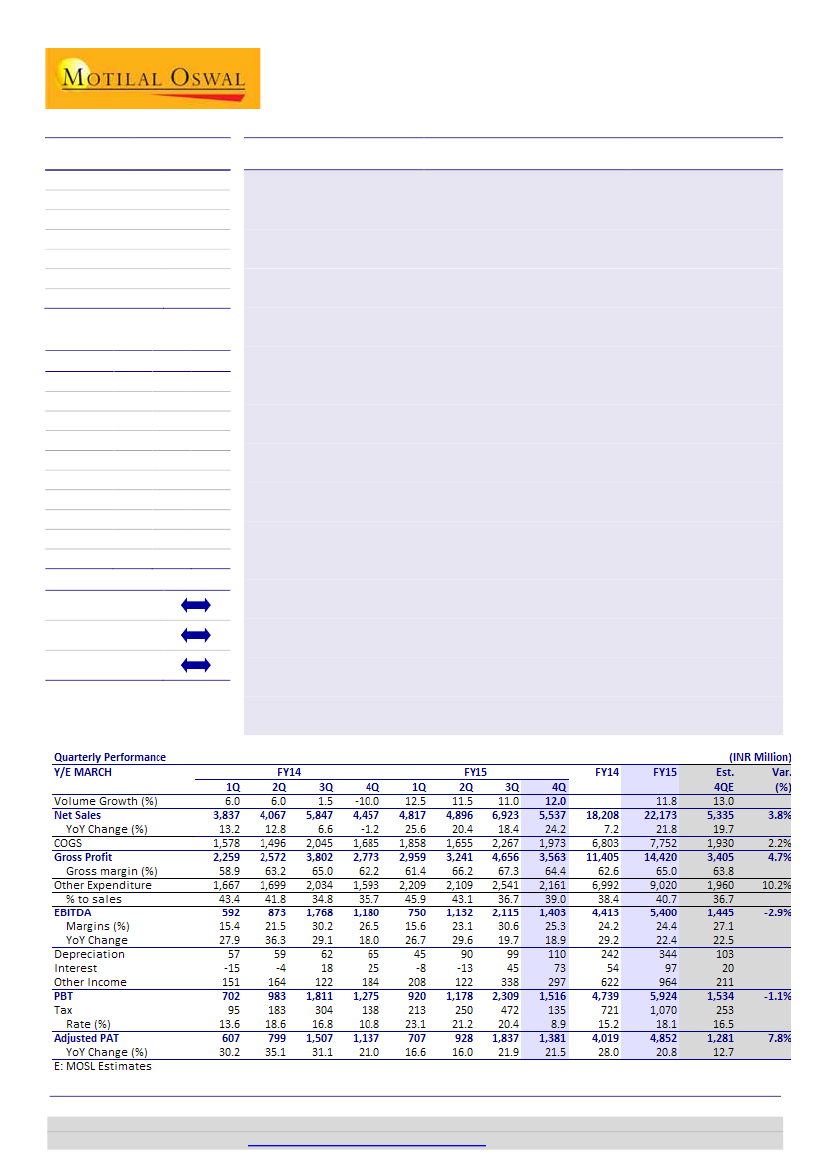
Strong operational performance with market share gains
Emami’s (HMN) 4QFY15 sales and PAT beat estimates,
with sales up 24.2% to
INR5.5b (est. of INR5.3b) and PAT up 21.6% to INR1.4b (est. of INR 1.3b). EBITDA
was up 18.9% YoY to INR1.4b (est. of INR1.4b). The performance was aided by soft
base (sales decline of 1.2% in 4QFY14). Underlying domestic volumes recorded
healthy 12% growth while overall volumes were up 13.3%. HMN registered broad-
based growth with market share gains in key categories. New product launches
contributed 8% to revenue growth during 4Q.
Solid gross margin expansion:
Gross margin expanded 220bp YoY to 64.4%, led by
benign RM prices and price hikes. However, higher ad spends (up 380bp YoY,
primarily on account of soft base and new launch momentum) resulted in EBITDA
margin contraction of 110bp YoY to 25.3% (est. of 27.1%). Thus, EBITDA was up
18.9% YoY to INR1.4b (est. of INR1.4b). PAT grew 21.6% to INR1.4b (est. of INR
1.3b), aided by higher other income and lower tax rates.
Acceleration in new launches:
Emami launched five products during FY15 which
contributed ~5% to revenue growth—driven by strong performance in Zandu Ultra
Power and F&H face wash. Boroplus face wash and SHE Comfort did not perform
well and are expected to see corrective action. The management has guided for
continued new launch activity (5% of revenues in FY16).
Concall highlights-FY16 guidance:
a) Revenue growth of 17-18%, with
International segment posting 20-25% growth, b) A&P-to-sales to be ~18%, c) tax
rate to be MAT and d) capex to be INR1.5b each for FY16 and FY17.
Valuation and view:
We largely retain our estimates and model for robust 25%
and 24% EBITDA and EPS CAGR, respectively, over FY15E-17E. Maintain Buy with a
target price of INR1,060 (P/E of 32x FY17E EPS, 20% premium to average three-
year P/E—given the strong earnings growth ahead). We expect the rich valuations
to sustain as Emami’s earnings momentum is led by strong topline delivery
compared with the benign commodity cost-led earnings uptick of the rest of the
universe. Our long-term structural BUY thesis on Emami remains unchanged.
Estimate change
TP change
Rating change
n
Gautam Duggad
(Gautam.Duggad@MotilalOswal.com); +91 22 3982 5404
Manish Poddar
(Manish.Poddar@MotilalOswal.com); +91 22 3027 8029
Investors are advised to refer through disclosures made at the end of the Research Report.
Motilal Oswal research is available on
www.motilaloswal.com/Institutional-Equities,
Bloomberg, Thomson Reuters, Factset and S&P Capital.

Emami
Key quarterly charts
Exhibit 1: Revenues grew 24.2% in 4Q; 4% ahead of est.
Sales (INR in mn)
19.9
13.2 13.2 12.8
6.6
(1.2)
-10
Sales Growth (%) 24.2
25.6
18.4
20.4
Exhibit 2: …with underlying volume growth of 12%
Volume growth (%)
15
16
16
16
13
6
6
1.5
12.5 11.5 11.0 12.0
12.4 13.0
16.2
Source: Company, MOSL
Exhibit 3: Gross margins expanded 220bp YoY led by
benign RM costs and price hikes
Gross Margins (%)
62.0
54.3
63.2
58.9
65.0
62.2 61.4
66.2 67.3
Exhibit 4: Higher A&P dragged EBITDA margin, down 110bp
YoY
EBITDA Margin (%)
64.4
20.6
13.7
17.8
30.2
25.0
22.2
15.4
21.5
15.6
26.5
30.6
23.1
25.3
55.2
51.6
58.6
Source: Company, MOSL
Exhibit 5: Ad spends were up 380bp in 4Q15
Adspends (%)
18.7 17.9 18.6
10.9
18.9
21.3
16.6
18.4
15.0
11.1
17.2
14.9
Exhibit 6: Average Mentha oil prices were down 4.4%
YoY; but rebounded from the bottom
2,750
2,000
1600
1,250
500
1340
870
1,050
Mentha Oil prices INR / kg
9.2
Source: Company, MOSL
Source: Bloomberg, MOSL
13 May 2015
2

Emami
Exhibit 7: Power brands grew in healthy double digits
Category Performance
Boroplus Antiseptic Cream
Zandu Balm
Fair & Handsome
Navratna Cool Oil
Zandu HCD
International
CSD
3Q13
30%
15%
19%
13%
25%
25%
12%
4Q13
-9%
18%
15%
13%
41%
-12%
68%
1Q14
NA
7%
16%
9%
27%
25%
24%
2Q14
30%
0%
20%
6%
28%
27%
14%
3Q14
-3%
9%
12%
6%
31%
37%
-14%
4Q14
NA
-5%
-2%
5%
52%
9%
42%
1Q15
-16%
13%
14%
14%
32%
104%
6%
2Q15
3Q15
4Q15
NA
19%
43%
12%
15%
10%
16%
21%
9%
22%
27%
14%
30%
18%
24%
33%
21%
48%
16%
16%
11%
Source: Company, MOSL
Exhibit 8: Market share (%) improvement across major power brands barring F&H
4Q14
72.7
59.5
55.5 56.9
21.1 24.7
4Q15
64.6 64.0
81.0 81.0
Navratna Cooling
Oil
Navratna Cooling
Talc
Zandu & Mentho Fair and Handsome
Boroplus
Plus Balm
Anticeptic Cream
Source: Company, MOSL
Exhibit 9: Category details of Emami’s recent forays
New Launches
SHE Comfort
Zandu Balm Ultra Power
HE Deodorants
Emami 7 Oils in One
Fair & Handsome- Instant Fairness Face Wash
Category Size
(INR b)
24.2
7.4
21.7
60.6
2
Category
Growth rate (%)
15
7
11
4
Launched
in
Aug-14
Jun-14
May-14
Apr-14
62
Feb-14
Source: Company, MOSL
Revenue growth beats estimate; 12% domestic volume growth
n
n
n
Consol Net sales grew 24.2% to INR5.5b (est. INR5.3b),. Underlying domestic
volume posted growth of 12% with overall volumes up 13.3%. Domestic sales
grew 21% YoY, while International and CSD posted growth of 48% and 11%
respectively. The topline performance was also aided by soft base (volume and
sales declined 10% and 1.2% in 4QFY14, resp.)
HMN registered broad-based growth with all power brands barring F&H
(Navratna Oil, Balms and Boroplus) witnessing market share gains. New product
launches contributed 8% to revenue growth during the quarter and 5% in FY15.
Gross margin expanded 220bp YoY to 64.4% led by benign RM prices (Mentha
prices down 4.4% YoY) and price hikes. However, higher ad spends (up 380bp
YoY to 14.9%, primarily on account of soft base and new launch momentum)
and increased other expenses (up 20bp YoY to 17.5%) were partially offset by
lower staff costs (down 70bp YoY to 6.6%), resulting in EBITDA margin
contraction of 110bp YoY to 25.3% (est.27.1%). Thus, EBITDA posted a healthy
18.9% YoY growth to INR1.4b (est. INR1.4b).
3
13 May 2015

Emami
n
n
Higher other income (up 60.9% to INR296.5m) and lower tax rate (down 200bp
YoY to 8.9%) drove Adj. PAT growth to 21.6% to INR1.4b (est. INR 1.3b).
FY15 Highlights:
Sales, EBITDA and Adj PAT posted growth of 21.8%, 22.4% and
19.9% resp. Net Cash stood at INR8.3b vs. INR5.4b in FY14. Company posted
FY15 EPS of INR 21.4. Along with final dividend of INR3/share, FY15 total
dividend stood at INR7/share.
Brand-wise performance: Broad based double digit growth with market
share gains
n
n
n
n
n
n
n
Navratna:
-
Navratna Cooling Oil sales were up 14% YoY. Market share improved
1,320bp YoY to 72.7%;
- Navratna Cool Talc sales increased 26% YoY and gained 360bp market share
to 24.7%.
Balms:
Sales grew 10% YoY with market share improvement of 140bp YoY to
56.9%.
Fair and Handsome
sales were up 9% YoY. The brand maintained its leadership
with market share of 64% during 4Q.
Boroplus
- Antiseptic cream maintained its market leadership (81% market share) and
posted 43% sales growth during 4Q.
- Prickly heat powder sales grew by 51% during the quarter.
Zandu Healthcare Division
continued its robust performance and posted sales
growth of 24%YoY. Pancharishta posted sales growth of 50% while Vigorex sales
grew by 56%. HMN plans to launch new products in the Healthcare portfolio
during FY16.
International
sales grew by 48% during the quarter with CIS, GCC and SAARC
region posting good growth.
CSD and Modern trade
(~5% of sales) sales were up 11% and 40% respectively
in 4Q15.
New launches adding to the topline growth momentum:
- Emami has done 5 new launches during FY15 (Boroplus and F&H Face wash,
HE Deodorant, 7 Oils in One, SHE Comfort, Zandu Ultra Power) which
contributed 5% to revenue growth during FY15.
- This was driven by strong performance in Zandu Ultra Power and F&H Face
wash. Boroplus Face wash and SHE Comfort have not performed as per
internal expectation, as per management
- Emami is redrafting its strategy in Sanitary Napkin segment and will be re-
launching “SHE” going ahead. In our view, this is Emami’s maiden foray into
personal hygiene segment and will take few quarters for its sales
infrastructure to adopt to “pull” based selling vs. existing “push” mechanism
adopted in most of the FMCG categories.
- As per management new launches (extensions as well as new brand) will
contribute 5% of the topline even in FY16. The new launch basket in FY16
will also include the brands launched in FY15 as some of them are yet to
complete 12 months.
4
n
13 May 2015

Emami
-
-
Emami has been the most aggressive company in our FMCG universe which
has focused on topline growth and has gone after adding new growth
drivers. Benign RM environment has allowed Emami to plough back gross
margin savings to invest behind new launches/category entries and build a
medium term growth driver. We reckon this is a sensible strategy to adopt
in a largely benign RM environment notwithstanding the risks involved in
handling multiple new category entries.
Emami’s peers have largely retained the gross margin benefits in P&L or
have increased tactical promotions/discounts to support near term volume
growth.
ConCall highlights
Quarterly Performance
n
Volume growth – 13.3%. New launches contributed 8% to the growth in 4Q15
and 6% in FY15.
n
Urban and Rural salience is 50:50.
n
Navratna and Boroplus – did well in Rural.
n
New launches should contributed ~5% in FY16 – brands launched in FY15 will
also be considered in “New Launch” basket for FY16 contribution as most of
them are yet to complete 12 months.
n
Existing portfolio (adjusted for new launches) grew 17% in 4Q15.
n
Zandu Ultra Power and F&H Facewash has done well amongst the new launches.
Boroplus Facewash and SHE Sanitary napkins has not done well.
n
Sanitary Napkins is a focus brand in FY16 – new marketing strategy on the anvil.
n
F&H:
Maintained market share in FY15 despite subdued growth.
n
Healthcare:
Has good potential and working on new categories within the
segment. Some test launches expected in next 2-3 months.
n
Ad-spend break-up:
80% advertising, 20% promotions.
n
Tax rate was low due to higher dividend income from treasury surplus.
Guidance
n
FY16:
Topline growth could be 17-18%.
n
Pricing:
3-4% price hikes in FY16.
n
Ad spends for FY16:
Likely to be similar to FY15 at ~18%.
n
Tax rate:
MAT – 20-21%.
n
Capex:
INR 1.5b for FY16 and FY17 each – Assam plant and IT initiatives.
n
International growth rate: Should be in 20-25% range.
Valuation and view
n
n
As we had emphasized in our earlier reports, we see clear DNA change in
Emami, as it changes its complexion from a family-driven niche category
operator to a professional FMCG player without aversion to get into scalable
mainstream categories.
The runway for growth in the medium term looks attractive as it scales up new
products. This coupled with benign raw material price environment gives ample
headroom for margin expansion despite higher ad spends. Market share gains in
5
13 May 2015

Emami
n
key power brands underscore Emami’s ability to manage competitive intensity
in periods of soft commodity price environment.
We largely retain our estimates and model for robust 25% and 24% EBITDA and
EPS CAGR over FY15E-17E. Maintain Buy, with target price of INR1,060 (32x FY17
EPS, 20% average to 3 year average P/E given strong expected earnings CAGR of
26% over FY15-17e). We expect the rich valuations to sustain as Emami’s
earnings momentum is led by strong topline delivery as against the benign
commodity cost led earnings uptick of rest of the universe.
Exhibit 11: Emami P/E premium vs. Sensex
Exhibit 10: Emami P/E (x)
45.0
37.0
29.0
21.0
13.0
5.0
21.1
20.5
8.3
PE (x)
Median(x)
Peak(x)
Min(x)
Avg(x)
37.4
34.2
150
100
50
0
-50
Emami PE Relative to Sensex PE (%)
LPA (%)
112.8
28.3
Source: Company, MOSL
Exhibit 12: Valuation Metrics of coverage universe
Company
Consumer
Asian Paints
Britannia
Colgate
Dabur*
Emami*
Godrej Consumer
GSK Consumer
Hind. Unilever
ITC
Jyothy Labs
Marico*
Nestle
Pidilite Inds.
Radico Khaitan
United Spirits
Retail
Jubilant Foodworks
Shopper's Stop
Titan Company
Reco
Price Mkt Cap EPS Growth YoY (%)
P/E (x)
EV/EBITDA (x)
ROE (%) Div. (%)
(INR) (USD M) FY15E FY16E FY17E FY15E FY16E FY17E FY15E FY16E FY17E FY15E FY15E
763
2,286
2,038
261
941
1,085
6,347
843
327
238
407
6,700
585
89
3,600
1,551
383
367
11,440
4,268
4,332
7,153
3,339
5,772
4,172
28,507
40,702
673
4,102
10,097
4,684
185
8,179
1,586
491
5,097
16.2 37.4
29.0 32.7
15.7 23.5
16.5 25.9
21.7 25.1
19.6 38.9
-13.5 23.2
5.5
18.0
11.0 10.9
15.2 88.0
18.1 21.2
6.8
20.1
12.9 50.8
-10.4 19.2
LP
151.7
2.3
8.1
11.1
66.8
60.5
15.4
22.7
25.0
24.2
15.8
22.0
21.6
20.5
18.1
14.9
3.9
24.4
18.8
17.2
20.3
43.5
43.3
44.6
22.9
51.2
54.5
48.8
42.6
43.6
41.9
45.7
47.5
26.7
43.7
45.8
51.4
55.9
15.6
207.8
83.9
78.2
39.6
37.3
41.1
39.6
33.9
34.9
30.1
37.1
40.2
24.1
23.2
37.8
42.8
37.0
13.1
82.5
50.3
48.7
34.3
30.4
32.9
31.9
29.3
28.6
24.8
30.8
34.1
20.9
22.3
30.4
36.1
31.6
10.9
57.5
35.1
33.7
27.9
34.4
39.8
33.0
34.4
38.1
29.9
33.9
70.6
18.0
30.6
30.1
30.7
37.1
10.7
71.1
38.5
17.3
30.1
24.8
29.2
25.3
26.9
29.5
22.4
26.5
58.3
16.3
19.4
24.4
25.6
24.8
8.8
48.8
24.3
13.9
25.8
19.9
22.8
20.4
23.0
23.8
18.9
21.7
47.8
14.3
15.8
19.4
21.7
20.9
7.3
38.0
17.5
11.3
20.7
32.5
51.2
89.3
35.9
45.3
20.4
29.6
109.6
35.2
13.1
33.5
48.2
23.7
8.9
8.0
17.9
5.4
27.2
0.9
0.7
1.5
0.8
0.8
0.7
0.9
1.6
2.2
1.3
0.6
0.9
0.6
1.0
0.0
0.0
0.2
0.8
Neutral
Buy
Buy
Neutral
Buy
Neutral
Neutral
Neutral
Neutral
Buy
Neutral
Neutral
Neutral
Buy
Buy
Buy
Neutral
Neutral
Source: Company, MOSL
13 May 2015
6

Emami
Story in charts
Exhibit 13: Revenue CAGR of 17.7% over FY15-FY17E
Revenue (INR b)
36.7
30.5
22.1
21.8
16.6 16.9
18.2
7.5
10.2
12.5
14.5
17.0
7.2
22.2
25.9
30.7
SAARC
36%
Source: Company, MOSL
16.9
18.6
Revenue growth (%)
Exhibit 14: Geographical breakup of IMD sales (4QFY15)
Africa
10%
Others
9%
GCC
29%
CIS
16%
FY09 FY10 FY11 FY12 FY13 FY14 FY15E FY16E FY17E
Source: Company, MOSL
Exhibit 15: Emami has recruited CXO level talent from MNCs
Name
K S Arunkumar
Punita Kalra
C K Katiyar
Rishi Bhattacharya
Neeraj Chandra
Ajit Babu
Earlier assignment
Product Technology Group Head Skin Care-South Asia, HUL
Vice President and Head, Ayueveda Research, Dabur
Consultant (ex-HUL)
COO-Britannia
Marketing (Colgate) and Regional Category Vice President (Unilever)
New assignment with Emami
CEO, Research & Innovation strategy
CEO, Healthcare (technical)
Healthcare
CEO-Consumer
CEO – Healthcare
IT Director - Business Partnering & Innovation-Asia, Africa and Russia Region, HUL President, IT
Exhibit 16: PAT to grow at 24% CAGR over FY15-17E
PAT (INR m)
95.7
PAT Growth (%)
Exhibit 17: Return ratios
ROCE (%)
47.1
49.8
41.8
28.9 31.2
34.6
ROE (%)
43.9
44.9
44.8
35.8
27.2
-1.0
13.2
21.6
27.9
21.7
25.1
31.2
38.8
31.1
34.8 37.1
42.4
52.1 52.5 52.9
23.7
FY09
FY10
FY11
FY12
FY13
FY14E FY15E FY16E
Source: Company, MOSL
FY08 FY09 FY10 FY11 FY12 FY13 FY14 FY15E FY16E FY17E
Source: Company, MOSL
13 May 2015
7

Emami
Financials and valuations
Income Statement
Y/E March
Net Sales
Change (%)
COGS
Gross Profit
Gross Margin (%)
Operating expenses
EBITDA
Change (%)
Margin (%)
Depreciation
Int. and Fin. Charges
Financial Other Income
Profit before Taxes
Change (%)
Margin (%)
Tax
Tax Rate (%)
Adjusted PAT
Change (%)
Margin (%)
Non-rec. (Exp)/Income
Reported PAT
2010
10,217
36.7
3,805
6,412
62.8
3,960
2,452
92.3
24.0
154
210
83
2,171
105.0
21.2
342
16.2
1,798
95.7
17.6
121
1,697
2011
12,471
22.1
5,232
7,239
58.0
4,587
2,652
8.2
21.3
140
152
331
2,691
24.0
21.6
337
15.0
2,287
27.2
18.3
0
2,287
2012
14,535
16.6
6,264
8,271
56.9
5,483
2,788
5.1
19.2
188
152
541
2,989
11.1
20.6
393
13.4
2,588
13.2
17.8
0
2,588
2013
16,991
16.9
7,154
9,837
57.9
6,421
3,415
22.5
20.1
220
66
557
3,687
23.3
21.7
548
14.6
3,147
21.6
18.5
0
3,147
2014
18,208
7.2
6,803
11,405
62.6
6,961
4,444
30.1
24.4
352
54
622
4,660
26.4
25.6
636
11.7
4,025
27.9
22.1
89
4,025
2015
22,173
21.8
7,752
14,420
65.0
9,020
5,400
21.5
24.4
344
51
964
5,969
28.1
26.9
1,070
17.9
4,899
21.7
22.1
46
4,854
2016E
25,909
16.9
8,544
17,365
67.0
10,498
6,867
27.2
26.5
379
37
1,114
7,566
26.7
29.2
1,437
19.0
6,128
25.1
23.7
0
6,128
(INR Million)
2017E
30,722
18.6
10,125
20,596
67.0
12,238
8,359
21.7
27.2
422
29
1,321
9,229
22.0
30.0
1,753
19.0
7,475
22.0
24.3
0
7,475
Balance Sheet
Y/E March
Share Capital
Reserves
Net Worth
Minority Interest
Loans
Deferred Liability
Capital Employed
Goodwill on consolidation
Gross Block
Less: Accum. Depn.
Net Fixed Assets
Capital WIP
Investments
Curr. Assets, L&A
Inventory
Account Receivables
Cash and cash equivalents
Others
Curr. Liab. and Prov.
Account Payables
Other Liabilities
Provisions
Net Current Assets
Application of Funds
E: MOSL Estimates
2010
151
6,103
6,254
0
2,591
70
8,914
0
7,638
2,027
5,611
62
616
4,247
826
755
1,614
1,051
1,621
890
37
695
2,625
8,914
2011
151
6,747
6,899
1
2,294
137
9,330
8
7,993
3,148
4,845
65
66
5,998
1,234
1,087
2,107
1,570
1,649
883
32
733
4,349
9,332
2012
151
6,915
7,066
1
1,611
145
8,824
42
8,377
4,342
4,035
768
803
6,125
1,122
1,005
2,760
1,237
2,949
1,071
256
1,621
3,176
8,825
2013
151
7,623
7,775
0
1,201
137
9,113
46
9,394
5,472
3,922
475
1,631
6,088
1,140
1,122
2,817
1,009
3,049
1,061
267
1,721
3,039
9,113
2014
227
9,094
9,321
0
450
48
9,819
0
10,341
6,382
3,959
119
2,958
5,987
1,411
793
2,700
1,083
3,203
1,480
341
1,383
2,783
9,819
2015
227
12,104
12,331
0
731
98
13,160
0
11,841
7,328
4,513
119
966
11,913
1,711
1,103
7,756
1,342
4,351
1,955
341
2,055
7,562
13,160
2016E
227
14,762
14,989
0
731
98
15,819
0
12,841
8,317
4,524
119
966
15,624
1,868
1,446
10,728
1,583
5,414
2,083
341
2,990
10,210
15,819
(INR Million)
2017E
227
18,122
18,349
0
731
98
19,179
0
13,841
9,349
4,492
119
966
19,866
2,114
1,714
14,161
1,877
6,265
2,264
341
3,660
13,602
19,179
13 May 2015
8

Emami
Financials and valuations
Ratios
Y/E March
Basic (INR)
EPS
Cash EPS
BV/Share
DPS
Payout %
Valuation (x)
P/E
Cash P/E
EV/Sales
EV/EBITDA
P/BV
Dividend Yield (%)
Return Ratios (%)
RoE
RoCE
Working Capital Ratios
Debtor (Days)
Asset Turnover (x)
Leverage Ratio
Debt/Equity (x)
2010
11.9
12.9
41.3
3.0
25.3
79.2
73.0
14.0
58.2
22.8
0.3
38.8
27.9
27
1.2
0.2
2011
15.1
16.0
45.6
3.5
23.2
62.3
58.7
11.4
53.7
20.6
0.4
34.8
27.5
31
1.4
0.0
2012
17.1
18.3
46.7
8.0
46.8
55.0
51.3
9.7
50.4
20.2
0.8
37.1
28.6
25
1.5
-0.2
2013
20.8
22.3
51.4
8.0
38.5
45.3
42.3
8.2
40.7
18.3
0.8
42.4
35.6
24
1.7
-0.6
2014
17.7
19.3
41.1
4.0
22.6
53.1
48.8
11.4
46.9
22.9
0.4
47.1
43.2
16
1.6
-0.3
2015
21.6
23.1
54.3
7.3
35.0
43.6
40.7
9.3
38.1
17.3
0.8
45.3
44.0
18
1.6
-0.6
2016E
27.0
28.7
66.0
10.8
39.9
34.9
32.8
7.8
29.5
14.3
1.1
44.9
44.8
20
1.7
-0.7
2017E
32.9
34.8
80.8
13.2
40.1
28.6
27.1
6.5
23.8
11.6
1.4
44.8
45.4
20
1.7
-0.7
Cash Flow Statement
Y/E March
OP/(loss) before Tax
Int./Div. Received
Interest Paid
Direct Taxes Paid
(Incr)/Decr in WC
CF from Operations
(Incr)/Decr in FA
(Pur)/Sale of Investments
CF from Invest.
(Incr)/Decr in Debt
Dividend Paid
Others
CF from Fin. Activity
Incr/Decr of Cash
Add: Opening Balance
Closing Balance
E: MOSL Estimates
2010
2,452
342
-547
-352
-532
1,362
-266
-223
-489
-1,892
-531
-78
599
1,473
141
1,614
2011
2,652
5
-152
-404
-1,215
886
-358
550
192
-297
-618
329
-585
493
1,614
2,107
2012
2,788
5
-152
-401
1,830
4,070
-1,088
-737
-1,825
-682
-1,405
495
-1,592
653
2,107
2,760
2013
3,415
5
-66
-540
187
3,002
-723
-828
-1,551
-410
-1,416
433
-1,394
57
2,760
2,817
2014
4,444
177
-54
-547
139
4,159
-591
-1,327
-1,918
-751
-1,062
-545
-2,358
-117
2,817
2,700
2015
5,400
0
-44
-1,070
278
4,564
-1,500
1,992
492
281
-1,944
1,663
0
5,057
2,700
7,757
2016E
6,867
0
-37
-1,437
323
5,717
-1,000
0
-1,000
0
-2,860
1,115
-1,745
2,972
7,756
10,728
(INR Million)
2017E
8,359
0
-29
-1,753
42
6,618
-1,000
0
-1,000
0
-3,505
1,321
-2,184
3,434
10,728
14,162
13 May 2015
9

Emami
Corporate profile: Emami
Company description
Emami Limited is the flagship company of the
~INR60b Emami Group. The two promoters, Mr RS
Agarwal and Mr RS Goenka laid the foundations of
the company in 1974 as a partnership firm, Kemco
Chemicals. In 1978, they acquired Himani Limited,
a cosmetics company based in eastern India, with a
factory in Kolkata. Himani launched BoroPlus in
1982 and the Navratna cooling oil range in 1989. In
1998, the promoters merged the two entities,
creating Emami. The company has since focused on
expanding its portfolio in the Healthcare and
Personal Care space. In 2008, it acquired Zandu,
giving it a leadership position in the Balm category
and access to a host of Ayurvedic and OTC
products.
Exhibit 18: Sensex rebased
Exhibit 19: Shareholding pattern (%)
Mar-15
Promoter
DII
FII
Others
72.7
1.3
16.7
9.3
Dec-14
72.7
1.5
16.5
9.3
Mar-14
72.7
1.8
16.0
9.5
Exhibit 20: Top holders
Holder Name
Smallcap World Fund Inc
Avees Trading & Finance Pvt Ltd
Matthews India Fund
% Holding
4.0
2.7
1.6
Note: FII Includes depository receipts
Exhibit 21: Top management
Name
R S Agarwal
Sushil Kumar Goenka
Designation
Chairman
Managing Director & CEO
Exhibit 22: Directors
Name
R S Agarwal
Sushil Kumar Goenka
Aditya Vardhan Agarwal
M D Mallya*
K N Memani*
S B Ganguly*
Y P Trivedi*
Amit Kiran Deb*
Name
Sajjan Bhajanka*
Pradip Kumar Khaitan*
Vaidya Suresh Chaturvedi*
R S Goenka
Mohan Goenka
Priti Sureka
Prashant Goenka
Harsh Vardhan Agarwal
*Independent
Exhibit 23: Auditors
Name
S K Agarwal & Co
V K Jain & Co
Type
Statutory
Cost Auditor
Exhibit 24: MOSL forecast v/s consensus
EPS
(INR)
FY16
FY17
MOSL
forecast
27.0
32.9
Consensus
forecast
24.4
30.2
Variation
(%)
10.7
8.9
13 May 2015
10

Emami
NOTES
13 May 2015
11

This document has been prepared by Motilal Oswal Securities Limited (hereinafter referred to as Most) to provide information about the company(ies) and/sector(s), if any, covered in the report and may be
distributed by it and/or its affiliated company(ies). This report is for personal information of the selected recipient/s and does not construe to be any investment, legal or taxation advice to you. This research report does
not constitute an offer, invitation or inducement to invest in securities or other investments and Motilal Oswal Securities Limited (hereinafter referred as MOSt) is not soliciting any action based upon it. This report is not
for public distribution and has been furnished to you solely for your general information and should not be reproduced or redistributed to any other person in any form. This report does not constitute a personal
recommendation or take into account the particular investment objectives, financial situations, or needs of individual clients. Before acting on any advice or recommendation in this material, investors should consider
whether it is suitable for their particular circumstances and, if necessary, seek professional advice. The price and value of the investments referred to in this material and the income from them may go down as well as
up, and investors may realize losses on any investments. Past performance is not a guide for future performance, future returns are not guaranteed and a loss of original capital may occur.
MOSt and its affiliates are a full-service, integrated investment banking, investment management, brokerage and financing group. We and our affiliates have investment banking and other business relationships with a
some companies covered by our Research Department. Our research professionals may provide input into our investment banking and other business selection processes. Investors should assume that MOSt and/or
its affiliates are seeking or will seek investment banking or other business from the company or companies that are the subject of this material and that the research professionals who were involved in preparing this
material may educate investors on investments in such business. The research professionals responsible for the preparation of this document may interact with trading desk personnel, sales personnel and other
parties for the purpose of gathering, applying and interpreting information. Our research professionals are paid on the profitability of MOSt which may include earnings from investment banking and other business.
MOSt generally prohibits its analysts, persons reporting to analysts, and members of their households from maintaining a financial interest in the securities or derivatives of any companies that the analysts cover.
Additionally, MOSt generally prohibits its analysts and persons reporting to analysts from serving as an officer, director, or advisory board member of any companies that the analysts cover. Our salespeople, traders,
and other professionals or affiliates may provide oral or written market commentary or trading strategies to our clients that reflect opinions that are contrary to the opinions expressed herein, and our proprietary
trading and investing businesses may make investment decisions that are inconsistent with the recommendations expressed herein. In reviewing these materials, you should be aware that any or all of the foregoing
among other things, may give rise to real or potential conflicts of interest. MOSt and its affiliated company(ies), their directors and employees and their relatives may; (a) from time to time, have a long or short position
in, act as principal in, and buy or sell the securities or derivatives thereof of companies mentioned herein. (b) be engaged in any other transaction involving such securities and earn brokerage or other compensation
or act as a market maker in the financial instruments of the company(ies) discussed herein or act as an advisor or lender/borrower to such company(ies) or may have any other potential conflict of interests with
respect to any recommendation and other related information and opinions.; however the same shall have no bearing whatsoever on the specific recommendations made by the analyst(s), as the recommendations
made by the analyst(s) are completely independent of the views of the affiliates of MOSt even though there might exist an inherent conflict of interest in some of the stocks mentioned in the research report
Reports based on technical and derivative analysis center on studying charts company's price movement, outstanding positions and trading volume, as opposed to focusing on a company's fundamentals and, as
such, may not match with a report on a company's fundamental analysis. In addition MOST has different business segments / Divisions with independent research separated by Chinese walls catering to different set
of customers having various objectives, risk profiles, investment horizon, etc, and therefore may at times have different contrary views on stocks sectors and markets.
Unauthorized disclosure, use, dissemination or copying (either whole or partial) of this information, is prohibited. The person accessing this information specifically agrees to exempt MOSt or any of its affiliates or
employees from, any and all responsibility/liability arising from such misuse and agrees not to hold MOSt or any of its affiliates or employees responsible for any such misuse and further agrees to hold MOSt or any of
its affiliates or employees free and harmless from all losses, costs, damages, expenses that may be suffered by the person accessing this information due to any errors and delays. The information contained herein is
based on publicly available data or other sources believed to be reliable. Any statements contained in this report attributed to a third party represent MOSt’s interpretation of the data, information and/or opinions
provided by that third party either publicly or through a subscription service, and such use and interpretation have not been reviewed by the third party. This Report is not intended to be a complete statement or
summary of the securities, markets or developments referred to in the document. While we would endeavor to update the information herein on reasonable basis, MOSt and/or its affiliates are under no obligation to
update the information. Also there may be regulatory, compliance, or other reasons that may prevent MOSt and/or its affiliates from doing so. MOSt or any of its affiliates or employees shall not be in any way
responsible and liable for any loss or damage that may arise to any person from any inadvertent error in the information contained in this report. MOSt or any of its affiliates or employees do not provide, at any time,
any express or implied warranty of any kind, regarding any matter pertaining to this report, including without limitation the implied warranties of merchantability, fitness for a particular purpose, and non-infringement.
The recipients of this report should rely on their own investigations.
This report is intended for distribution to institutional investors. Recipients who are not institutional investors should seek advice of their independent financial advisor prior to taking any investment decision based on
this report or for any necessary explanation of its contents.
Most and it’s associates may have managed or co-managed public offering of securities, may have received compensation for investment banking or merchant banking or brokerage services, may have received any
compensation for products or services other than investment banking or merchant banking or brokerage services from the subject company in the past 12 months.
Most and it’s associates have not received any compensation or other benefits from the subject company or third party in connection with the research report.
Subject Company may have been a client of Most or its associates during twelve months preceding the date of distribution of the research report
MOSt and/or its affiliates and/or employees may have interests/positions, financial or otherwise of over 1 % at the end of the month immediately preceding the date of publication of the research in the securities
mentioned in this report. To enhance transparency, MOSt has incorporated a Disclosure of Interest Statement in this document. This should, however, not be treated as endorsement of the views expressed in the
report.
Motilal Oswal Securities Limited is under the process of seeking registration under SEBI (Research Analyst) Regulations, 2014.
There are no material disciplinary action that been taken by any regulatory authority impacting equity research analysis activities
Analyst Certification
The views expressed in this research report accurately reflect the personal views of the analyst(s) about the subject securities or issues, and no part of the compensation of the research analyst(s) was, is, or will be
directly or indirectly related to the specific recommendations and views expressed by research analyst(s) in this report. The research analysts, strategists, or research associates principally responsible for preparation
of MOSt research receive compensation based upon various factors, including quality of research, investor client feedback, stock picking, competitive factors and firm revenues
Disclosure of Interest Statement
§
Analyst ownership of the stock
§
Served as an officer, director or employee
EMAMI
No
No
Disclosures
Emami
Regional Disclosures (outside India)
For U.S.
This report is not directed or intended for distribution to or use by any person or entity resident in a state, country or any jurisdiction, where such distribution, publication, availability or use would be contrary to law,
regulation or which would subject MOSt & its group companies to registration or licensing requirements within such jurisdictions.
Motilal Oswal Securities Limited (MOSL) is not a registered broker - dealer under the U.S. Securities Exchange Act of 1934, as amended (the"1934 act") and under applicable state laws in the United States. In
addition MOSL is not a registered investment adviser under the U.S. Investment Advisers Act of 1940, as amended (the "Advisers Act" and together with the 1934 Act, the "Acts), and under applicable state laws in the
United States. Accordingly, in the absence of specific exemption under the Acts, any brokerage and investment services provided by MOSL, including the products and services described herein are not available to or
intended for U.S. persons.
This report is intended for distribution only to "Major Institutional Investors" as defined by Rule 15a-6(b)(4) of the Exchange Act and interpretations thereof by SEC (henceforth referred to as "major institutional
investors"). This document must not be acted on or relied on by persons who are not major institutional investors. Any investment or investment activity to which this document relates is only available to major
institutional investors and will be engaged in only with major institutional investors. In reliance on the exemption from registration provided by Rule 15a-6 of the U.S. Securities Exchange Act of 1934, as amended (the
"Exchange Act") and interpretations thereof by the U.S. Securities and Exchange Commission ("SEC") in order to conduct business with Institutional Investors based in the U.S., MOSL has entered into a chaperoning
agreement with a U.S. registered broker-dealer, Motilal Oswal Securities International Private Limited. ("MOSIPL"). Any business interaction pursuant to this report will have to be executed within the provisions of this
chaperoning agreement.
The Research Analysts contributing to the report may not be registered /qualified as research analyst with FINRA. Such research analyst may not be associated persons of the U.S. registered broker-dealer, MOSIPL,
and therefore, may not be subject to NASD rule 2711 and NYSE Rule 472 restrictions on communication with a subject company, public appearances and trading securities held by a research analyst account.
Motilal Oswal Capital Markets Singapore Pte Limited is acting as an exempt financial advisor under section 23(1)(f) of the Financial Advisers Act(FAA) read with regulation 17(1)(d) of the Financial Advisors
Regulations and is a subsidiary of Motilal Oswal Securities Limited in India. This research is distributed in Singapore by Motilal Oswal Capital Markets Singapore Pte Limited and it is only directed in Singapore to
accredited investors, as defined in the Financial Advisers Regulations and the Securities and Futures Act (Chapter 289), as amended from time to time.
In respect of any matter arising from or in connection with the research you could contact the following representatives of Motilal Oswal Capital Markets Singapore Pte Limited:
Anosh Koppikar
Kadambari Balachandran
Email : anosh.Koppikar@motilaloswal.com
Email : kadambari.balachandran@motilaloswal.com
Contact : (+65)68189232
Contact : (+65) 68189233 / 65249115
Office Address : 21 (Suite 31),16 Collyer Quay,Singapore 04931
For Singapore
13 May 2015
Motilal Oswal Securities Ltd
Motilal Oswal Tower, Level 9, Sayani Road, Prabhadevi, Mumbai 400 025
Phone: +91 22 3982 5500 E-mail: reports@motilaloswal.com
12