20 May 2015
4QFY15 Results Update | Sector:
Consumer
Pidilite Industries
BSE SENSEX
27,837
Bloomberg
Equity Shares (m)
M.Cap. (INR b)/(USD b)
52-Week Range (INR)
1, 6, 12 Rel. Per (%)
Avg Val INRm/Vol ‘000
Free float (%)
S&P CNX
8,423
PIDI IN
512.6
292.2/4.6
638/286
-1/33/61
188/392
30.3
n
CMP: INR570
n
TP: INR560 (-2%)
Neutral
Volume growth decelerates; Margin miss led by one-time higher ad spends
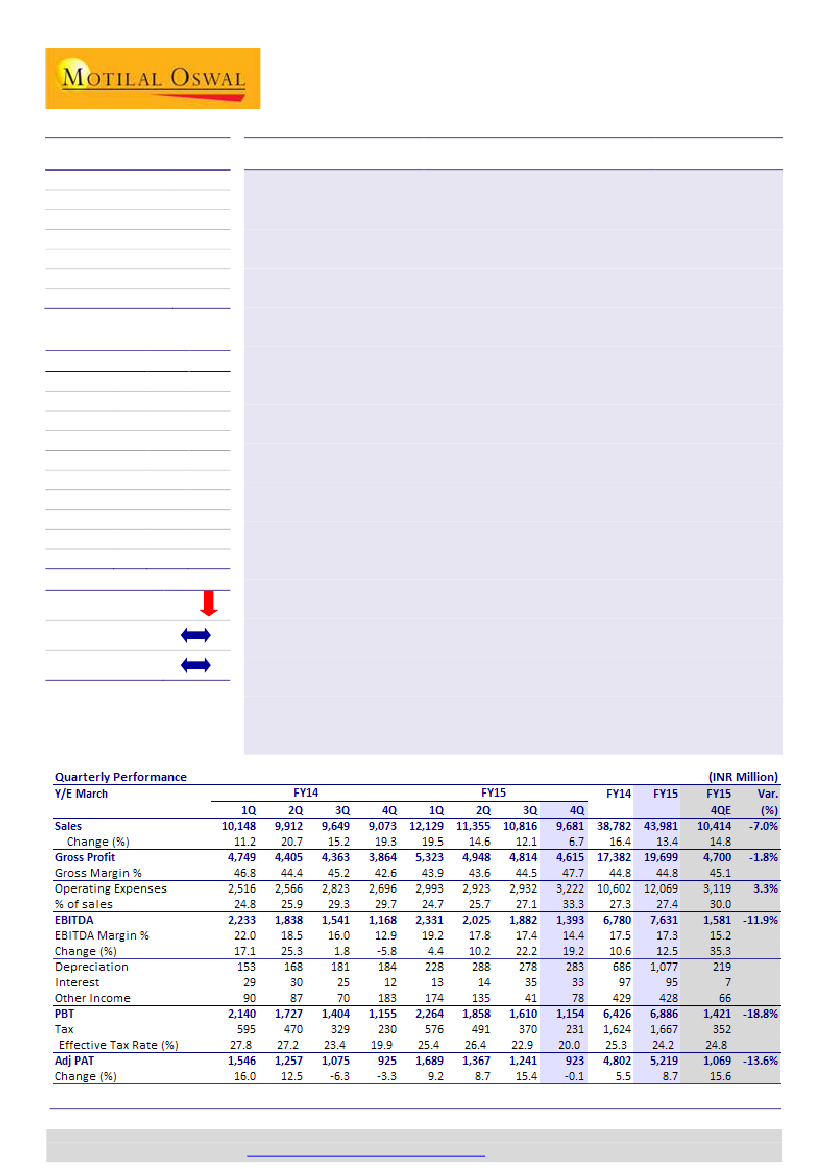
PIDI’s 4QFY15 results
were below estimates, with standalone sales up 6.7% to
INR9.7b (est. of INR10.4b) and muted 3.1% overall volume growth (5.5% volume
growth in consumer bazaar segment). EBITDA was up 19.2% YoY to INR1.4b (est.
of INR1.6b), aided by gross margin expansion. Adj. PAT was flat YoY at INR923m
(est. of INR1b) despite benign base (4QFY14 adj. PAT declined 3.3% YoY).
Gross margin expanded 510bp YoY
to 47.7% (est. of 45.1%), led by benign input
cost and carryover of earlier price hikes. However, higher other expense (up
370bp YoY)—driven by higher brand spends (6.3% in 4Q15 v/s 4.3% in FY15)
during ICC World Cup ’15—curtailed EBITDA margin expansion to 150bp YoY to
14.4% (est. of 15.2%). The management has guided for similar gross margin
expansion in 1QFY16 and flattish ad spends for FY16. Also, it is not contemplating
any price cuts. Thus, we believe that 4Q15 EBITDA miss was a blip due to event-
driven ad spends.
Consolidated performance:
Sales, EBITDA and adj. PAT posted 5.3%, 30% and
10.3% growth, respectively. Imputed subsidiary EBITDA loss declined 60% YoY.
Con-Call Highlights:
a) Rural growth > Urban; b) not contemplating any price cuts;
1QFY16 gross margins will be almost similar to 4Q15 numbers; c) excise duty to
increase 100bp YoY in FY16; d) ad spend to be at FY15 run rate (4.3%); e) FY16
capex to be INR1.75b-INR2b.
Valuation and view:
Barring this quarter, Pidilite’s volume growth in consumer
bazaar segment has remained consistent in the 9-10% band. We cut estimates by
5-6% to incorporate the 4Q miss, but still model for 31% EPS CAGR over FY15-
17E—driven by expected urban demand recovery, benign RM environment and
lower base (during the previous episode of RM deflation, Pidilite delivered an EPS
CAGR of 50% over FY09-11). We are building in 320bps gross margin expansion
over FY15-17E. However, we believe that valuations at 38.8x FY16E and 32.9x
FY17E EPS are rich. Maintain
Neutral
with revised target price of INR560 (32x FY17
EPS, 10% premium to three-year avg. P/E—given expected strong EPS CAGR).
Spike in input costs/currency depreciation is a key risk.
Financials & Valuation (INR Billion)
Y/E MAR
Sales
EBITDA
Adj. PAT
Adj. EPS
(INR)
EPS Gr. (%)
BV/Sh.(INR)
RoE (%)
RoCE (%)
P/E (x)
P/BV (x)
2015 2016E 2017E
43.7
7.6
5.2
10.2
9.9
48.4
23.1
28.2
56.0
11.8
50.8
11.0
7.5
14.7
44.3
57.5
27.7
35.5
38.8
9.9
60.3
12.8
8.9
17.3
17.8
68.2
27.5
35.4
32.9
8.4
n
n
n
Estimate change
TP change
Rating change
5-6%
Gautam Duggad
(Gautam.Duggad@MotilalOswal.com); +91 22 3982 5404
Manish Poddar
(Manish.Poddar@MotilalOswal.com); +91 22 3027 8029
Investors are advised to refer through disclosures made at the end of the Research Report.
Motilal Oswal research is available on
www.motilaloswal.com/Institutional-Equities,
Bloomberg, Thomson Reuters, Factset and S&P Capital.

Pidilite Industries
Key quarterly charts
Exhibit 1: PIDI posted sales growth of 6.7% in 4Q; 7% below our estimates
41.6
23.6
18.8 16.0
29.3
32.6
21.6
Sales growth (%)
27.7
16.7
16.0
11.2
20.7
12.5 15.2
19.3
19.5
9.2
15.4
14.6 12.1
8.7
6.7
-0.1
PAT Growth (%)
15.6
-6.3
-3.3
Source: Company, MOSL
Exhibit 2: Segmental Performance (Standalone)
Segmental
Consumer and Bazaar
Sales (INRm)
Sales Growth (%)
EBIT (INRm)
% Contribution
EBIT Growth %
EBIT margin %
Industrial Products
Sales (INR m)
Sales Growth (%)
EBIT (INRm)
% Contribution
EBIT Growth %
EBIT margin %
1,647
4.5
196
17.3
-22.3
11.9
1,849
11.8
226
10.3
-3.0
12.2
1,705
3.6
166
10.1
-21.9
9.8
1,657
15.0
183
10.5
13.8
11.0
1,872
13.6
232
14.8
18.8
12.4
1,863
0.8
192
7.3
-15.1
10.3
2,162
26.8
247
11.4
48.4
11.4
1,939
17.0
181
10.6
-1.2
9.3
2,193
17.2
184
13.3
-21.0
8.4
2,169
16.4
161
6.3
-16.0
7.4
2,327
7.7
267
11.9
8.2
2,039
5.2
251
11.8
38.8
2,157
-1.6
288
17.7
56.9
4,987
21.7
966
85.3
29.9
19.4
7,437
21.2
1,999
90.9
30.3
26.9
6,645
19.0
1,495
91.1
17.3
22.5
6,794
23.9
1,588
90.9
25.2
23.4
5,867
17.6
1,363
86.9
41.2
23.2
8,417
13.2
2,415
92.6
20.8
28.7
7,883
18.6
1,931
88.9
29.2
24.5
7,822
15.1
1,559
91.6
-1.8
19.9
6,988 10,169
19.1
1,228
88.9
-10.0
17.6
20.8
2,413
95.0
-0.1
23.7
9,135
15.9
1,997
88.7
3.4
21.9
8,803
12.5
1,893
89.5
21.4
21.5
7,668
9.7
1,373
84.4
11.8
17.9
4QFY12 1QFY13 2QFY13 3QFY13 4QFY13 1QFY14 2QFY14 3QFY14 4QFY14 1QFY15 2QFY15 3QFY15 4QFY15
11.5
12.3
13.4
Source: Company, MOSL
Exhibit 3: Gross margin expanded 510bp YoY in 4QFY15
Gross Margins (%)
46.7
44.8 44.8
46.7 46.8
44.4
45.2
42.6
43.9 43.6
44.5
47.7
Exhibit 4: EBITDA margins expanded 150bp YoY led by higher
adspends
EBIDTA Margins (%)
21.0
17.9 18.1
14.8
16.3
22.1
18.5
16.0
12.9
19.2
17.8 17.4
14.4
45.5
Source: Company, MOSL
20 May 2015
2

Pidilite Industries
5.5% volume growth in Consumer Bazaar; margin expansion in Consumer
Bazaar segment
n
n
n
n
n
n
n
Pidilite’s standalone sales grew muted 6.7% YoY to INR 9.7b (lowest since
2QFY10; est. INR10.4b) with volume growth of 5.5% in the Consumer & Bazaar
segment. Total volume growth stood at 3.1% due to decline in Industrial
segment.
Gross margins expanded sharp 510bp YoY to 47.7% (est.45.1%) benefited by
softening in input costs (crude and crude derivatives prices).
Other expenses rose 370bp YoY to 23.2% which were partially offset by staff
costs (down 20bp YoY to 10.1%). Higher other expenses are due to aggressive
brand investments during world cup tournament. Ad spends as % of sales stood
at 6.3% during 4QFY15 as against 4.3% of FY15. Management has guided for
similar adspends for FY16.
Thus, EBITDA margins expanded relatively modest 150bp YoY to 14.4% (est.
15.2%). EBITDA grew 19.2% YoY to INR1.4b (est. INR1.6b).
However higher depreciation (up 54% YoY) and lower other income (down 57%
YoY) dragged Adj. PAT to INR923m, flat YoY (14% below estimates) on a benign
base (4Q14 PAT had declined 3.3% YoY).
Reported PAT declined 12.9%YoY to INR772m due to exceptional items
(provision for diminution in value of investment in subsidiary of INR127m).
FY15 Highlights:
Sales, EBITDA and Adj. PAT grew 13.5%, 12.5% and 8.7%
respectively. Gross margin stayed flat while EBITDA margin contracted 20bp
YoY.
Consumer & Bazaar sales up 9.7%; EBIT margins up 30bp
n
n
Consumer bazaar segment revenues were up 9.7% YoY with 5.5% volume
growth. Industrial segment posted revenue decline of 1.6% YoY.
Consumer bazaar segmental EBIT margins were up 30bp YoY to 17.9%. EBIT
grew 11.8% to INR1.4b.Industrial segment margins expanded 500bp to 13.4%
driving 56.9% segmental EBIT growth.
Consolidated performance highlights
n
n
n
Consolidated Sales, EBITDA and Adj. PAT posted growth of 5.3%, 30% and 10.3%
respectively. Gross and EBITDA margin expanded 380bp and 240bp resp to
46.8% and 12.8%, resp.
Consumer & bazaar segment reported 7.7% sales growth and 18.3% EBIT growth
with 140bp margin expansion to 15.1%. Industrial segment reported 1.6% sales
decline and 56.9% EBIT growth with 500bp margin expansion to 13.4%.
Imputed subsidiary profitability improved sharply with ~60% decline in
operating loss despite revenue decline of 10% YoY.
20 May 2015
3

Pidilite Industries
ConCall Highlights
Quarterly Performance
n
4QFY15 Volume growth in Consumer Bazaar:
5.5%. Total volume growth was
3.1% as Industrial business saw volume and value decline.
n
FY15 volume growth:
8.7%
n
Consumer Bazaar:
Slowdown is even across all sub-segments.
n
Rural growing > urban.
n
B2C grown faster than B2B.
n
27% increase in other expenses is driven by higher adspends – long advertising
campaign during ICC Cricket World Cup.
n
Overseas:
For FY15 EBITDA came in at INR 127.8mn vs. INR 44mn in FY14
n
North America:
Nominal sales growth. Car care business declined 14% due to
adverse weather while Art Materials business grew 22. EBITDA loss for 4Q15
was INR 11.2mn vs. INR 8mn.
n
South America:
Sales up 26.9% driven by low base and margins improved
340bps YoY due to price hikes. Loss at EBITDA level declined to INR 23mn vs. INR
96m YoY (certain one offs due to provisions in base).
n
Middle East and Africa:
Sales up 290% (distribution business taken over from
3rd party). Adjusted for this, revenues were flat. Egypt sales up 6.2% while
losses in ME&A was higher.
n
SE and SEASIA:
Sales up 9% while EBITDA up 50% due to mix improvement.
n
US improving, Brazil challenged (reduced cost significantly)
Raw Materials/Operating Margins
n
Gross margins:
1QFY16 margins could resemble 4QFY15.
n
VAM prices:
Between USD1,000-1,080.
n
Pricing action:
Not contemplating any price cuts.
n
Price changes do not impact demand much. Last time price cut was taken was in
2009-10 and magnitude of cut was 2-3%.
n
Fevicol pricing 10% higher than competition.
n
Adspends for FY15:
4.2-4.3% - not looking at meaningful change in this in FY16.
In 4Q15 the adspends was 6.3%.
n
No perceptible shift in market share.
Guidance
n
Capex:
INR 1.75-2b in FY16
n
Tax rate:
3 units in Himachal completed 10 year tax holiday. For FY16 it will be
27%.
n
Excise duty:
will go up by 100bps. FY15 excise was 6% of sales.
n
Elastomer project: Status quo continues. Further outlay will be made on the
project only if strategic partner is inducted.
20 May 2015
4

Pidilite Industries
Valuation and view
n
n
n
n
Barring this quarter, Pidilite’s volume growth in Consumer Bazaar segment has
remained consistent in 9-10% band.
We are revising our estimates downwards by 5-6% for FY16/17 to incorporate
4Q miss but still model for 31% EPS CAGR over FY15-17E. This earnings
momentum will be driven by urban demand recovery, benign input costs (VAM
prices at US$1000-1100 band vs. US$ 1500 six months back) and lower base of
earnings (7% EPS CAGR over FY13-15). In the previous episode of RM cost
deflation, Pidilite’s earnings expanded at 50% CAGR during FY09-11.
Pidilite will be one of the biggest beneficiaries of RM correction, in our view. We
note during FY09-10 crude correction cycle PIDI’s gross margins expanded
690bp YoY though it was also partially aided by excise cuts. We are building in
320bps gross margin expansion over FY15-17E.
At the CMP, the stock trades at 38.8x FY16E and 32.9x FY17E EPS are rich and
discount the positives adequately in our view. Maintain
Neutral
with revised
target price of INR560 (32x FY17 EPS, 10% premium to 3 year average P/E).
Exhibit 5: Cut estimates ~6% to incorporate 4Q15 miss led by higher adspends (INR m)
New
FY16E
FY17E
50,798
60,307
11,008
12,843
7,562
8,932
Old
FY16E
53261
11503
8089
FY17E
63473
13385
9481
% Change
FY16E
FY17E
-4.6%
-5.0%
-4.3%
-4.0%
-6.5%
-5.8%
Source: Company, MOSL
Net Sales
EBITDA
Adjusted PAT
Exhibit 6: PIDI P/E (x): Sharp re-rating in last 12 months
45.0
37.0
29.0
21.0
13.0
5.0
21.2
7.3
PE (x)
Min(x)
Peak(x)
PE (x)
Avg(x)
Peak(x)
38.3
36.0
Exhibit 7: PIDI P/E premium vs. Sensex
150
100
50
0
-50
-100
32.4
Pidilite Inds. PE Relative to Sensex PE (%)
LPA (%)
126.3
Source: Company, MOSL
20 May 2015
5

Pidilite Industries
Exhibit 8: Valuation Metrics of coverage universe
Company
Consumer
Asian Paints
Britannia
Colgate
Dabur*
Emami*
Godrej Consumer
GSK Consumer
Hind. Unilever
ITC
Jyothy Labs
Marico*
Nestle
Pidilite Inds.
Radico Khaitan
United Spirits
Retail
Jubilant Foodworks
Shopper's Stop
Titan Company
Reco
Price Mkt Cap EPS Growth YoY (%)
P/E (x)
EV/EBITDA (x)
ROE (%) Div. (%)
(INR) (USD M) FY15E FY16E FY17E FY15E FY16E FY17E FY15E FY16E FY17E FY15E FY15E
771
2,332
2,020
264
1,030
1,167
6,394
855
332
253
411
6,949
570
88
3,728
1,759
394
377
11,587
4,365
4,303
7,252
3,661
6,221
4,213
28,977
41,425
717
4,155
10,497
4,579
182
8,488
1,803
507
5,246
15.8 31.3
29.0 32.7
13.9 18.3
16.5 25.9
21.7 25.1
19.6 38.9
-13.5 23.2
5.5 18.0
11.0 10.9
15.2 88.0
18.1 21.2
6.8 23.0
9.9 44.9
-10.4 19.2
LP 151.7
4.5
8.1
11.1
64.3
60.5
15.4
23.4 52.0
25.0 55.6
21.5 49.1
15.8 43.1
22.0 47.7
21.6 45.0
20.5 46.1
18.1 48.2
14.9 27.1
3.9 46.5
24.4 46.2
18.6 53.4
18.1 56.0
20.3 15.4
43.5 215.1
42.5
44.6
22.9
93.2
80.5
40.7
39.6
41.9
41.5
34.3
38.1
32.4
37.4
40.8
24.4
24.7
38.1
43.4
38.7
12.9
85.5
56.7
50.1
35.3
32.1
33.6
34.2
29.6
31.3
26.7
31.0
34.6
21.3
23.8
30.7
36.6
32.7
10.7
59.6
39.8
34.7
28.7
35.0
40.6
32.9
34.8
42.0
31.9
34.1
71.6
18.3
32.3
30.4
31.9
37.1
10.6
73.4
43.7
17.8
30.9
26.5
29.8
27.0
27.2
32.6
23.9
26.7
59.1
16.5
20.5
24.6
25.8
25.3
8.8
50.4
27.8
14.3
26.5
21.2
23.3
21.6
23.3
26.4
20.2
21.9
48.5
14.5
16.7
19.6
21.9
21.2
7.2
39.2
20.2
11.6
21.2
32.4
51.2
88.0
35.9
45.3
20.4
29.6
109.6
35.2
13.1
33.5
48.2
23.1
8.9
8.0
18.8
5.4
27.2
0.9
0.7
1.5
0.8
0.7
0.6
0.9
1.6
2.2
1.2
0.6
0.9
0.6
1.0
0.0
0.1
0.2
0.7
Neutral
Buy
Neutral
Neutral
Buy
Neutral
Neutral
Neutral
Neutral
Buy
Neutral
Neutral
Neutral
Buy
Buy
Buy
Neutral
Neutral
Note: For Nestle FY15E means CY14
Source: Company, MOSL
20 May 2015
6

Pidilite Industries
Story in charts
Exhibit 9: Revenues CAGR of 17.4% over FY14-17E
Revenues (INR mn)
21.8
18.3 19.1
14.5
9.6
Revenue growth (%)
16.1
12.6
18.7
16.0
11.0
13.0
11.0
11.0
7.5
Exhibit 10: Volume growth of 5.5% in 4Q
Volume growth (%)
15.0
11.0 12.0
13.0
10.0
7.0
5.5
15.9
FY09
FY10
FY11
FY12
FY13
FY14
FY15 FY16E FY17E
Source: Company, MOSL
Exhibit 11: Gross margins expansion of 320bp over FY15-17E,
led by benign input cost...
49.0
47.6
45.7
44.3
42.1
44.9
45.0
Gross Margin (%)
48.5
48.2
Exhibit 12: .. .EBITDA margins expansion of 390bp over
FY15-17E
EBITDA Margin (%)
20.4
21.7
20.1
17.3
13.5
18.8
17.5
17.4
21.3
FY09 FY10 FY11 FY12 FY13 FY14 FY15 FY16E FY17E
Source: Company, MOSL
FY09 FY10 FY11 FY12 FY13 FY14 FY15 FY16E FY17E
Source: Company, MOSL
Exhibit 13: PAT to grow at 30.8% CAGR over FY14-FY17E
PAT (INR mn)
100.5
50.7
7.1
3.5
-22.0
FY09
FY10
FY11
FY12
FY13
FY14
FY15 FY16E FY17E
Source: Company, MOSL
10.0
1.7
18.1
PAT growth (%)
Exhibit 14: Return Ratios (%)
35.1
31.7
27.6
21.3
RoE
29.3
25.2
23.1
37.8
27.8
27.7
FY09 FY10 FY11 FY12 FY13 FY14 FY15 FY16E FY17E
Source: Company, MOSL
20 May 2015
7

Pidilite Industries
Financials and valuations
Income Statement
Y/E March
Net Sales
Change (%)
Raw Materials
Gross Profit
Margin (%)
Operating Expenses
EBITDA
Change (%)
Margin (%)
Depreciation
Int. and Fin. Charges
Other Income
Profit before Taxes
Change (%)
Margin (%)
Tax
Tax Rate (%)
Adj PAT
Change (%)
Margin (%)
Exceptional/Prior Period inc
Reported PAT
FY10
19,539
9.6
9958
9581
49.0
5597
3,984
65.8
20.4
464
286
55
3,289
101.5
16.8
354
10.8
2935
100.5
15.0
0
2,935
FY11
23,799
21.8
12472
11327
47.6
6546
4,780
20.0
20.1
444
268
157
4,225
28.5
17.8
936
22.2
3289
12.1
13.8
250
3,039
FY12
28,163
18.3
15674
12489
44.3
7626
4,863
1.7
17.3
479
245
428
4,566
8.1
16.2
1,096
24.0
3470
5.5
12.3
126
3,344
FY13
33,539
19.1
18206
15333
45.7
9021
6,312
29.8
18.8
532
80
436
6,136
34.4
18.3
1,588
25.9
4548
31.1
13.6
-59
4,608
FY14
38,859
15.9
21401
17458
44.9
10653
6,805
7.8
17.5
686
97
353
6,375
3.9
16.4
1,624
25.5
4751
4.5
12.2
65
4,686
FY15
43,748
12.6
24049
19699
45.0
12069
7,631
12.1
17.4
1,077
95
428
6,886
8.0
15.7
1,667
24.2
5219
9.9
11.9
201
5,019
FY16E
50,798
16.1
26146
24653
48.5
13644
11,008
44.3
21.7
1,140
90
472
10,250
48.8
20.2
2,716
26.5
7533
44.3
14.8
0
7,533
(INR Million)
FY17E
60,307
18.7
31222
29085
48.2
16242
12,843
16.7
21.3
1,200
102
533
12,074
17.8
20.0
3,200
26.5
8875
17.8
14.7
0
8,875
Balance Sheet
Y/E March
Share Capital
Reserves
Net Worth
Loans
Deferred Liability
Capital Employed
Gross Block
Less: Accum. Depn.
Net Fixed Assets
Capital WIP
Investments
Current
Non-current
Curr. Assets, L&A
Inventory
Account Receivables
Cash and Bank Balance
Others
Curr. Liab. and Prov.
Account Payables
Provisions
Net Current Assets
Application of Funds
E: MOSL Estimates
FY10
506
8,880
9,386
4,214
415
14,015
8,064
3,889
4,175
2,774
5,108
2,634
2,474
6,238
2,506
2,388
328
1,015
4,279
3,302
977
1,959
14,015
FY11
506
10,889
11,395
2,867
410
14,672
8,720
4,310
4,410
3,331
4,656
2,300
2,356
7,596
3,544
2,866
273
913
5,321
4,137
1,184
2,275
14,672
FY12
508
13,209
13,717
2,629
454
16,800
9,723
4,764
4,959
3,713
3,328
909
2,419
11,005
3,963
3,261
2,577
1,204
6,206
4,925
1,281
4,799
16,799
FY13
513
16,812
17,324
600
484
18,408
10,607
5,270
5,337
4,087
5,469
2,846
2,623
10,892
4,512
3,668
1,368
1,345
7,378
5,199
2,179
3,514
18,408
FY14
513
19,883
20,395
77
508
20,980
12,055
5,942
6,113
4,311
5,738
2,491
3,247
12,730
5,082
4,536
1,452
1,660
7,912
5,871
2,041
4,818
20,980
FY15
513
24,321
24,834
77
534
25,444
13,255
6,955
6,301
3,906
7,478
3,902
3,576
16,700
7,318
5,488
1,931
1,963
8,940
6,674
2,266
7,760
25,444
FY16E
513
28,987
29,500
90
559
30,149
15,255
8,095
7,160
3,906
9,968
6,242
3,726
19,730
8,175
6,096
3,281
2,178
10,614
7,361
3,253
9,116
30,150
(INR Million)
FY17E
513
34,467
34,980
100
585
35,665
16,755
9,295
7,460
3,906
14,046
10,170
3,876
22,944
9,541
7,074
3,938
2,391
12,690
8,837
3,853
10,254
35,665
20 May 2015
8

Pidilite Industries
Financials and valuations
Ratios
Y/E March
Basic (INR)
EPS
Cash EPS
BV/Share
DPS
Payout %
Valuation (x)
P/E
Cash P/E
EV/Sales
EV/EBITDA
P/BV
Dividend Yield (%)
Return Ratios (%)
RoE
RoCE
Working Capital Ratios
Debtor (Days)
Creditor (Days)
Asset Turnover (x)
Leverage Ratio
Debt/Equity (x)
FY10
5.8
8.8
18.5
1.5
25.9
98.3
64.9
14.7
72.1
30.7
0.3
35.1
25.7
45
77
3.2
0.4
FY11
6.5
10.3
22.5
1.8
26.9
87.7
55.2
12.0
59.9
25.3
0.3
31.7
30.2
44
79
3.6
0.3
FY12
6.8
10.5
27.0
1.9
27.8
83.4
54.2
10.2
58.8
21.1
0.3
27.6
27.9
42
77
2.9
0.2
29.3
32.8
40
70
3.8
0.0
FY13
8.9
13.4
33.8
2.6
29.3
FY14
9.3
14.6
39.8
2.7
29.1
61.5
39.0
7.3
41.9
14.3
0.5
25.2
31.1
43
67
3.6
0.0
FY15
10.2
17.0
48.4
3.2
30.9
56.0
33.6
6.5
37.1
11.8
0.6
23.1
28.2
46
67
3.1
0.0
FY16E
14.7
23.7
57.5
4.8
32.5
38.8
24.1
5.5
25.4
9.9
0.8
27.7
35.5
44
68
3.1
0.0
FY17E
17.3
27.4
68.2
5.7
32.7
32.9
20.8
4.6
21.4
8.4
1.0
27.5
35.4
43
68
3.4
0.0
Cash Flow Statement
Y/E March
PBT before Extra Ord
Add: Depreciation
Interest Paid
Less: Taxes Paid
Interest income
(Incr)/Decr in WC
CF from Operations
Extra ordinary items
CFO after extraordinary
Incr in FA
Free Cash Flow
Pur of Investments
CF from Invest.
Change in Networth
Incr in Debt
Dividend Paid
Interest Paid
Others
CF from Fin. Activity
Incr/Decr of Cash
Add: Opening Balance
Closing Balance
E: MOSL Estimates
(INR Million)
FY10
3,289
464
286
354
55
1,316
4,945
0
4,945
-680
4,266
-2,701
-3,380
-1,796
-1,366
885
-286
55
-2,508
-942
1,271
328
FY11
4,225
444
268
936
157
-372
3,472
-250
3,222
-1,236
1,987
452
-784
-2,065
-1,347
1,029
-268
157
-2,493
-55
328
273
FY12
4,566
479
245
1,096
428
-219
3,548
-126
3,421
-1,411
2,010
1,328
-83
-2,100
-239
1,122
-245
428
-1,034
2,304
273
2,578
FY13
6,136
532
80
1,588
436
76
4,800
59
4,859
-1,284
3,575
-2,141
-3,425
-2,530
-2,029
1,559
-80
437
-2,642
-1,209
2,577
1,369
FY14
6,375
686
97
1,624
353
-1,221
3,961
-65
3,896
-1,686
2,210
-268
-1,954
-3,210
-523
1,619
-97
353
-1,858
84
1,368
1,452
FY15
6,886
1,077
95
1,667
428
-2,463
3,501
-201
3,301
-859
2,441
-1,740
-2,599
-2,492
0
1,937
-95
428
-221
480
1,452
1,932
FY16E
10,250
1,140
90
2,716
472
-6
8,286
0
8,286
-2,000
6,286
-2,490
-4,490
-5,708
13
2,867
-90
472
-2,446
1,350
1,931
3,281
FY17E
12,074
1,200
102
3,200
533
-481
9,162
0
9,162
-1,500
7,662
-4,078
-5,578
-6,764
10
3,395
-102
534
-2,927
657
3,281
3,938
20 May 2015
9

Pidilite Industries
Corporate profile: Pidilite Industries
Company description
Pidilite Industries is the largest branded adhesives
player in India, with an iconic brand like Fevicol.
Apart from a strong presence in adhesives,
company has expanded into emerging segments
like mechanized joinery, modular furniture,
flooring, automotive care and water proofing
through Dr Fixit and Roff.
Exhibit 15: Sensex rebased
Exhibit 16: Shareholding pattern (%)
Mar-15
Promoter
DII
FII
Others
69.7
4.3
15.4
10.6
Dec-14
69.8
4.1
15.5
10.6
Mar-14
70.1
3.6
15.5
10.8
Exhibit 17: Top holders
Holder Name
Genesis Indian Investment Company Limited -General
Government Pension Fund Global
% Holding
7.7
1.1
Note: FII Includes depository receipts
Exhibit 18: Top management
Name
M B Parekh
N K Parekh
Designation
Chairman &Managing Director
Vice Chairman
Exhibit 19: Directors
Name
M B Parekh
N K Parekh
N J Jhaveri*
Sanjeev Aga*
Bharat Puri*
Ranjan Kapur*
Name
Bansi S Mehta*
J L Shah
A B Parekh
A N Parekh
Uday Khanna
Meera Shankar
*Independent
Exhibit 20: Auditors
Name
Delloite Haskins & Sells
Mahajan & Aibara
Type
Statutory
Internal
Exhibit 21: MOSL forecast v/s consensus
EPS
(INR)
FY16
FY17
MOSL
forecast
14.7
17.3
Consensus
forecast
13.9
17.2
Variation
(%)
5.5
0.4
20 May 2015
10

Pidilite Industries
NOTES
20 May 2015
11

This document has been prepared by Motilal Oswal Securities Limited (hereinafter referred to as Most) to provide information about the company(ies) and/sector(s), if any, covered in the report and may be
distributed by it and/or its affiliated company(ies). This report is for personal information of the selected recipient/s and does not construe to be any investment, legal or taxation advice to you. This research report does
not constitute an offer, invitation or inducement to invest in securities or other investments and Motilal Oswal Securities Limited (hereinafter referred as MOSt) is not soliciting any action based upon it. This report is not
for public distribution and has been furnished to you solely for your general information and should not be reproduced or redistributed to any other person in any form. This report does not constitute a personal
recommendation or take into account the particular investment objectives, financial situations, or needs of individual clients. Before acting on any advice or recommendation in this material, investors should consider
whether it is suitable for their particular circumstances and, if necessary, seek professional advice. The price and value of the investments referred to in this material and the income from them may go down as well as
up, and investors may realize losses on any investments. Past performance is not a guide for future performance, future returns are not guaranteed and a loss of original capital may occur.
MOSt and its affiliates are a full-service, integrated investment banking, investment management, brokerage and financing group. We and our affiliates have investment banking and other business relationships with a
some companies covered by our Research Department. Our research professionals may provide input into our investment banking and other business selection processes. Investors should assume that MOSt and/or
its affiliates are seeking or will seek investment banking or other business from the company or companies that are the subject of this material and that the research professionals who were involved in preparing this
material may educate investors on investments in such business. The research professionals responsible for the preparation of this document may interact with trading desk personnel, sales personnel and other
parties for the purpose of gathering, applying and interpreting information. Our research professionals are paid on the profitability of MOSt which may include earnings from investment banking and other business.
MOSt generally prohibits its analysts, persons reporting to analysts, and members of their households from maintaining a financial interest in the securities or derivatives of any companies that the analysts cover.
Additionally, MOSt generally prohibits its analysts and persons reporting to analysts from serving as an officer, director, or advisory board member of any companies that the analysts cover. Our salespeople, traders,
and other professionals or affiliates may provide oral or written market commentary or trading strategies to our clients that reflect opinions that are contrary to the opinions expressed herein, and our proprietary
trading and investing businesses may make investment decisions that are inconsistent with the recommendations expressed herein. In reviewing these materials, you should be aware that any or all of the foregoing
among other things, may give rise to real or potential conflicts of interest. MOSt and its affiliated company(ies), their directors and employees and their relatives may; (a) from time to time, have a long or short position
in, act as principal in, and buy or sell the securities or derivatives thereof of companies mentioned herein. (b) be engaged in any other transaction involving such securities and earn brokerage or other compensation
or act as a market maker in the financial instruments of the company(ies) discussed herein or act as an advisor or lender/borrower to such company(ies) or may have any other potential conflict of interests with
respect to any recommendation and other related information and opinions.; however the same shall have no bearing whatsoever on the specific recommendations made by the analyst(s), as the recommendations
made by the analyst(s) are completely independent of the views of the affiliates of MOSt even though there might exist an inherent conflict of interest in some of the stocks mentioned in the research report
Reports based on technical and derivative analysis center on studying charts company's price movement, outstanding positions and trading volume, as opposed to focusing on a company's fundamentals and, as
such, may not match with a report on a company's fundamental analysis. In addition MOST has different business segments / Divisions with independent research separated by Chinese walls catering to different set
of customers having various objectives, risk profiles, investment horizon, etc, and therefore may at times have different contrary views on stocks sectors and markets.
Unauthorized disclosure, use, dissemination or copying (either whole or partial) of this information, is prohibited. The person accessing this information specifically agrees to exempt MOSt or any of its affiliates or
employees from, any and all responsibility/liability arising from such misuse and agrees not to hold MOSt or any of its affiliates or employees responsible for any such misuse and further agrees to hold MOSt or any of
its affiliates or employees free and harmless from all losses, costs, damages, expenses that may be suffered by the person accessing this information due to any errors and delays. The information contained herein is
based on publicly available data or other sources believed to be reliable. Any statements contained in this report attributed to a third party represent MOSt’s interpretation of the data, information and/or opinions
provided by that third party either publicly or through a subscription service, and such use and interpretation have not been reviewed by the third party. This Report is not intended to be a complete statement or
summary of the securities, markets or developments referred to in the document. While we would endeavor to update the information herein on reasonable basis, MOSt and/or its affiliates are under no obligation to
update the information. Also there may be regulatory, compliance, or other reasons that may prevent MOSt and/or its affiliates from doing so. MOSt or any of its affiliates or employees shall not be in any way
responsible and liable for any loss or damage that may arise to any person from any inadvertent error in the information contained in this report. MOSt or any of its affiliates or employees do not provide, at any time,
any express or implied warranty of any kind, regarding any matter pertaining to this report, including without limitation the implied warranties of merchantability, fitness for a particular purpose, and non-infringement.
The recipients of this report should rely on their own investigations.
This report is intended for distribution to institutional investors. Recipients who are not institutional investors should seek advice of their independent financial advisor prior to taking any investment decision based on
this report or for any necessary explanation of its contents.
Most and it’s associates may have managed or co-managed public offering of securities, may have received compensation for investment banking or merchant banking or brokerage services, may have received any
compensation for products or services other than investment banking or merchant banking or brokerage services from the subject company in the past 12 months.
Most and it’s associates have not received any compensation or other benefits from the subject company or third party in connection with the research report.
Subject Company may have been a client of Most or its associates during twelve months preceding the date of distribution of the research report
MOSt and/or its affiliates and/or employees may have interests/positions, financial or otherwise of over 1 % at the end of the month immediately preceding the date of publication of the research in the securities
mentioned in this report. To enhance transparency, MOSt has incorporated a Disclosure of Interest Statement in this document. This should, however, not be treated as endorsement of the views expressed in the
report.
Motilal Oswal Securities Limited is under the process of seeking registration under SEBI (Research Analyst) Regulations, 2014.
There are no material disciplinary action that been taken by any regulatory authority impacting equity research analysis activities
Analyst Certification
The views expressed in this research report accurately reflect the personal views of the analyst(s) about the subject securities or issues, and no part of the compensation of the research analyst(s) was, is, or will be
directly or indirectly related to the specific recommendations and views expressed by research analyst(s) in this report. The research analysts, strategists, or research associates principally responsible for preparation
of MOSt research receive compensation based upon various factors, including quality of research, investor client feedback, stock picking, competitive factors and firm revenues
Disclosure of Interest Statement
§
Analyst ownership of the stock
§
Served as an officer, director or employee
PIDILITE INDUSTRIES LTD
No
No
Disclosures
Pidilite Industries
Regional Disclosures (outside India)
For U.S.
This report is not directed or intended for distribution to or use by any person or entity resident in a state, country or any jurisdiction, where such distribution, publication, availability or use would be contrary to law,
regulation or which would subject MOSt & its group companies to registration or licensing requirements within such jurisdictions.
Motilal Oswal Securities Limited (MOSL) is not a registered broker - dealer under the U.S. Securities Exchange Act of 1934, as amended (the"1934 act") and under applicable state laws in the United States. In
addition MOSL is not a registered investment adviser under the U.S. Investment Advisers Act of 1940, as amended (the "Advisers Act" and together with the 1934 Act, the "Acts), and under applicable state laws in the
United States. Accordingly, in the absence of specific exemption under the Acts, any brokerage and investment services provided by MOSL, including the products and services described herein are not available to or
intended for U.S. persons.
This report is intended for distribution only to "Major Institutional Investors" as defined by Rule 15a-6(b)(4) of the Exchange Act and interpretations thereof by SEC (henceforth referred to as "major institutional
investors"). This document must not be acted on or relied on by persons who are not major institutional investors. Any investment or investment activity to which this document relates is only available to major
institutional investors and will be engaged in only with major institutional investors. In reliance on the exemption from registration provided by Rule 15a-6 of the U.S. Securities Exchange Act of 1934, as amended (the
"Exchange Act") and interpretations thereof by the U.S. Securities and Exchange Commission ("SEC") in order to conduct business with Institutional Investors based in the U.S., MOSL has entered into a chaperoning
agreement with a U.S. registered broker-dealer, Motilal Oswal Securities International Private Limited. ("MOSIPL"). Any business interaction pursuant to this report will have to be executed within the provisions of this
chaperoning agreement.
The Research Analysts contributing to the report may not be registered /qualified as research analyst with FINRA. Such research analyst may not be associated persons of the U.S. registered broker-dealer, MOSIPL,
and therefore, may not be subject to NASD rule 2711 and NYSE Rule 472 restrictions on communication with a subject company, public appearances and trading securities held by a research analyst account.
Motilal Oswal Capital Markets Singapore Pte Limited is acting as an exempt financial advisor under section 23(1)(f) of the Financial Advisers Act(FAA) read with regulation 17(1)(d) of the Financial Advisors
Regulations and is a subsidiary of Motilal Oswal Securities Limited in India. This research is distributed in Singapore by Motilal Oswal Capital Markets Singapore Pte Limited and it is only directed in Singapore to
accredited investors, as defined in the Financial Advisers Regulations and the Securities and Futures Act (Chapter 289), as amended from time to time.
In respect of any matter arising from or in connection with the research you could contact the following representatives of Motilal Oswal Capital Markets Singapore Pte Limited:
Anosh Koppikar
Kadambari Balachandran
Email : anosh.Koppikar@motilaloswal.com
Email : kadambari.balachandran@motilaloswal.com
Contact : (+65)68189232
Contact : (+65) 68189233 / 65249115
Office Address : 21 (Suite 31),16 Collyer Quay,Singapore 04931
For Singapore
20 May 2015
Motilal Oswal Securities Ltd
Motilal Oswal Tower, Level 9, Sayani Road, Prabhadevi, Mumbai 400 025
Phone: +91 22 3982 5500 E-mail: reports@motilaloswal.com
12