21 May 2015
4QFY15 Results Update | Sector:
Consumer
Britannia Industries
BSE SENSEX
27,809
Bloomberg
Equity Shares (m)
M.Cap. (INR b) / (USD b)
52-Week Range (INR)
1, 6, 12 Rel. Per (%)
Avg Val. (INRm)/Vol ‘000
Free float (%)
Financials & Valuation (INR b)
Y/E MAR
Sales
EBITDA
Adj. PAT
Adj. EPS(INR)
EPS Gr. (%)
BV/Sh.(INR)
RoE (%)
RoCE (%)
P/E (x)
P/BV (x)
2015 2016E 2017E
77.8
7.8
5.7
47.8
47.0
61.9
58.8
47.8
25.9
89.2 103.9
11.2
7.9
66.0
38.1
62.4
66.8
34.7
18.5
13.1
9.4
77.9
18.2
54.0
60.1
29.3
13.8
S&P CNX
8,421
BRIT IN
119.5
273/4.3
2,405/829
6/38/158
285/176
49.2
CMP: INR2285
TP: INR2,600 (+14%)
Buy
Significant EBITDA beat; consistent delivery of key strategic priorities
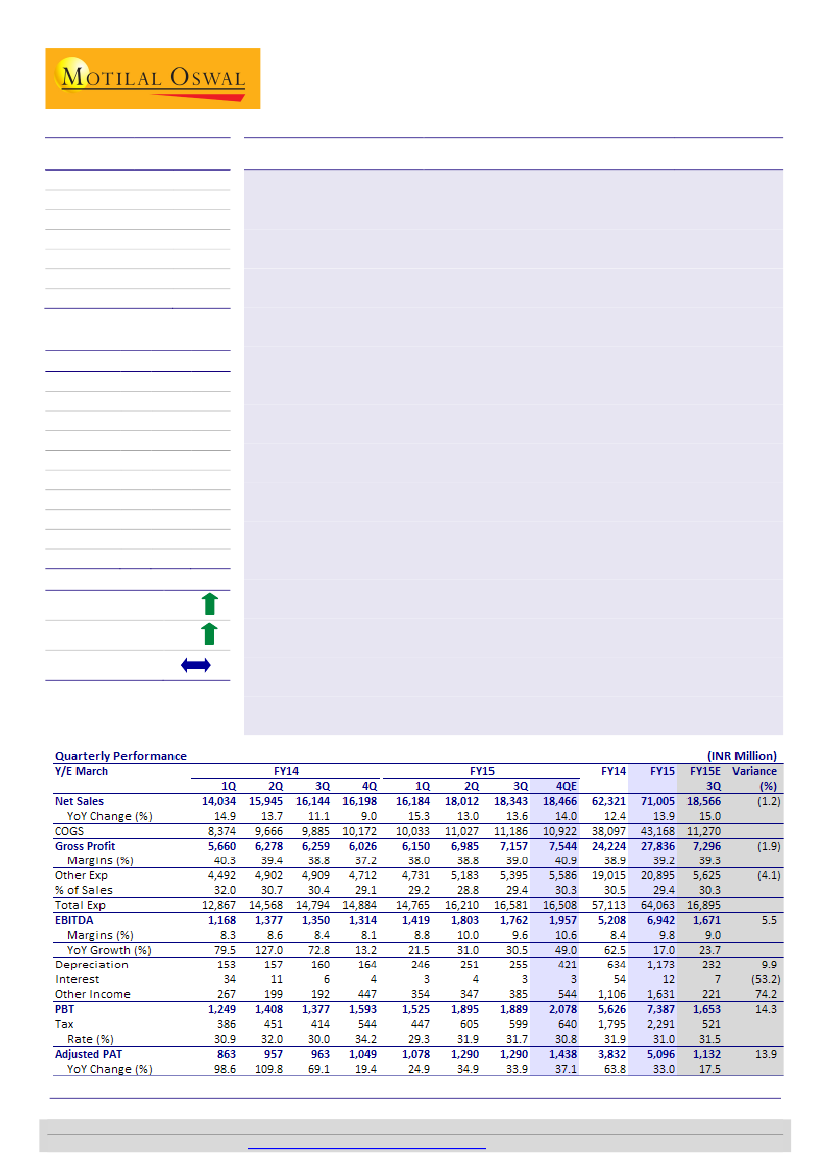
Handsome beat:
Britannia’s 4QFY15 performance was ahead of estimates and
once again underscored the superior execution of its premiumization and cost
containment strategy. Sales, EBITDA and PAT posted 14%, 49% and 37.2% growth
YoY to INR 18.5b, INR 1.96b and INR 1.43b vs. our expectations of INR 18.5b, INR
1.75b and INR 1.37b resp. We estimate Biscuits volume growth of ~7%, healthy in
the context of challenging demand environment. This solid performance was
despite of 50% increase in adspends (albeit on lower base) and near 2.6x increase
in depreciation expenses (additional impact of INR 270m for the quarter).
Quality of growth impeccable:
Performance was led by gross margin expansion of
360bp YoY to 40.9% (est. 38.7%). Adspends went up 50% on low base (up 220bp
to 9.2%) while operating leverage and tight control on fixed costs drove 40bp and
70bp decline in conversion cost and other expenses to 8% and 10.6%, resp.
Consolidated and subsidiary highlights:
Sales, EBITDA and Adj. PAT posted 14.3%,
66% and 55.4% YoY growth, respectively in 4QFY15. Gross margins (41.5%)
expanded 4300bp YoY while operating margins (10.9%) expanded 340bps YoY.
Britannia closed FY15 with sales, EBITDA and PAT growth of 13.8%, 43.3% and
43%, resp – best FY15 performance in our consumer universe.
Remains amongst our top two ideas:
We upgrade our estimates by 6-8% in
FY16/17E to factor in better than estimated margins. We expect FY16 to benefit
from premiumization (3 premium products launched in last 6 months, more
planned) and RM tailwinds (Wheat, Sugar). We also move our model to
consolidated numbers as subs. EBITDA is now 11% of consol EBITDA. We estimate
30% and 28% EBITDA and PAT CAGR over FY15-17E. Retain
Buy
with a revised TP
of INR2,600 (33x FY17 Cons. EPS, 10% premium to one year average P/E). Unlike
other companies in our universe we do not use 3 year average P/E for Britannia as
complexion of Britannia’s P&L has changed meaningfully since FY13. Valuations,
while rich, are backed by superior execution and consistent earnings delivery.
Upward spike in RM and slowdown in rural consumption are near term risks.
88.1 123.4 165.1
Estimate change
TP change
Rating change
6-8%
18%
Gautam Duggad
(Gautam.Duggad@MotilalOswal.com); +91 22 3982 5404
Manish Poddar
(Manish.Poddar@MotilalOswal.com); +91 22 3027 8029
Investors are advised to refer through disclosures made at the end of the Research Report.
Motilal Oswal research is available on
www.motilaloswal.com/Institutional-Equities,
Bloomberg, Thomson Reuters, Factset and S&P Capital.