22 May 2015
4QFY15 Result Update | Sector: NBFC
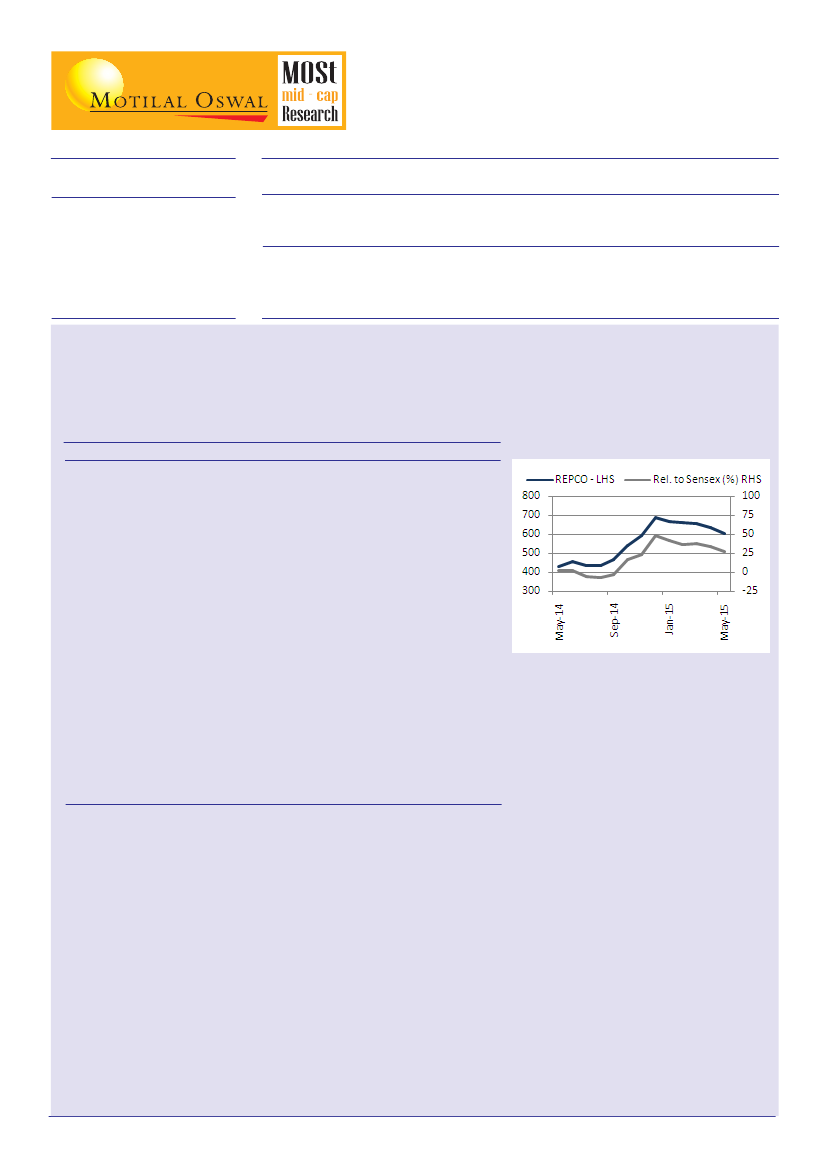
Repco Home Finance
BSE SENSEX
27809
Equity Shares (cr)
52-Week Range (Rs)
1,6,12 Abs.Perf.(%)
M.Cap. (Rs cr)
M.Cap. (US$ b)
S&P CNX
8421
6.2
725/369
-3/10/43
3,786
63.1
CMP: INR609
YEAR NET INC PAT
END
FY15E
FY16E
FY17E
(INRCr) (INRCr)
262
324
407
137
172
220
EPS
(INRCr)
22.0
27.6
35.2
EPS
TP: INR750
PE
(X)
27.7
22.1
17.3
ABV
(INR)
130
154
186
P/ABV
(INR)
4.7
4.0
3.3
ROAA
(%)
2.6
2.5
2.5
Gr.(%)
24
25
28
BUY
ROAE
(%)
17.5
18.9
20.3
Result Highlights - In line quarter
Net Income at INR 74.6cr grew 27% (est. INR 73.6cr); Pre Provisioning Profits grew 24% at INR 58.1cr (est. INR
57.4cr); Adj. PAT at INR 39.0cr grew 24% (est. INR 38.5cr)
Loan growth remains robust at 29%; Disbursements growth bounced back to 47% for the quarter due to spillover from
the previous quarter (3QFY15 growth at 7%); Absolute GNPAs have marginally risen, while GNPAs as % of loans
have declined 15bp YoY to 1.32%.
INRCr
Interest Income
Interest Expense
Net Interest Income
Other Income
Net Income
Pre Prov. Profit
Provisions
Profit Before Tax
Tax Provisions
Adj. PAT
Loan Growth (%)
NIMs (%)
Gross NPAs (%)
Net NPAs (%)
ROA (%)*
ROE (%)*
4QFY14
145
91
54
5
59
47
4
43
11
31
32
4.7
1.5
0.7
2.7
16.4
3QFY15 4QFY15
171
112
59
5
64
14
50
3
47
13
34
27
7
4.5
20.5
2.0
1.2
2.4
16.2
183
117
66
9
75
16
58
6
52
13
39
29
47
4.5
20.5
1.3
0.5
2.3
16.1
YoY
26%
29%
23%
66%
27%
37%
24%
21%
15%
24%
QoQ
7%
4%
13%
74%
17%
16%
18%
11%
2%
14%
FY14 FY15
511
325
186
24
211
39
172
23
149
39
110
32
47
4.7
18.4
1.5
0.7
2.7
16.4
669
432
237
24
262
55
207
186
49
137
27
27
4.5
20.5
1.3
0.5
2.6
17.5
YoY
31%
33%
27%
0%
24%
42%
20%
25%
25%
25%
Operating Expenses 12
52% 137%
20 -10%
Disbursement Gr (%) 31
Cost to Inc Ratio(%) 18.4
Note:* 2Q & 3Q FY15 ROA & ROE are based on reported PAT (incl. DTL exp.) and hence lower. Annual figs. are based on Adj. PAT
Valuation and view
Loan/Disbursement growth maintains momentum:
Disbursement growth durng the quarter was at +47% as much of the
loans which were sanctioned towards the end of 3QFY15 were disbursed during the current quarter and as a result
disbursement growth in 3QFY15 was at just 7%. Loan book grew by a healthy 29% to INR 6013cr. Further, management
has maintained its guidance of growing its loan book by 25-30% annnually in coming years.
Niche business model:
Repco's niche focus on lower ticket-size loans (average Rs 12 Lacs), non-salaried segment
(57% of loans) and smaller geographies (tier 2 & 3 cities) is likely to aid growth with minimal competition from banks in
this segment.
Strong growth combined with healthy profitability:
Operating with lean cost structure and manageable credit costs,
Repco has been consistently operating at ROA (Return On Asset) profile of around 2.5%. With visibility of limited risks to
its competitive advantages in the medium term, we expect RoAs to sustain at current levels. Given its high capitalisation
(20.3% CAR) Repco can grow at 25-30% CAGR for the next three years and achieve 20% ROE without requiring capital
infusion.
Valuation & View:
We expect the stock to give compounded returns of 25% over the next three years (i.e 2x in three years).
We maintain our target on the stock at INR 750 valuing the stock at a P/ABV of 4.0x based on FY17E ABV.
Jehan Bhadha
(jehan.bhadha@MotilalOswal.com); Tel: +91 22 33124915

Repco Home Finance
Action Construction Equipment Ltd.- Financial & Valuation
INCOME STATEMENT (Consolidated)
Y/E MARCH
2008A
2009A
(RS CRORE)
2010E 2011E
2012E
RATIOS
Y/E MARCH
2008A
2009A 2010E
2011E 2012E
Net Sales
growth (%)
Other Income
Total Income
Staff Costs
Mfg. & other expenses
Admn, S&D Exp.
Other Expenses
Total Expenditure
EBITDA
% of Net Sales
Depreciation/Amortization
Finance Charges
PBT
Tax
Minority Interest
PAT
growth (%)
PAT MARGIN
406
60
10
416
15
330
18
4
368
49
12
3
2
43
9
0
34
184
8%
428
5
17
445
18
366
18
8
409
36
8
6
5
26
7
1
19
-45
4%
427
0
6
433
21
348
19
5
394
40
9
5
4
31
8
1
22
19
5%
645
51
6
651
29
523
29
8
589
62
10
6
5
51
14
0
37
67
6%
795
23
6
801
32
646
35
10
723
78
10
6
5
67
18
0
49
31
6%
Adjusted EPS
Growth (%)
Cash EPS
Book Value
DPS
Payout (Incl. Div. Tax) (%)
Valuation (x)
P/E
Cash P/E
Price/Book Value
EV/EBITDA
EV/Sales
Div. Yld
Return Ratios (%)
RoE
RoCE
Leverage (x)
Debt/Equity (x)
3.8
125
3.6
14.5
0.8
25
12.4
11.4
3.3
8.7
1.0
1.7
29
34
0.2
2.1
-44
1.9
15.9
0.4
22
22.0
16.9
3.0
12.2
1.0
0.8
14
18
0.3
2.6
22
4.2
17.7
1.0
45
18.1
14.8
2.7
11.0
1.0
2.1
15
18
0.2
4.1 5.3
57
29
2.8 3.2
21.7 25.1
1.4 1.6
39
35
11.8
10.0
2.2
7.1
0.7
2.9
21
27
0.1
9.0
8.0
1.9
5.7
0.6
3.3
22
29
0.1
BALANCE SHEET (Consolidated)
Y/E MARCH
2008A
2009A 2010E
(RS CRORE)
2011E 2012E
CASH FLOW STATEMENT
(RS CRORE)
2008A
2009A 2010E
2011E 2012E
Y/E MARCH
Equity Share Capital
Preference Share Capital
Reserves & Surplus
Shareholders' Funds
Minority Interest
Total Debt
Net deferred tax
Liabilities
Net Block
Capital WIP
Current Assets
Inventories
Sundry Debtors
Cash and Bank Balances
Loans and Advances
Current Liabilities & Provisions
Net Current Assets
Total Assets
18
0
112
130
0
23
0
153
65
5
171
37
54
21
58
88
83
153
18
0
125
143
0
39
1
183
74
1
201
55
52
19
76
94
108
183
18
0
141
159
0
30
1
190
79
3
234
60
51
20
104
126
108
190
19
0
182
201
0
30
2
233
103
4
282
82
71
25
104
156
126
233
19
0
214
233
0
30
1
264
127
3
311
98
87
22
104
177
134
264
PBT before EO items
Add :
Interest
(Inc)/Dec in WC
Others
CF from Operating activities
(Inc)/Dec in Fixed assets
Others
CF from Investing activities
Issue of equity
Inc/(Dec) in debt
Dividend paid
Less: Interest paid
Others
CF from financing activities
Inc/(Dec) in cash
Add: Beginning balance
Closing Balance
Depreciation
34
3
-1
-8
10
38
-43
2
-41
0
13
-11
-1
-16
-16
-18
40
21
19
6
1
-18
-13
-5
-10
3
-8
0
17
-4
-3
0
9
-3
21
19
31
5
4
-3
-10
26
-12
2
-10
0
-9
-4
-4
0
-16
1
19
20
51
6
5
-16
-16
30
-30
0
-30
20
0
-9
-5
0
6
6
20
25
67
6
5
-13
-21
44
-30
0
-30
0
0
-12
-5
0
-17
-3
25
22
4 February 2015
2

Disclaimer: This document has been prepared by Motilal Oswal Securities Limited (hereinafter referred to as Most) to provide information about the company(ies)
and/sector(s), if any, covered in the report and may be distributed by it and/or its affiliated company(ies). This report is for personal information of the selected
recipient/s and does not construe to be any investment, legal or taxation advice to you. This research report does not constitute an offer, invitation or inducement
to invest in securities or other investments and Motilal Oswal Securities Limited (hereinafter referred as MOSt) is not soliciting any action based upon it. This report
is not for public distribution and has been furnished to you solely for your general information and should not be reproduced or redistributed to any other person
in any form. This report does not constitute a personal recommendation or take into account the particular investment objectives, financial situations, or needs
of individual clients. Before acting on any advice or recommendation in this material, investors should consider whether it is suitable for their particular
circumstances and, if necessary, seek professional advice. The price and value of the investments referred to in this material and the income from them may go
down as well as up, and investors may realize losses on any investments. Past performance is not a guide for future performance, future returns are not
guaranteed and a loss of original capital may occur.
MOSt and its affiliates are a full-service, integrated investment banking, investment management, brokerage and financing group. We and our affiliates have
investment banking and other business relationships with a some companies covered by our Research Department. Our research professionals may provide input
into our investment banking and other business selection processes. Investors should assume that MOSt and/or its affiliates are seeking or will seek investment
banking or other business from the company or companies that are the subject of this material and that the research professionals who were involved in preparing
this material may educate investors on investments in such business . The research professionals responsible for the preparation of this document may interact
with trading desk personnel, sales personnel and other parties for the purpose of gathering, applying and interpreting information. Our research professionals
are paid on the profitability of MOSt which may include earnings from investment banking and other business.
MOSt generally prohibits its analysts, persons reporting to analysts, and members of their households from maintaining a financial interest in the securities or
derivatives of any companies that the analysts cover. Additionally, MOSt generally prohibits its analysts and persons reporting to analysts from serving as an officer,
director, or advisory board member of any companies that the analysts cover. Our salespeople, traders, and other professionals or affiliates may provide oral or
written market commentary or trading strategies to our clients that reflect opinions that are contrary to the opinions expressed herein, and our proprietary trading
and investing businesses may make investment decisions that are inconsistent with the recommendations expressed herein. In reviewing these materials, you
should be aware that any or all of the foregoing among other things, may give rise to real or potential conflicts of interest. MOSt and its affiliated company(ies),
their directors and employees and their relatives may; (a) from time to time, have a long or short position in, act as principal in, and buy or sell the securities or
derivatives thereof of companies mentioned herein. (b) be engaged in any other transaction involving such securities and earn brokerage or other compensation
or act as a market maker in the financial instruments of the company(ies) discussed herein or act as an advisor or lender/borrower to such company(ies) or may
have any other potential conflict of interests with respect to any recommendation and other related information and opinions.; however the same shall have no
bearing whatsoever on the specific recommendations made by the analyst(s), as the recommendations made by the analyst(s) are completely independent of the
views of the affiliates of MOSt even though there might exist an inherent conflict of interest in some of the stocks mentioned in the research report
Reports based on technical and derivative analysis center on studying charts company's price movement, outstanding positions and trading volume, as opposed
to focusing on a company's fundamentals and, as such, may not match with a report on a company's fundamental analysis. In addition MOST has different
business segments / Divisions with independent research separated by Chinese walls catering to different set of customers having various objectives, risk profiles,
investment horizon, etc, and therefore may at times have different contrary views on stocks sectors and markets.
Unauthorized disclosure, use, dissemination or copying (either whole or partial) of this information, is prohibited. The person accessing this information
specifically agrees to exempt MOSt or any of its affiliates or employees from, any and all responsibility/liability arising from such misuse and agrees not to hold MOSt
or any of its affiliates or employees responsible for any such misuse and further agrees to hold MOSt or any of its affiliates or employees free and harmless from
all losses, costs, damages, expenses that may be suffered by the person accessing this information due to any errors and delays. The information contained herein
is based on publicly available data or other sources believed to be reliable. Any statements contained in this report attributed to a third party represent MOSt's
interpretation of the data, information and/or opinions provided by that third party either publicly or through a subscription service, and such use and
interpretation have not been reviewed by the third party. This Report is not intended to be a complete statement or summary of the securities, markets or
developments referred to in the document. While we would endeavor to update the information herein on reasonable basis, MOSt and/or its affiliates are under
no obligation to update the information. Also there may be regulatory, compliance, or other reasons that may prevent MOSt and/or its affiliates from doing so.
MOSt or any of its affiliates or employees shall not be in any way responsible and liable for any loss or damage that may arise to any person from any inadvertent
error in the information contained in this report. MOSt or any of its affiliates or employees do not provide, at any time, any express or implied warranty of any kind,
regarding any matter pertaining to this report, including without limitation the implied warranties of merchantability, fitness for a particular purpose, and non-
infringement. The recipients of this report should rely on their own investigations.
This report is intended for distribution to institutional investors. Recipients who are not institutional investors should seek advice of their independent financial
advisor prior to taking any investment decision based on this report or for any necessary explanation of its contents.
Most and it's associates may have managed or co-managed public offering of securities, may have received compensation for investment banking or merchant
banking or brokerage services, may have received any compensation for products or services other than investment banking or merchant banking or brokerage
services from the subject company in the past 12 months.
Most and it's associates have not received any compensation or other benefits from the subject company or third party in connection with the research report.
Subject Company may have been a client of Most or its associates during twelve months preceding the date of distribution of the research report
MOSt and/or its affiliates and/or employees may have interests/positions, financial or otherwise of over 1 % at the end of the month immediately preceding the
date of publication of the research in the securities mentioned in this report. To enhance transparency, MOSt has incorporated a Disclosure of Interest Statement
in this document. This should, however, not be treated as endorsement of the views expressed in the report.
Motilal Oswal Securities Limited is under the process of seeking registration under SEBI (Research Analyst) Regulations, 2014.
There are no material disciplinary action that been taken by any regulatory authority impacting equity research analysis activities
Analyst Certification
The views expressed in this research report accurately reflect the personal views of the analyst(s) about the subject securities or issues, and no part of the
compensation of the research analyst(s) was, is, or will be directly or indirectly related to the specific recommendations and views expressed by research analyst(s)
in this report. The research analysts, strategists, or research associates principally responsible for preparation of MOSt research receive compensation based upon
various factors, including quality of research, investor client feedback, stock picking, competitive factors and firm revenues
Disclosure of Interest Statement
1.Analyst ownership of the stocks mentioned above
2.Served as an officer, director or employee
Repco Home Finance
No
No
Regional Disclosures (outside India)
This report is not directed or intended for distribution to or use by any person or entity resident in a state, country or any jurisdiction, where such
distribution, publication, availability or use would be contrary to law, regulation or which would subject MOSt & its group companies to registration or
licensing requirements within such jurisdictions.
Motilal Oswal Securities Ltd
Motilal Oswal Tower, Level 6, Sayani Road, Prabhadevi, Mumbai 400 025
Phone: (91-22) 30894200 Fax: (91-22) 22885038. E-mail: info@motilaloswal.com