22 May 2015
4QFY15 Results Update | Sector:
Consumer
ITC
BSE SENSEX
27,958
Bloomberg
Equity Shares (m)
MCap INR b/USD b
52-Week Range (INR)
1, 6, 12 Rel. Per (%)
Avg Val (INR M)/Vol
‘000
Free float (%)
S&P CNX
8,429
ITC IN
7,953.2
2,612.6/43.4
410 / 312
-5/-10/-19
2,958/8,401
100.0
CMP: INR328
TP: INR365 (11%)
Neutral
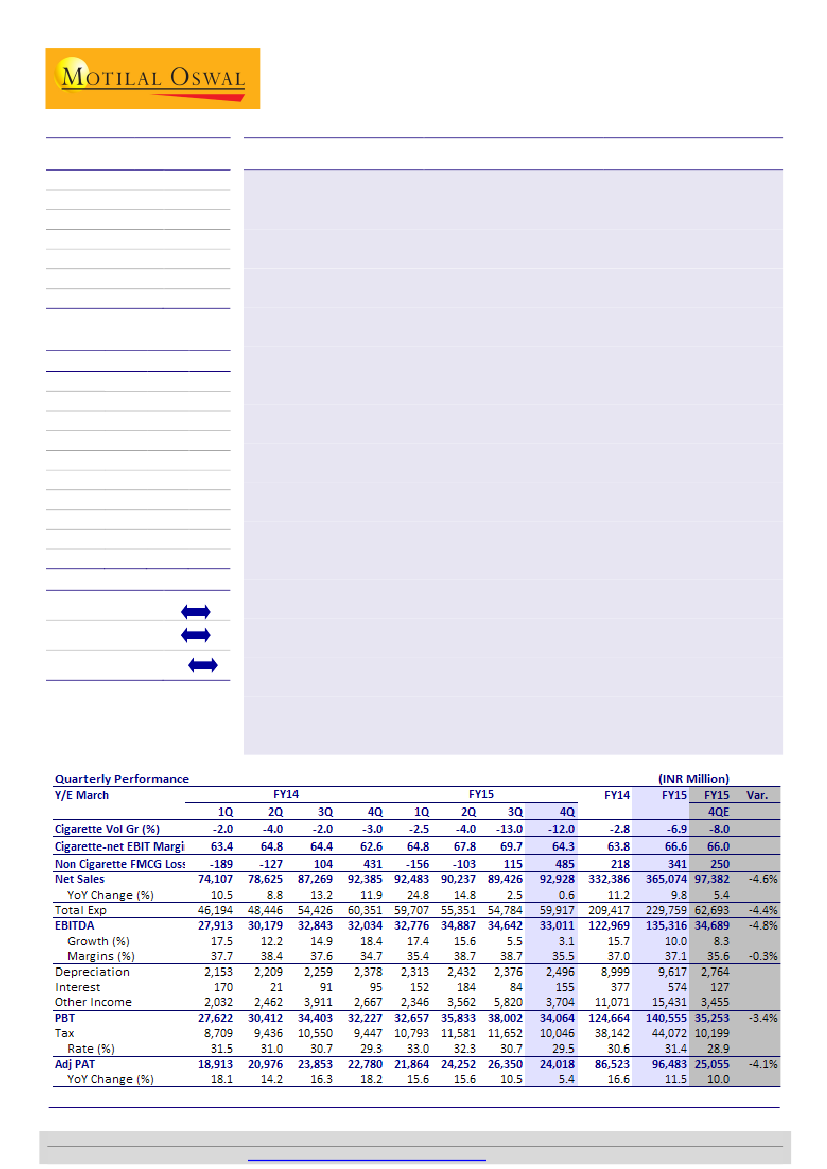
Another quarter of double digit Cig volume decline; EBITDA flat YoY
ITC’s 4QFY15 performance
was below expectations with muted sales growth of
0.6% YoY to INR92.9b (est. INR97.4b), EBITDA grew 1.2% YoY to INR32.4b (est.
INR34.7b) and Adj. PAT (adjusted for INR 580m impact on rationalization of Safety
Matches manufacturing operations) increased 5.4% YoY to INR24b (est. INR25.1b).
Cig volumes declined ~13% (same as 3QFY15)
while segment EBIT grew 6% and
posted 170bp margin expansion to 64.3% (20th consecutive quarter of margin
expansion). However margins declined 540bps QoQ. Cig volumes remained under
pressures owing to cumulative impact of higher excise duty lead price hikes (for
the quarter price hike component stood at ~24% in our view). We understand that
portfolio witnessed some downtrading to 64mm as maximum impact of price
hikes was felt in 69mm segment. Unabated rise in excise duties and consequent
price hikes is putting the demand inelasticity of Cig consumption/volumes at risk
and also impairing ITC’s ability to deliver consistent and healthy high teens Cig
EBIT growth.
Non-Cig FMCG posted 10.9% sales growth
and reported EBIT of INR485m, up 13%
YoY. Agri revenues declined 28.8% YoY due to absence of trading opportunities in
Soya while margins expanded 430bp due to improvement in mix. Hotels segment
posted 8.1% YoY revenue growth but margins contracted 650bp YoY. Paper
segment revenue declined 4.6% while segment EBIT grew 1.1% and margins
expanded 90bp to 15.8% due to better product mix.
FY15 Sales, EBITDA and PAT grew 9.8%, 9.6% and 11% resp. Cig sales registered
modest 8.7% growth while segment EBIT grew 13.6% YoY. Dividend at INR6.25/sh.
Maintain Neutral:
We cut our earnings for FY15-17E by 1-2% and model for 9% Cig
volume decline in FY16E. We expect the Cig volumes to remain under pressure for
few more quarters as consumer absorb the higher prices. At 24.3x FY16E and
21.5x FY17E EPS, ITC trades at a discount of ~35% to the sector average. However
lack of Cig volume growth and overhang of potential ban on loose sticks as well as
expanded pictorial warnings precludes re-rating. Maintain
Neutral
with a revised
TP of INR 365 (24x FY17 EPS, 15% discount to three year average).
Financials & Valuation (INR Billion)
Y/E MAR
Net Sales
EBITDA
Adj PAT
Adj.EPS
(INR)
Gr. (%)
2015
360.8
135.3
96.5
12.1
9.8
2016E 2017E
397.0
149.0
107.4
13.5
11.3
40.7
34.9
43.3
24.3
8.1
441.7
167.4
121.7
15.3
13.4
45.3
35.6
44.2
21.5
7.3
BV/Sh.(INR) 36.7
RoE (%)
34.8
RoCE (%)
P/E (x)
P/BV (X)
43.3
26.8
9.0
Estimate change
TP change
Rating change
Gautam Duggad
(Gautam.Duggad@MotilalOswal.com); +91 22 3982 5404
Manish Poddar
(Manish.Poddar@MotilalOswal.com); +91 22 3027 8029
Investors are advised to refer through disclosures made at the end of the Research Report.
Motilal Oswal research is available on
www.motilaloswal.com/Institutional-Equities,
Bloomberg, Thomson Reuters, Factset and S&P Capital.

Hindustan Unilever
Key Quarterly Charts
Exhibit 1: Sales came in 4.6% below expectations
Net Sales (INR b)
20
23
Sales growth (%)
25
19
10
9
13
12
15
2
0
19
21
21
Exhibit 2: EBITDA flattish in 4Q; multi year low growth
EBITDA (INR b)
20
19
EBITDA growth (%)
18
18
15
18
12
15
17
16
5
1
Source: MOSL, Company
Exhibit 3:
Cig EBIT margin expanded 170bp YoY to 64.3%; 540bps contraction QoQ
EBIT (INR m)
61.4
61.1
58.3
63.4 64.8
EBIT Margins (%)
64.4
62.6
64.8
67.8
69.7
64.3
57.5
54.1
Source: MOSL, Company
Exhibit 4: Cig volumes declined ~13% (est. of -8%)
Cig volume growth (%)
5.0
1.5 0.5 1.5 2.5
-2.0
-4.0
-2.0
-3.0 -2.5 -4.0
-13.0-13.0
Exhibit 5: Cig EBIT posted growth of 6%; lowest since 1QFY09
Cig EBIT growth (%)
Source: MOSL, Company
22 May 2015
2

Hindustan Unilever
Exhibit 6: FMCG-others posted sales growth of 10.9%
Sales Growth (%)
Exhibit 7:
Incremental EBIT margins of 1%
17.0
13.8
7.4
5.5 6.8
7.3 6.5
2.2
1.8 1.0
0.5
Incr Sales (INR m)
Incr EBIT Margin (%)
11.6 11.2
Source: MOSL, Company
Exhibit 8: FMCG-others posted EBIT of INR485m
Exhibit 9: Paper revenues decline due to macro slowdown
25.0 26.7
20.0
Sales (INR m)
21.5
17.8
21.6
18.7 18.4
EBIT Margins (%)
21.3
14.9
18.9 17.8
EBIT (INR m)
15.8
Source: MOSL, Company
Exhibit 10:
Agri margins stood at 11.5%
EBIT Margins (%)
16.1
7.5
10.1
12.8
10.6
6.9
9.1
11.5
7.3 6.1
Exhibit 11: Agri revenues remain volatile
Agri contri to ITC sales
14.5 14.9
11.5
20.6
25.4
28.3
21.4 22.7
29.8
22.8 20.7 21.9
23.1
18.2
15.5
36.0
Source: Company, MOSL
Exhibit 12:
Hotel EBIT declined 30%
EBIT Margins (%)
29.0
11.3
17.9
7.1
12.9
3.6 3.5
-4.9 -3.7
19.7 18.7
8.7
12.1
Exhibit 13: ..while revenues were up 8% YoY
Sales (INR m)
EBIT (INR m)
Source: MOSL, Company
22 May 2015
Source: MOSL, Company
3

Hindustan Unilever
Below estimates led by sharp Cig volume decline of 13%
ITC posted muted revenue growth (0.6% YoY) to INR92.9b (est. INR97.4b), with
3.2% sales growth for Cigarettes and 10.9% growth in Non-Cig FMCG. Hotels
business posted 8.1% sales growth while Agri Business and Paper business
declined 28.8% and 4.6% respectively.
Cigarette volumes declined ~13% (same as 3QFY15) but margins continued to
expand 170bp YoY to 64.3% due to price hikes and mix improvement.
Gross margins improved by 250bp largely led by price hikes in Cigarettes
business. EBITDA grew 1.2% YoY to INR32.4b (est. INR34.7b) and Adj. PAT (after
factoring in the one-time costs of INR 580 mn pertaining to rationalization of
Safety Matches Manufacturing operations)increased 5.4% YoY to INR24b (est.
INR25.0b). Other income expanded 39% and drove the PAT growth.
Cigarette volumes declined ~13%; 170bp EBIT margin expansion
Cig volumes declined ~13% (same as 3QFY15)
while segment EBIT grew 6% and
posted 170bp margin expansion to 64.3% (20th consecutive quarter of margin
expansion). However margins declined 540bps QoQ.
Segment costs in Cig division declined 1.5% YoY.
Cig volumes remained under pressures owing to cumulative impact of higher
excise duty lead price hikes (for the quarter price hike component stood at ~24%
in our view).
We understand that portfolio witnessed some downtrading to 64mm as
maximum impact of price hikes was felt in 69mm segment.
Unabated rise in excise duties and consequent price hikes is putting the demand
inelasticity of Cig consumption/volumes at risk and also impairing ITC’s ability to
deliver consistent and healthy high teens Cig EBIT growth.
FMCG: Decent revenue growth; enters Juices segment
FMCG sales grew 10.9% to INR25.7b (volume growth of 6-7%) and reported EBIT
of INR 485m, up 13.6% YoY. Within the FMCG –Others portfolio - Snacks,
Noodles and Personal Care and Biscuits continued to outperform. ITC entered
Juices category with the launch of B Natural brand with 7 variants.
Instant Noodles did well and gained market share.
Engage Deodorant has now become the no.2 player after Fog.
Agri business: As volatile as ever;
Agri division sales declined by 28.8% YoY to INR14.3b due to absence of trading
opportunities in Soya while margins expanded 430bp led by improvement in mix
(higher sales of Leaf Tobacco).
Hotels: Sequential improvement in EBIT
Hotel revenues grew 8.1% YoY at INR3.4b, impacted by weak macro
environment and higher room supply (addition of 8000 rooms in Delhi/National
Capital Region, Mumbai, Bengaluru and Chennai over the last 2 years).
EBIT margins contracted 650bp YoY to 12.% (up 340bps QoQ) due to lack of
operating leverage, higher depreciation costs led by revision in useful life of
fixed assets on account of new Companies Act 2013 and gestation expenses
pertaining to opening of new properties in Gurgaon and Bengaluru.
4
22 May 2015

Hindustan Unilever
Paper: Slowdown in FMCG impacted division’s performance
Paper and Paperboard business sales declined 4.6% YoY to INR12b impacted by
the slowdown in the FMCG and Cigarette industry.
However, EBIT grew 1.1% YoY to INR1.9b while EBIT margin expanded 90bp YoY
to 15.8% led by better performance of Value Added Segment.
As per company, the segment profitability was hurt by input cost pressures,
reduction of import duties under various Free Trade Agreements, especially with
ASEAN which became effective from 1
st
January 2014 and cheap imports from
China.
Exhibit 14:
Segmental
performance
2QFY13 3QFY13
4QFY13
36,232
20,362
3,155
18,545
10,575
11.5
26.0
10.4
31.1
7.9
2.5
21,124
119
406
1,275
1,881
20.2
-171.2
-51.0
20.8
-3.9
58.3
0.6
12.9
6.9
17.8
1QFY14
35,374
17,447
2,499
21,890
11,631
7.1
18.4
7.5
29.4
9.9
-2.0
22,417
-189
89
1,993
2,516
18.0
-51.3
-65.9
16.3
-5.0
63.4
-1.1
3.6
9.1
21.6
2QFY14
37,238
19,622
2,470
17,725
11,787
10.0
16.1
13.8
-12.4
11.3
-2.0
24,117
-127
87
2,846
2,208
15.9
-58.1
-43.0
9.6
-21.9
64.8
-0.6
3.5
16.1
18.7
3QFY14
41,161
20,778
3,154
17,864
12,574
12.5
16.6
1.9
9.5
18.5
-2.0
26,526
104
622
2,054
2,317
18.8
-143.2
12.1
19.0
1.4
64.4
0.5
19.7
11.5
18.4
4QFY14
40,788
23,145
3,205
20,042
12,612
12.6
13.7
1.6
8.1
19.3
-3.0
25,519
431
599
1,455
1,884
20.8
263.0
47.3
14.1
0.1
62.6
1.9
18.7
7.3
14.9
1QFY15 2QFY15 3QFY15 4QFY15
42,011
19,346
2,487
32,961
12,885
18.8
10.9
-0.5
50.6
10.8
-2.5
27,218
-156
-121
2,025
2,749
21.4
-17.6
-235.2
1.6
9.3
64.8
-0.8
-4.9
6.1
21.3
42,509
21,960
2,616
20,587
12,841
14.2
11.9
5.9
16.1
8.9
-4.0
28,821
-103
-96
2,983
2,421
19.5
-18.8
-209.9
4.8
9.7
41,419
23,141
3,303
15,979
11,988
0.6
11.4
4.7
-10.6
-4.7
-13.0
28,863
115
287
2,388
2,139
8.8
10.7
-53.8
16.3
-7.7
42,107
25,665
3,464
14,279
12,026
3.2
10.9
8.1
-28.8
-4.6
-12.0
27,062
485
420
1,644
1,906
6.0
12.6
-29.8
13.0
1.1
Sales (INR m)
Cigarettes
FMCG - Others
Hotels
Agri business
Paper and packaging
33,852
16,908
2,170
20,239
10,590
14.0
26.1
2.8
41.1
5.3
0.5
20,802
-303
153
2,597
2,825
20.3
-45.8
-64.8
8.8
-2.5
61.4
-1.8
7.1
12.8
26.7
36,574
17,827
3,095
16,310
10,616
13.1
30.1
11.0
43.1
8.5
1.5
22,335
-240
555
1,726
2,286
21.1
-48.8
-45.5
21.9
1.9
61.1
-1.3
17.9
10.6
21.5
Sales growth (YoY)
Cigarettes
FMCG - Others
Hotels
Agri business
Paper and packaging
Volume growth (YoY)
Cigarettes
EBIT (INR m)
Cigarettes
FMCG - Others
Hotels
Agri business
Paper and packaging
EBIT growth (YoY)
Cigarettes
FMCG - Others
Hotels
Agri business
Paper and packaging
EBIT Margin (%)
Cigarettes
FMCG - Others
Hotels
Agri business
Paper and packaging
67.8
69.7
64.3
-0.5
0.5
1.9
-3.7
8.7
12.1
14.5
14.9
11.5
18.9
17.8
15.8
Source: Company, MOSL
Valuation and view
ITC’s 4Q15 EBITDA growth is one of the lowest in many years.
Cigarette segment posted one of its worst performances in recent times on both
volume and EBIT growth front. We have cut our FY15-17E estimates by 1-2% to
bake in lower than expected Cig volume growth. We are now building in 9%
volume decline in FY16E.
22 May 2015
5

Hindustan Unilever
At 24.3x FY16E and 21.5x FY17E EPS, ITC trades at a discount of ~30% to the
sector average. However lack of Cig volume growth and overhang of potential
ban on loose sticks as well as expanded pictorial warnings precludes re-rating.
Maintain
Neutral
with a revised TP of INR 365 (24x FY17 EPS, 15% discount to
three year average).
Exhibit 15: Revised numbers by 1-2% to incorporate weaker than estimated cig. volumes
New
FY16E
397,010
148,974
107,382
FY17E
441,693
167,396
121,743
Old
FY16E
402,395
149,911
108,188
FY17E
446,280
167,995
124,301
Change
FY16E
FY17E
-1.3%
-1.0%
-0.6%
-0.4%
-0.7%
-2.1%
Source: Company, MOSL
Sales
EBITDA
PAT
Exhibit 16: ITC P/E (x): Valuations at long term averages
39.0
31.0
23.0
15.0
7.0
21.1
7.8
PE (x)
Peak(x)
Avg(x)
30.9
23.5
Min(x)
Exhibit 17: P/E trades in line with Sensex
150
100
50
0
-50
-100
34.8
47.6
ITC PE Relative to Sensex PE (%)
LPA (%)
Source: Bloomberg, Company, MOSL
Exhibit 18: Valuation Matrix of coverage universe
Company
Consumer
Asian Paints
Britannia
Colgate
Dabur*
Emami*
Godrej Consumer
GSK Consumer
Hind. Unilever
ITC
Jyothy Labs
Marico*
Nestle
Pidilite Inds.
Radico Khaitan
United Spirits
Retail
Jubilant Foodworks
Shopper's Stop
Titan Company
Reco
Price Mkt Cap EPS Growth YoY (%)
P/E (x)
EV/EBITDA (x)
ROE (%) Div. (%)
(INR) (USD M) FY15E FY16E FY17E FY15E FY16E FY17E FY15E FY16E FY17E FY15E FY15E
776
2,431
2,002
265
1,026
1,126
6,398
863
328
253
411
6,997
549
91
3,701
1,751
403
370
11,711
4,571
4,285
7,335
3,666
6,031
4,235
29,381
41,120
721
4,171
10,619
4,428
190
8,468
1,802
521
5,171
15.8 31.3
44.8 38.1
13.9 18.3
16.5 25.9
21.7 25.1
19.6 38.9
-13.5 23.2
5.5 18.0
9.4 11.8
15.2 88.0
18.1 21.2
6.8 23.0
9.9 44.3
-13.7 12.7
LP 151.7
4.5
8.1
11.1
64.3
60.5
15.4
23.4 52.3
18.2 50.9
21.5 48.7
15.8 43.4
22.0 47.5
21.6 43.4
20.5 46.1
18.1 48.6
13.4 26.8
3.9 46.5
24.4 46.2
18.6 53.7
17.8 53.9
21.8 16.1
43.5 213.6
42.5
44.6
22.9
92.7
82.3
39.9
39.8
36.9
41.2
34.5
38.0
31.3
37.4
41.2
24.3
24.7
38.1
43.7
37.3
14.9
84.9
56.4
51.3
34.6
32.3
31.2
33.9
29.8
31.2
25.7
31.0
34.9
21.5
23.8
30.6
36.8
31.7
12.2
59.1
39.6
35.5
28.1
35.2
36.9
32.6
35.0
41.8
30.9
34.2
72.3
18.4
32.3
30.4
32.1
35.6
11.6
73.0
43.5
18.2
30.3
26.6
25.2
26.7
27.4
32.5
23.1
26.7
59.7
16.4
20.5
24.6
26.0
24.4
9.8
50.1
27.7
14.6
26.0
21.4
20.9
21.4
23.4
26.3
19.5
21.9
48.9
14.4
16.7
19.6
22.1
20.5
8.2
39.0
20.1
11.8
20.8
32.4
61.9
88.0
35.9
45.3
20.4
29.6
109.6
34.7
13.1
33.5
48.2
23.1
8.6
8.0
18.8
5.4
27.2
0.9
0.7
1.6
0.8
0.7
0.6
0.9
1.6
2.2
1.2
0.6
0.9
0.6
0.9
0.0
0.1
0.2
0.8
Neutral
Buy
Neutral
Neutral
Buy
Neutral
Neutral
Neutral
Neutral
Buy
Neutral
Neutral
Neutral
Buy
Buy
Buy
Neutral
Neutral
Note: For Nestle FY15E means CY14
Source: Company, MOSL
22 May 2015
6

Hindustan Unilever
Story in charts
Exhibit 19: Volume growth of -12% in 4Q
Volume growth (%)
3.3
-2.9
-2.8
-0.3
7.2
7.6
-2.5
-4.0
-13.0 -12.0
182
212
248
296
16.3
16.6
17.2
11.0
11.1
329
365
13.3
Exhibit 20: Sales CAGR of 13.5% over FY15-17E
Sales (INR b)
19.4
13.8
Sales growth (%)
413
471
Source: Company, MOSL
Exhibit 21: EBITDA margins were up 140bps YoY in FY14
Gross Margin (%)
57.3
58.6
55.6
36.0
EBITDA Margin (%)
57.0
37.9
57.7
37.7
58.4
59.6
Exhibit 22: PAT CAGR of 15.2% over FY15-17E
PAT (INR b)
25.1
PAT Margin (%)
27.1
26.8
26.7
27.6
24.8
34.9
35.0
35.8
37.8
38.4
22.4
40.7
49.9
61.6
23.6
74.2
87.9
98.0
112.1
130.0
Source: Company, MOSL
22 May 2015
7

Hindustan Unilever
Financials and valuations
Income Statement
Y/E March
Net Sales
Operational Income
Total Revenue
Change (%)
Total Expenditure
EBITDA
Change (%)
Margin (%)
Depreciation
Int. and Fin. Charges
Other Inc. - Recurring
Profit before Taxes
Change (%)
Margin (%)
Tax
Deferred Tax
Tax Rate (%)
Profit after Taxes
Change (%)
Margin (%)
Reported PAT
Balance Sheet
Y/E March
Share Capital
Reserves
Net Worth
Loans
Deferred Liability
Capital Employed
Gross Block
Less: Accum. Depn.
Net Fixed Assets
Capital WIP
Investments
Current
Non-current
Curr. Assets, L&A
Inventory
Account Receivables
Cash and Bank Balance
Others
Curr. Liab. and Prov.
Account Payables
Other Liabilities
Provisions
Net Current Assets
Application of Funds
E: MOSL Estimates
2010
181,532
2,392
183,924
16.4
120,619
63,305
24.8
34.9
6,087
820
3,756
60,153
24.7
33.1
20,286
-822
32.4
40,689
24.7
22.4
40,689
2011
211,676
2,914
214,590
16.7
140,467
74,123
17.1
35.0
6,560
679
5,798
72,682
20.8
34.3
22,804
2
31.4
49,876
22.6
23.6
49,876
2012
247,984
3,490
251,475
17.2
162,788
88,687
19.6
35.8
6,985
980
8,253
88,975
22.4
35.9
26,777
574
30.7
61,624
23.6
24.8
61,624
2013
296,056
2,957
299,013
18.9
192,543
106,470
20.1
36.0
7,956
1,059
9,387
106,842
20.1
36.1
29,348
3,310
30.6
74,184
20.4
25.1
74,184
2014
328,826
3,560
332,386
11.2
207,631
124,755
17.2
37.9
8,999
236
11,071
126,591
18.5
38.5
37,911
828
30.6
87,852
18.4
26.7
87,852
2015
360,832
4,242
365,074
9.8
229,759
135,316
8.5
37.5
9,617
574
15,431
140,555
11.0
39.0
43,244
828
31.4
96,483
9.8
26.7
96,483
2016E
397,010
4,781
401,791
10.1
252,817
148,974
10.1
37.5
10,423
492
17,566
155,626
10.7
39.2
47,933
311
31.0
107,382
11.3
27.0
107,382
(INR Million)
2017E
441,693
5,260
446,954
11.2
279,557
167,396
12.4
37.9
11,121
442
20,606
176,439
13.4
39.9
54,343
353
31.0
121,743
13.4
27.6
121,743
(INR Million)
2017E
7,953
352,007
359,960
511
10,861
371,333
241,756
93,698
148,058
25,000
139,407
114,286
25,122
229,888
115,511
24,202
57,420
32,754
171,019
81,766
16,208
73,046
58,868
371,333
2010
3,818
136,826
140,644
1,077
7,850
149,571
119,679
38,255
81,424
10,090
57,269
46,982
10,287
81,279
45,491
8,581
11,263
15,945
80,491
34,449
7,860
38,182
788
149,571
2011
7,738
151,795
159,533
1,093
8,019
168,645
127,658
44,208
83,451
13,334
55,547
42,189
13,358
97,901
52,692
8,851
22,432
13,926
81,588
39,792
7,362
34,435
16,313
168,644
2012
7,818
180,101
187,919
791
8,727
197,437
138,033
48,197
89,837
23,923
63,166
43,633
19,533
112,957
56,378
9,824
28,189
18,565
92,445
46,989
10,273
35,183
20,512
197,437
2013
7,902
214,977
222,879
664
12,037
235,580
165,884
54,698
111,186
15,786
70,603
50,594
20,009
142,600
66,002
11,633
36,150
28,815
104,595
50,571
12,540
41,485
38,006
235,580
2014
7,953
254,667
262,620
511
12,970
276,101
181,756
62,269
119,487
23,598
88,234
63,113
25,122
160,975
73,595
21,654
32,894
32,832
116,193
54,498
13,976
47,719
44,782
276,101
2015
7,953
283,728
291,681
511
12,334
304,526
201,756
72,155
129,601
25,000
97,078
71,956
25,122
187,668
95,169
21,999
41,972
28,528
134,820
63,229
13,079
58,512
52,848
304,526
2016E
7,953
315,728
323,681
511
11,637
335,829
221,756
82,578
139,178
25,000
114,389
89,268
25,122
207,809
104,034
21,754
51,611
30,409
150,547
71,719
14,398
64,429
57,262
335,829
22 May 2015
8

Hindustan Unilever
Financials and valuations
Ratios
Y/E March
Basic (INR)
EPS
Cash EPS
BV/Share
DPS
Payout %
Valuation (x)
P/E
Cash P/E
EV/Sales
EV/EBITDA
P/BV
Dividend Yield (%)
Return Ratios (%)
RoE
RoCE
Working Capital Ratios
Debtor (Days)
Asset Turnover (x)
Leverage Ratio
Debt/Equity (x)
Cash Flow Statement
Y/E March
OP/(loss) before Tax
Int./Div. Received
Depreciation and Amort.
Interest Paid
Direct Taxes Paid
Incr in WC
Diff in dep
CF from Operations
Extraordinary Items
Incr Decr in FA
Free Cash Flow
Pur of Investments
CF from Invest.
Issue of shares
Incr in Debt
Interest Income
Interest Paid
Dividend Paid
Others
CF from Fin. Activity
Incr of Cash
Add: Opening Balance
Closing Balance
2010
10.7
12.3
36.8
10.0
93.8
2011
6.4
7.3
20.6
4.5
69.0
2012
7.9
8.8
24.0
4.5
57.1
2013
9.4
10.4
28.2
5.3
55.9
2014
11.0
12.2
33.0
6.0
54.3
2015
12.1
13.3
36.7
7.4
60.0
2016E
13.5
14.8
40.7
8.1
60.0
2017E
15.3
16.7
45.3
9.2
60.0
30.8
28.5
14.0
40.2
8.9
3.0
51.0
45.0
12.0
34.2
15.9
1.4
41.7
37.4
10.2
28.4
13.7
1.4
29.7
27.0
7.6
20.0
9.9
1.8
26.8
24.3
6.9
18.3
9.0
2.2
24.3
22.2
6.2
16.4
8.1
2.5
21.5
19.7
5.5
14.4
7.3
2.8
29.3
38.5
33.2
42.5
35.5
44.6
36.1
45.5
36.2
45.2
34.8
43.3
34.9
43.3
35.6
44.2
15
1.2
15
1.3
14
1.3
13
1.3
18
1.2
22
1.2
20
1.2
19
1.2
0.0
0.0
0.0
0.0
0.0
0.0
0.0
0.0
(INR Million)
2017E
176,439
20,606
11,121
442
54,696
20,816
0
91,884
0
20,000
71,884
25,018
-45,018
0
0
20,606
442
64,429
3,208
-41,058
5,809
51,611
57,420
2010
60,153
3,756
6,087
820
19,464
-6,956
700
51,497
0
12,041
39,456
28,891
-40,933
7,207
-698
3,756
820
13,965
-5,091
-9,612
953
10,310
11,263
2011
72,682
5,798
6,560
679
22,806
-438
607
52,362
0
11,224
41,138
-1,722
-9,502
5,220
16
5,798
679
38,182
-3,864
-31,691
11,170
11,263
22,433
2012
88,975
8,253
6,985
980
27,352
-114
2,996
64,445
1
20,964
43,481
7,619
-28,582
7,650
-303
8,253
980
34,435
-10,292
-30,106
5,757
22,432
28,189
2013
106,842
9,387
7,956
1,059
32,658
16,494
1,454
58,771
2
19,714
39,058
7,437
-27,149
9,223
-127
9,387
1,059
35,183
-5,903
-23,662
7,961
28,189
36,150
2014
126,591
11,071
8,999
236
38,739
22,551
1,428
64,893
3
23,684
41,209
17,631
-41,313
6,911
-153
11,071
236
41,485
-2,946
-26,837
-3,257
36,150
32,893
2015
140,555
15,431
9,617
574
44,072
7,831
-269
83,144
0
21,402
61,742
8,843
-30,246
0
0
15,431
574
47,719
-10,552
-43,414
9,485
32,894
42,378
2016E
155,626
17,566
10,423
492
48,244
12,086
0
88,644
0
20,000
68,644
17,312
-37,312
0
0
17,566
492
58,512
-256
-41,694
9,639
41,972
51,611
22 May 2015
9

Hindustan Unilever
Corporate profile: ITC
Company description
ITC is an associate of BAT (British American
Tobacco) controls more than 2/3rd of the cigarette
market in India. ITC has emerged as a diversified
conglomerate
with
leading
presence
in
Paperboards, Hotels and Processed foods. E-
Choupal, the agri rural initiative of the company
has been widely appreciated for its foresight in
harnessing the potential in the rural market.
Exhibit 23: Sensex rebased
Exhibit 24: Shareholding pattern (%)
Mar-15
Promoter
DII
FII
Others
0.0
34.8
21.0
44.3
Dec-14
0.0
34.8
21.0
44.2
Mar-14
0.0
34.7
19.5
45.8
Exhibit 25: Top holders
Holder Name
Tobacco Manufacturers India Ltd
LIC of India
Specified Undertaking Of the Unit Trust Of India
Myddleton Investment Company Ltd
New India Assurance Company Ltd
% Holding
24.8
14.4
11.2
4.0
1.9
Note: FII Includes depository receipts
Exhibit 26: Top management
Name
Yogesh Chander Deveshwar
Biswa Behari Chatterjee
Designation
Chairman
Executive VP & CS
Exhibit 27:
Directors
Name
Yogesh Chander Deveshwar
Anil Baijal*
S S H Rehman*
Meera Shankar*
Serajul Haq Khan*
Sunil Behari Mathur*
Angara Venkata Girija Kumar*
Pillappakkam Bahukutumbi
Ramanujam*
R E Lerwill*
*Independent
Name
Kurush Noshir Grant
Krishnamoorthy Vaidyanath
Biswa Behari Chatterjee
Anthony Ruys
Nakul Anand
Pradeep Vasant Dhobale
S B Mainak
Kurush Noshir Grant
Exhibit 28: Auditors
Name
Deloitte Haskins & Sells
P Raju Iyer
S Mahadevan & Co
Shome & Banerjee
Type
Statutory
Cost Auditor
Cost Auditor
Cost Auditor
Exhibit 29: MOSL forecast v/s consensus
EPS (INR)
FY16
FY17
MOSL forecast
13.5
15.3
Consensus
forecast
13.7
15.6
Variation (%)
-1.3
-2.1
22 May 2015
10

Hindustan Unilever
NOTES
22 May 2015
11

This document has been prepared by Motilal Oswal Securities Limited (hereinafter referred to as Most) to provide information about the company(ies) and/sector(s), if any,
Hindustan
report and may be
covered in the
Unilever
distributed by it and/or its affiliated company(ies). This report is for personal information of the selected recipient/s and does not construe to be any investment, legal or taxation advice to you. This research report does
not constitute an offer, invitation or inducement to invest in securities or other investments and Motilal Oswal Securities Limited (hereinafter referred as MOSt) is not soliciting any action based upon it. This report is not
for public distribution and has been furnished to you solely for your general information and should not be reproduced or redistributed to any other person in any form. This report does not constitute a personal
recommendation or take into account the particular investment objectives, financial situations, or needs of individual clients. Before acting on any advice or recommendation in this material, investors should consider
whether it is suitable for their particular circumstances and, if necessary, seek professional advice. The price and value of the investments referred to in this material and the income from them may go down as well as
up, and investors may realize losses on any investments. Past performance is not a guide for future performance, future returns are not guaranteed and a loss of original capital may occur.
MOSt and its affiliates are a full-service, integrated investment banking, investment management, brokerage and financing group. We and our affiliates have investment banking and other business relationships with a
some companies covered by our Research Department. Our research professionals may provide input into our investment banking and other business selection processes. Investors should assume that MOSt and/or
its affiliates are seeking or will seek investment banking or other business from the company or companies that are the subject of this material and that the research professionals who were involved in preparing this
material may educate investors on investments in such business. The research professionals responsible for the preparation of this document may interact with trading desk personnel, sales personnel and other
parties for the purpose of gathering, applying and interpreting information. Our research professionals are paid on the profitability of MOSt which may include earnings from investment banking and other business.
MOSt generally prohibits its analysts, persons reporting to analysts, and members of their households from maintaining a financial interest in the securities or derivatives of any companies that the analysts cover.
Additionally, MOSt generally prohibits its analysts and persons reporting to analysts from serving as an officer, director, or advisory board member of any companies that the analysts cover. Our salespeople, traders,
and other professionals or affiliates may provide oral or written market commentary or trading strategies to our clients that reflect opinions that are contrary to the opinions expressed herein, and our proprietary
trading and investing businesses may make investment decisions that are inconsistent with the recommendations expressed herein. In reviewing these materials, you should be aware that any or all of the foregoing
among other things, may give rise to real or potential conflicts of interest. MOSt and its affiliated company(ies), their directors and employees and their relatives may; (a) from time to time, have a long or short position
in, act as principal in, and buy or sell the securities or derivatives thereof of companies mentioned herein. (b) be engaged in any other transaction involving such securities and earn brokerage or other compensation
or act as a market maker in the financial instruments of the company(ies) discussed herein or act as an advisor or lender/borrower to such company(ies) or may have any other potential conflict of interests with
respect to any recommendation and other related information and opinions.; however the same shall have no bearing whatsoever on the specific recommendations made by the analyst(s), as the recommendations
made by the analyst(s) are completely independent of the views of the affiliates of MOSt even though there might exist an inherent conflict of interest in some of the stocks mentioned in the research report
Reports based on technical and derivative analysis center on studying charts company's price movement, outstanding positions and trading volume, as opposed to focusing on a company's fundamentals and, as
such, may not match with a report on a company's fundamental analysis. In addition MOST has different business segments / Divisions with independent research separated by Chinese walls catering to different set
of customers having various objectives, risk profiles, investment horizon, etc, and therefore may at times have different contrary views on stocks sectors and markets.
Unauthorized disclosure, use, dissemination or copying (either whole or partial) of this information, is prohibited. The person accessing this information specifically agrees to exempt MOSt or any of its affiliates or
employees from, any and all responsibility/liability arising from such misuse and agrees not to hold MOSt or any of its affiliates or employees responsible for any such misuse and further agrees to hold MOSt or any of
its affiliates or employees free and harmless from all losses, costs, damages, expenses that may be suffered by the person accessing this information due to any errors and delays. The information contained herein is
based on publicly available data or other sources believed to be reliable. Any statements contained in this report attributed to a third party represent MOSt’s interpretation of the data, information and/or opinions
provided by that third party either publicly or through a subscription service, and such use and interpretation have not been reviewed by the third party. This Report is not intended to be a complete statement or
summary of the securities, markets or developments referred to in the document. While we would endeavor to update the information herein on reasonable basis, MOSt and/or its affiliates are under no obligation to
update the information. Also there may be regulatory, compliance, or other reasons that may prevent MOSt and/or its affiliates from doing so. MOSt or any of its affiliates or employees shall not be in any way
responsible and liable for any loss or damage that may arise to any person from any inadvertent error in the information contained in this report. MOSt or any of its affiliates or employees do not provide, at any time,
any express or implied warranty of any kind, regarding any matter pertaining to this report, including without limitation the implied warranties of merchantability, fitness for a particular purpose, and non-infringement.
The recipients of this report should rely on their own investigations.
This report is intended for distribution to institutional investors. Recipients who are not institutional investors should seek advice of their independent financial advisor prior to taking any investment decision based on
this report or for any necessary explanation of its contents.
Most and it’s associates may have managed or co-managed public offering of securities, may have received compensation for investment banking or merchant banking or brokerage services, may have received any
compensation for products or services other than investment banking or merchant banking or brokerage services from the subject company in the past 12 months.
Most and it’s associates have not received any compensation or other benefits from the subject company or third party in connection with the research report.
Subject Company may have been a client of Most or its associates during twelve months preceding the date of distribution of the research report
MOSt and/or its affiliates and/or employees may have interests/positions, financial or otherwise of over 1 % at the end of the month immediately preceding the date of publication of the research in the securities
mentioned in this report. To enhance transparency, MOSt has incorporated a Disclosure of Interest Statement in this document. This should, however, not be treated as endorsement of the views expressed in the
report.
Motilal Oswal Securities Limited is under the process of seeking registration under SEBI (Research Analyst) Regulations, 2014.
There are no material disciplinary action that been taken by any regulatory authority impacting equity research analysis activities
Analyst Certification
The views expressed in this research report accurately reflect the personal views of the analyst(s) about the subject securities or issues, and no part of the compensation of the research analyst(s) was, is, or will be
directly or indirectly related to the specific recommendations and views expressed by research analyst(s) in this report. The research analysts, strategists, or research associates principally responsible for preparation
of MOSt research receive compensation based upon various factors, including quality of research, investor client feedback, stock picking, competitive factors and firm revenues
Disclosure of Interest Statement
Analyst ownership of the stock
Served as an officer, director or employee
ITC
No
No
Disclosures
Regional Disclosures (outside India)
For U.S.
This report is not directed or intended for distribution to or use by any person or entity resident in a state, country or any jurisdiction, where such distribution, publication, availability or use would be contrary to law,
regulation or which would subject MOSt & its group companies to registration or licensing requirements within such jurisdictions.
Motilal Oswal Securities Limited (MOSL) is not a registered broker - dealer under the U.S. Securities Exchange Act of 1934, as amended (the"1934 act") and under applicable state laws in the United States. In
addition MOSL is not a registered investment adviser under the U.S. Investment Advisers Act of 1940, as amended (the "Advisers Act" and together with the 1934 Act, the "Acts), and under applicable state laws in the
United States. Accordingly, in the absence of specific exemption under the Acts, any brokerage and investment services provided by MOSL, including the products and services described herein are not available to or
intended for U.S. persons.
This report is intended for distribution only to "Major Institutional Investors" as defined by Rule 15a-6(b)(4) of the Exchange Act and interpretations thereof by SEC (henceforth referred to as "major institutional
investors"). This document must not be acted on or relied on by persons who are not major institutional investors. Any investment or investment activity to which this document relates is only available to major
institutional investors and will be engaged in only with major institutional investors. In reliance on the exemption from registration provided by Rule 15a-6 of the U.S. Securities Exchange Act of 1934, as amended (the
"Exchange Act") and interpretations thereof by the U.S. Securities and Exchange Commission ("SEC") in order to conduct business with Institutional Investors based in the U.S., MOSL has entered into a chaperoning
agreement with a U.S. registered broker-dealer, Motilal Oswal Securities International Private Limited. ("MOSIPL"). Any business interaction pursuant to this report will have to be executed within the provisions of this
chaperoning agreement.
The Research Analysts contributing to the report may not be registered /qualified as research analyst with FINRA. Such research analyst may not be associated persons of the U.S. registered broker-dealer, MOSIPL,
and therefore, may not be subject to NASD rule 2711 and NYSE Rule 472 restrictions on communication with a subject company, public appearances and trading securities held by a research analyst account.
Motilal Oswal Capital Markets Singapore Pte Limited is acting as an exempt financial advisor under section 23(1)(f) of the Financial Advisers Act(FAA) read with regulation 17(1)(d) of the Financial Advisors
Regulations and is a subsidiary of Motilal Oswal Securities Limited in India. This research is distributed in Singapore by Motilal Oswal Capital Markets Singapore Pte Limited and it is only directed in Singapore to
accredited investors, as defined in the Financial Advisers Regulations and the Securities and Futures Act (Chapter 289), as amended from time to time.
In respect of any matter arising from or in connection with the research you could contact the following representatives of Motilal Oswal Capital Markets Singapore Pte Limited:
Anosh Koppikar
Kadambari Balachandran
Email : anosh.Koppikar@motilaloswal.com
Email : kadambari.balachandran@motilaloswal.com
Contact : (+65)68189232
Contact : (+65) 68189233 / 65249115
Office Address : 21 (Suite 31),16 Collyer Quay,Singapore 04931
For Singapore
Motilal Oswal Securities Ltd
22 May 2015
Motilal Oswal Tower, Level 9, Sayani Road, Prabhadevi, Mumbai 400 025
Phone: +91 22 3982 5500 E-mail: reports@motilaloswal.com
12