29 May 2015
4QFY15 Results Update | Sector:
Utilities
NTPC
BSE SENSEX
27,828
Bloomberg
Equity Shares (m)
52-Week Range (INR)
1, 6, 12 Rel. Per (%)
Free float (%)
S&P CNX
8,434
NTPC IN
8,245.5
169/127
-11/-1/-25
25.0
CMP: INR137
n
TP: INR178 (+30%)
Buy
Robust core business performance; raising earnings estimates
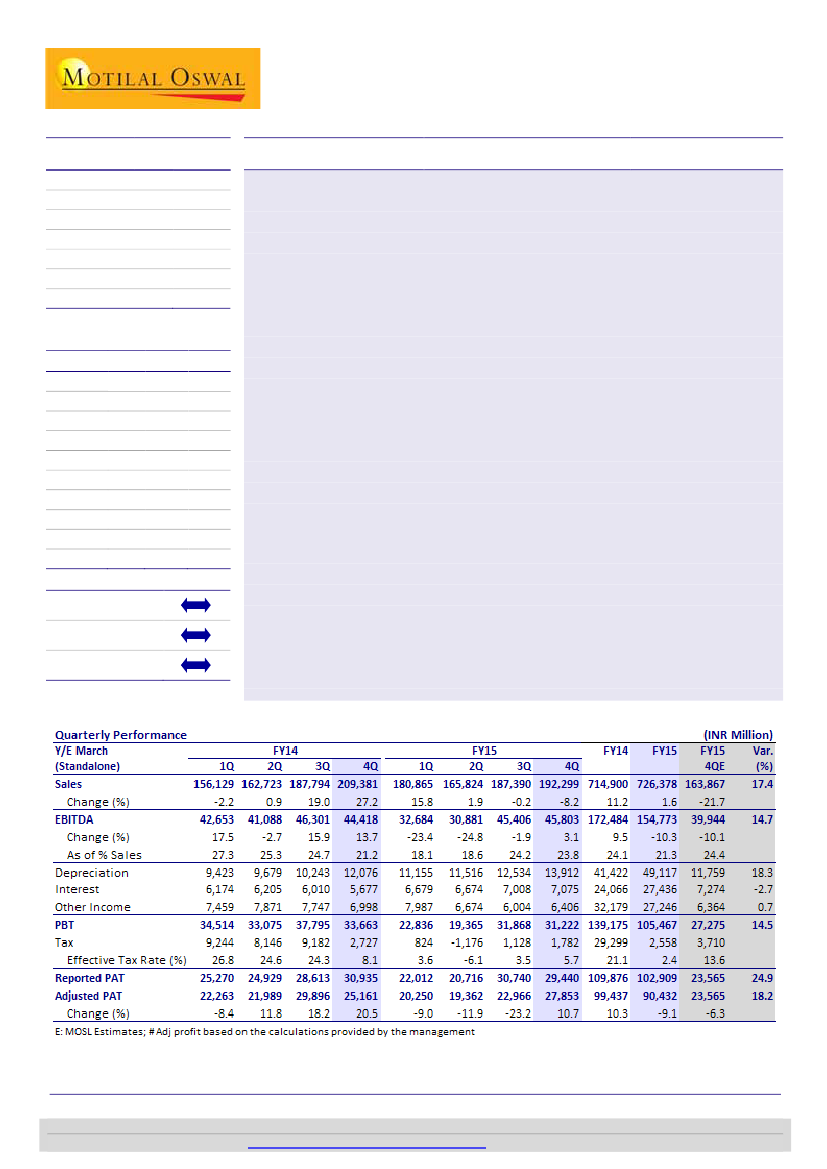
4QFY15 earnings ahead of estimates:
NTPC reported revenue of INR192.2b,
down 8% YoY, but higher than our estimate of INR164b. Revenue growth was
impacted by higher base and new regulation. EBITDA grew 3% YoY to INR45.8b,
15% beat. This is credible, given lower profitability in 1HFY15 owing to new
regulation. Net profit declined 5% YoY to INR29.4b.
Core business performance robust:
NTPC booked prior period revenue of
INR2.4b (above EBITDA) and tax refund of INR834m (below PBT) for the quarter.
Recurring EBITDA was ~INR44b, as the management indicated that all stations
attained normative PAF of 83%+. Recurring PAT was INR28b, 18% beat despite in-
line other income of INR6.4b. Higher fixed charge recovery than incentive
contributed to better performance, in our view, as generation/PLF was muted.
Operational performance broadly in-line:
For 4QFY15, generation was 61.4BUs
(down 2% YoY) versus our estimate of 60.7BUs and sales were 57.5BUs (up 3.5%
YoY) versus our estimate of 55BUs. Coal and gas project PLFs were in-line at
82.7% (600bp lower YoY) and 27% (900bp lower), respectively. Capacity addition
for FY15E is 1.3GW, while FY16 target is 2.6GW.
M.Cap. (INR b)/(USD b) 1,130/17.7
Avg Val (INRm)/Vol ‘000 1152/7816
n
Financials & Valuation (INR Billion)
Y/E MAR
Net Sales
EBITDA
Adj PAT
EPS (INR)
Gr. (%)
BV/Sh.(INR)
RoE (%)
RoCE (%)
P/E (x)
P/BV (x)
2015 2016E 2017E
726.4
160.9
90.4
11.0
-8.9
99.0
10.8
8.4
12.5
1.4
716.4
186.3
98.5
12.0
9.0
93.0
12.4
9.7
11.4
1.5
756.5
219.1
111.3
13.5
12.9
100.3
14.0
11.3
10.1
1.4
n
Estimate change
TP change
Rating change
Raising estimates; reiterating Buy:
NTPC is our top pick, given its relatively robust
business model, strong cash flows, and low leverage. It would be a key beneficiary of
improved demand/generation and valuations are comfortable. We upgrade our
FY16/17 estimates by ~4% and expect net profit of INR98.5b in FY16 (up 10%) and
INR111.3b in FY17 (up 13%). The stock trades at 10.1x FY17E EPS and 1.4x FY17E BV
(RoE of 14%). Bonus debentures and dividend payout provide comfort.
Buy.
Nalin Bhatt
(NalinBhatt@MotilalOswal.com); +91 22 3982 5429
Investors are advised to refer through disclosures made at the end of the Research Report.
Motilal Oswal research is available on
www.motilaloswal.com/Institutional-Equities,
Bloomberg, Thomson Reuters, Factset and S&P Capital.

NTPC
4QFY15 earnings ahead of estimate, core business performance strong
n
n
n
NTPC reported 4QFY15 revenues of INR192.2b, down 8% YoY, led by generation
de-growth of 2% YoY and impact of new regulation. Fuel cost also stood lower
on YoY basis at INR125b, while fuel cost per unit on reported basis stood at
INR2.18/unit (vs INR2.47/unit YoY).
However, the key highlight of the quarter was reported EBIDTA of INR45.8b, up
3% YoY. This compares with 1HFY15 average EBIDTA of ~INR32b.
While NTPC booked prior period revenue of INR2.3b, marginally aiding reported
EBIDTA. However, even after adjusting for same, recurring EBIDTA of INR43.5b is
robust given that profitability was perceived to be sizably impacted under the
new regulation.
Exhibit 1: EBIDTA growth led by core business performance (INR b)
36.3
42.2
40.0
39.1
42.7
41.1
46.3
44.4
32.7
30.9
45.4
45.8
Source: Company, MOSL
n
n
Recurring EBIDTA stood 15% higher than our estimate of INR40b. This is driven
by improvement in fixed charge (FC) recovery of NTPC stations. Management
indicated that all the stations attained normative plant availability factor (PAF)
of 83%+.
Reported PAT for NTPC too stood at INR29.4b, which includes INR2.3b of prior
period of revenues and INR834m impact on account of tax. Recurring PAT stood
at INR27.8b, 18% higher than our estimate. This is credible given that other
income at INR6.4b was in-line with our estimate. Growth in earnings is thus
driven by core business performance.
Exhibit 2: Recurring PAT growth too robust (INR b)
31
26
21
27
22
23
23
20
19
26
23
28
Source: Company, MOSL
29 May 2015
2

NTPC
Operational number in-line, capacity addition back ended
n
n
n
For 4QFY15, generation stood at 61.4BUs (down 2% YoY), vs est of 60.7BUs and
sales stood at 57.5BUs (up 3.5% YoY), vs estimate of 55BUs.
Coal and Gas project PLFs were in-line with estimate at 82.7% (down 600bps
YoY) and 26.7% (900bps lower), respectively. Coal project PAF stood at 97.2% (vs
99.8% YoY) and gas projects at 96.5% (vs 99.7% YoY). Coal materialization stood
at 86% for the quarter and 89% for the year.
Capacity addition for FY15 stood at 1.3GW, vs initial target of 1.8GW.
Management highlighted that FY16E target for capacity addition is 2.6GW,
which includes 250MW Bongaigaon project on best effort basis.
Exhibit 4: Gas based generation remain muted
-1%
5%
2%
4%
1%
-1%
-19%
-3
-20
Gas Gen (BUs)
-8
-1
-19
-1
6
-6
-45
-16
-37
Gr (% YoY)
-35
Exhibit 3: Coal based generation flat QoQ
Coal Gen (BUs)
8%
6%
3%
0%
-3%
49 45 50 54 53
48
55
5%
10%
4%
57
0%
9%
Gr (% YoY)
12%
53 52 56 59 60 52 58 59
-11 3
5.5 5.4 6.3 5.9 5.7 5.1 5.2 3.7 3.7 2.8 3.0 3.1 3.5 3.0 2.9 2.2
Source: MOSL, Company
Exhibit 5: PAF for gas projects remained robust (%)
Thermal - PAF
Gas - PAF
Exhibit 6: PLF for coal projects declined YoY (%)
Thermal - PLF
Gas - PLF
Source: MOSL, Company
Exhibit 7: Capacity addition back ended (GW)
Source: MOSL, Company
29 May 2015
3

NTPC
Re-iterate Buy
High visibility on capacity addition growth:
NTPC is working on 22GW of projects
under construction, while additional 7GW of projects were under tendering stage.
This is 50% growth on current installed base of ~44GW and thus, provides strong
growth visibility. NTPC aims to reach installed capacity base of 128GW 2032, as it
has signed PPAs with State DISCOMs for project and 52GW is under various stage of
feasibility study. NTPC has cash and cash equivalent of ~INR220b and has been
exploring inorganic growth opportunity.
Core business return looking up, key beneficiary of demand growth improvement:
NTPC’s return on core business has been hit under new regulation. Despite this, we
have seen bout of positive surprise in 2HFY15 performance with core RoE of ~20%.
Sustained performance on similar lines would improve confidence on core earnings
and provide re-rating trigger. NTPC will also benefit significantly in the wake of
demand improvement as higher generation above 85% PLF would earn an incentive
of INR0.50/unit.
Relatively better placed:
Power sector in India is facing twin issues of long term
power purchase agreement (PPA) and Fuel. NTPC is favorably placed on PPA front
with assured offtake and is also relatively better placed with higher linkages for its
pre-2009 projects. For new projects, NTPC has been allotted captive mines, with
production potential of 50+m tons. In addition, NTPC can bid for new mines or seek
under allotment route.
Upgrading estimate:
We upgrade our FY16/17E estimate by ~4% and expect net
profit of INR98.5b in FY16E (up 10% YoY) and INR111.3b in FY17E (up 13% YoY).
Stock trades at PER of 10x and P/BV of 1.4 (RoE 14%) on FY17E basis.
Key triggers:
n
Higher generation, PLF and improvement in incentive
n
Inorganic growth
n
Captive mine re-allocation, new mines win/allotment
Key risk factors:
n
Persistent delays in capacity addition
n
Cash flow utilization/capital allocation
Exhibit 8: PER Band
28
24
20
16
12
8
15.8
10.6
16.3
PE (x)
Median(x)
Peak(x)
Min(x)
Avg(x)
25.9
Exhibit 9: PB Band
4.5
3.5
2.5
1.5
11.3
0.5
1.9
1.0
1.3
PB (x)
Median(x)
Peak(x)
Min(x)
3.7
2.0
Avg(x)
Source: MOSL
29 May 2015
4

NTPC
Operating metrics (Quarterly)
Exhibit 10: Operating metrics
1QFY13 2QFY13 3QFY13 4QFY13 1QFY14 2QFY14 3QFY14 4QFY14 1QFY15 2QFY15 3QFY15 4QFY15
Capacity
- NTPC
- JVs
Total
Addition
PLF (%)
- Coal projects
- Gas projects
PAF (%)
- Coal projects
- Gas projects
Operating data
Sales (BUs)
Generation (BUs)
- Coal based
- Gas based
Fuel details
Coal (m tons)
- Imports
Gas (mmscmd)
Per unit data
Realisation
Fuel Cost
34,810
4,364
39,174
2,160
34,810
4,364
39,174
-
34,810
4,864
39,674
500
35,810
5,364
41,174
1,500
35,810
5,364
41,174
-
35,810
5,364
41,174
-
36,970
5,474
42,444
1,270
36,970
5,864
42,834
390
36,970
5,974
42,944
110
36,970
5,974
42,944
-
36,970
5,974
42,944
-
38,030
6,169
44,199
1,255
YoY
2.9%
5.2%
3.2%
QoQ
0.0%
0.0%
0.0%
86.5%
64.5%
88.4%
92.6%
74.9%
57.7%
80.1%
90.2%
84.7%
59.4%
88.6%
90.0%
86.9%
42.6%
92.7%
95.9%
79.1%
42.0%
84.9%
94.4%
75.9%
31.8%
87.5%
87.1%
82.4%
33.8%
95.1%
99.8%
88.7%
35.6%
99.8%
99.7%
84.3%
39.8%
89.3%
90.1%
73.2%
33.4%
76.8%
89.1%
80.8%
31.8%
91.0%
93.2%
82.7%
26.7%
97.2%
96.5%
-6.0% 1.9%
-9.0% -5.1%
-2.6%
-3.3%
6.1%
3.3%
54.7
58.9
53.2
5.7
48.9
52.7
47.6
5.1
56.3
60.6
54.9
5.2
56.4
60.3
56.6
3.7
53.1
57.0
53.3
3.7
50.7
54.5
51.7
2.8
55.3
59.1
56.2
3.0
58.4
62.6
59.5
3.1
58.9
63.1
59.7
3.5
51.5
55.5
52.4
3.0
57.2
61.3
58.4
2.9
57.5
61.4
59.2
2.2
-1.6% 0.4%
-2.0% 0.1%
-0.5% 1.3%
-30.8% -25.2%
36.559
2.771
13.08
33.50
1.5
10.90
41.18
2.899
10.73
43.80
1.93
7.72
38.4
3.8
7.9
37.3
3.5
6.7
39.3
1.2
7.0
45.7
2.3
6.0
39.6
3.6
7.3
36.8
2.9
6.7
44.5
4.9
6.1
46.0
4.9
5.6
0.6% 3.2%
109.0% -0.8%
-6.2% -8.2%
2.92
1.94
3.30
2.03
2.80
1.79
2.92
1.84
2.9
1.8
3.2
2.0
3.4
2.1
3.6
2.5
3.1
2.2
3.2
2.2
3.3
2.1
3.3
2.2
-6.7%
-11.9%
2.2%
2.9%
Source: Company, MOSL
29 May 2015
5

NTPC
Story in charts
Exhibit 11: Capacity addition to be robust (GW)
Exhibit 12: RAB growth to remain strong
RAB (INR b)
Capacity (GW)
34.2
39.2
43.8
48.9 49.9
55.9
64.7
22.5 24.5 25.0
31.7
27.4 29.1 30.1
155 164 167 205 215 227 237 262 301 315 345 397 457 491
Source: MOSL, Company
Exhibit 13: PLF assumption can see an upside
Coal PLF(%)
Gas PLF (%)
Exhibit 14: Generation growth to look up
Agg, Gen Gr (% YoY)
Coal gen. gr. (% YoY)
Gas gen. gr. (% YoY)
88 88 90 92 91 91 88 85 83
81 80 80 81
80 82 81 84 84
71 72 71 70 68 70 66 78 68 67 78 78 65 56 36 33 40 40
FY13
FY14
FY15
FY16E
FY17E
Source: MOSL, Company
Exhibit 15: Earnings growth to inch up, post rebasing
Adjusted net profit (Rs b)
Growth (% YoY)
Exhibit 16: Cash, CWIP partially drag RoE
16%
14%
12%
10%
RoE
Cash, CWIP as a % to capital employed
70
50
30
10
-10
Source: MOSL, Company
29 May 2015
6

NTPC
Financials and valuations
Income Statement
Y/E March
Net Sales
Change (%)
Other operating income
Total Expenditure
% of Sales
EBITDA
Margin (%)
Depreciation
EBIT
Interest
Other Income - Rec.
Exceptional item
Profit before Tax
Current Tax
Tax Rate (%)
Reported PAT
EO Exp/(Inc)
Adjusted PAT
Change (%)
Margin (%)
2011
548,740
18.5
0
422,892
77.1
125,848
22.9
24,857
100,992
21,491
40,995
120,496
29,470
24.5
91,025
11,445
79,580
-5.9
14.5
2012
615,937
12.2
4,586
480,124
78.0
140,399
22.8
27,917
112,482
17,116
27,897
123,262
31,024
25.2
92,237
12,518
79,720
0.2
12.9
2013
641,896
4.2
15,475
486,699
75.8
170,672
26.6
33,968
136,704
19,244
31,485
16,841
165,786
39,592
23.9
126,194
36,055
90,138
13.1
14.0
2014
714,900
11.4
5,290
542,416
75.9
177,774
24.9
41,422
136,352
24,066
26,761
139,047
29,299
21.1
109,747
10,439
99,308
10.2
13.9
2015
726,378
1.6
6,083
571,605
78.7
160,856
22.1
49,117
111,740
27,436
21,163
105,467
2,558
2.4
102,909
-12,477
90,432
-8.9
12.4
2016E
716,443
-1.4
6,387
536,481
74.9
186,349
26.0
50,929
135,420
33,400
23,149
125,169
26,622
21.3
98,546
0
98,546
9.0
13.8
(INR Million)
2017E
756,537
5.6
6,707
544,182
71.9
219,061
29.0
55,916
163,145
45,769
25,261
142,637
31,369
22.0
111,268
0
111,268
12.9
14.7
Balance Sheet
Y/E March
Equity Share Capital
Total Reserves
Net Worth
Deferred liabilities
Total Loans
Capital Employed
Gross Block
Less: Accum. Deprn.
Net Fixed Assets
Capital WIP
Investments
Curr. Assets
Inventory
Account Receivables
Cash and Bank Balance
Others
Curr. Liability & Prov.
Account Payables
Provisions
Net Current Assets
Appl. of Funds
E: MOSL Estimates
2011
82,455
596,468
678,923
3028
439,803
1,121,754
727,552
335,192
392,360
382,706
123,448
353,968
36,391
79,243
161,853
76,481
130,729
103,205
27,524
223,239
1,121,753
2012
82,455
650,457
732,912
6369
476955
1,216,236
818,283
365,719
452,564
418,278
112,064
411,683
37,029
58,325
161,419
154,911
178,353
139,979
38,374
233,330
1,216,236
2013
82,455
721,421
803,875
9153
553348
1,366,376
1,032,457
403,096
629,361
371,094
107,601
2014
82,455
775,699
858,153
10516
651673
1,520,343
1,169,921
448,812
721,108
448,887
97,579
2015
82,455
734,119
816,574
9791
828131
1,654,495
1,442,557
497,929
944,628
408,797
90,321
2016E
82,455
684,202
766,657
9791
831135
1,607,583
1,383,735
548,858
834,877
454,803
69,156
(INR Million)
2017E
82,455
744,215
826,669
9791
900272
1,736,732
1,679,925
604,774
1,075,151
340,493
71,756
514,815
81,658
83,316
82,274
267,567
265,483
207,466
58,016
249,332
1,736,732
817,998.1
491,781
514,361
527,100
519,638
40,572
53,734
74,530
78,015
53,655
52,201
76,044
79,599
168,677
153,114
128,788
105,719
228,877
255,313
247,739
256,304
233,461
261,591
316,352
270,891
156,016
179,771
227,608
208,979
77,445
81,820
88,745
61,912
258,320
252,770
210,748
248,747
1,366,376
1,520,344
1,654,495
1,607,583
384,670.8
498,559.5
699,342.6
725,416.6
29 May 2015
7

NTPC
Financials and valuations
Ratios
Y/E March
Basic (INR)
EPS (Adjusted)
Cash EPS
BV/Share
DPS
Payout (%)
Valuation (x)
P/E
Cash P/E
P/BV
EV/Sales
EV/EBITDA
Dividend Yield (%)
Return Ratios (%)
RoE
RoCE
Working Capital Ratios
Fixed Asset Turnover (x)
Debtor (Days)
Inventory (Days)
Working Capital Turnover (Days)
Leverage Ratio (x)
Current Ratio
Interest Cover Ratio
Debt/Equity
2011
9.7
12.7
82.3
3.8
40.1
14.2
10.8
1.7
2.6
10.6
2.8
12.2
13.3
0.8
53
24
41
2.7
4.7
0.6
2012
9.7
13.1
88.9
4.0
41.5
14.1
10.5
1.5
2.3
9.9
2.9
11.3
12.0
0.8
35
22
43
2.3
6.6
0.7
11.7
14.3
0.6
31
23
51
2.1
7.1
0.7
2013
10.9
15.1
97.5
5.8
43.8
2014
12.0
17.1
104.1
5.8
50.5
11.4
8.0
1.3
2.3
9.1
4.2
12.0
11.3
0.6
27
27
51
2.0
5.7
0.8
2015
11.0
16.9
99.0
5.0
46.1
12.5
8.1
1.4
2.5
11.4
3.6
10.8
8.4
0.5
38
37
41
1.7
4.1
1.0
2016E
12.0
18.1
93.0
4.8
46.1
11.4
7.5
1.5
2.6
9.9
3.5
12.4
9.7
0.5
41
40
73
1.9
4.1
1.1
2017E
13.5
20.3
100.3
5.4
46.1
10.1
6.7
1.4
2.6
8.9
3.9
14.0
11.3
0.5
40
39
81
1.9
3.6
1.1
Cash Flow Statement
Y/E March
OP/(Loss) before Tax
Interest
Depreciation
Direct Taxes Paid
(Inc)/Dec in WC
CF from Operations
CF fr. Oper. incl EO Exp.
(inc)/dec in FA
Free Cash Flow
(Pur)/Sale of Investments
CF from Investments
(Inc)/Dec in Debt
Dividend Paid
Interest
Others
CF from Fin. Activity
Inc/Dec of Cash
Add: Beginning Balance
Closing Balance
E: MOSL Estimates
2011
120,496
21,491
24,857
-29,470
-5,405
131,969
131,969
-120,714
11,255
-24,623
-145,336
53,912
-26,185
-21,491
24,389
30,625
17,258
144,595
161,853
2012
123,262
17,116
27,917
-31,024
-10,525
126,745
126,745
-126,303
442
-11,385
-137,688
44,491
-27,703
-17,116
10,836
10,508
-434
161,853
161,419
2013
165,786
19,244
33,968
-39,592
-17,731
161,674
161,674
-166,990
-5,317
-4,463
-171,453
75,862
-39,593
-19,244
12
17,038
7,258
161,419
168,677
2014
139,047
24,066
41,422
-29,299
-10,014
165,222
165,222
-215,256
-50,034
-10,022
-225,279
96,947
-39,364
-24,066
10,976
44,493
-15,563
168,677
153,114
2015
105,467
27,436
49,117
-2,558
17,696
197,158
197,158
-232,547
-35,390
-7,257
-239,804
165,007
-34,717
-27,436
-84,533
18,321
-24,326
153,114
128,788
2016E
125,169
33,400
50,929
-26,622
-61,068
121,807
121,807
12,817
134,624
-21,165
-8,349
16,946
-33,245
-33,400
-86,829
-136,528
-23,069
128,788
105,719
(INR Million)
2017E
142,637
45,769
55,916
-31,369
-24,030
188,923
188,923
-181,880
7,042
2,600
-179,280
69,137
-37,537
-45,769
-18,918
-33,087
-23,445
105,719
82,274
29 May 2015
8

NTPC
Corporate profile: NTPC
Company description
NTPC is the largest power generator in India with
Installed capacity stands at 41.7GW and contribute
~30% of generation of the electricity in India. It
aims to add 14GW in 12
th
plan v/s ~9GW addition
in 11
th
plan period. It has also ventured into related
areas like coal mining, distribution, transmission,
and gas exploration.
Exhibit 17: Sensex rebased
Exhibit 18: Shareholding pattern (%)
Mar-15
Promoter
DII
FII
Others
75.0
12.3
10.3
2.4
Dec-14
75.0
12.1
10.4
2.5
Mar-14
75.0
12.9
9.3
2.7
Exhibit 19: Top holders
Holder Name
Life Insurance Corporation of India
% Holding
9.9
Note: FII Includes depository receipts
Exhibit 20: Top management
Name
Arup Roy Choudhury
Designation
Chairman & Managing Director
Exhibit 21: Directors
Name
Arup Roy Choudhury
Kulamani Biswal
I J Kapoor
U P Pani
K K Sharma
S C Pandey
*Independent
Name
A K Jha
A Didar Singh*
Prashant Mehta*
Pradeep Kumar
Anil Kumar Singh
Exhibit 22: Auditors
Name
PKF Sridhar & Santhanam
K K Soni & Co
O P Bagla & Co
A R & Co
P S D & Associates
V Sankar Aiyar & Co
Ramesh C Agarwal & Co
Type
Statutory
Statutory
Statutory
Statutory
Statutory
Statutory
Statutory
Exhibit 23: MOSL forecast v/s consensus
EPS
(INR)
FY16
FY17
MOSL
forecast
12.0
13.5
Consensus
forecast
12.0
13.1
Variation
(%)
0.3
3.4
29 May 2015
9

This document has been prepared by Motilal Oswal Securities Limited (hereinafter referred to as Most) to provide information about the company(ies) and/sector(s), if any, covered in the report and may be distributed
NTPC
by it and/or its affiliated company(ies). This report is for personal information of the selected recipient/s and does not construe to be any investment, legal or taxation advice to you. This research report does not
constitute an offer, invitation or inducement to invest in securities or other investments and Motilal Oswal Securities Limited (hereinafter referred as MOSt) is not soliciting any action based upon it. This report is not for
public distribution and has been furnished to you solely for your general information and should not be reproduced or redistributed to any other person in any form. This report does not constitute a personal
recommendation or take into account the particular investment objectives, financial situations, or needs of individual clients. Before acting on any advice or recommendation in this material, investors should consider
whether it is suitable for their particular circumstances and, if necessary, seek professional advice. The price and value of the investments referred to in this material and the income from them may go down as well as
up, and investors may realize losses on any investments. Past performance is not a guide for future performance, future returns are not guaranteed and a loss of original capital may occur.
MOSt and its affiliates are a full-service, integrated investment banking, investment management, brokerage and financing group. We and our affiliates have investment banking and other business relationships with a
some companies covered by our Research Department. Our research professionals may provide input into our investment banking and other business selection processes. Investors should assume that MOSt and/or
its affiliates are seeking or will seek investment banking or other business from the company or companies that are the subject of this material and that the research professionals who were involved in preparing this
material may educate investors on investments in such business. The research professionals responsible for the preparation of this document may interact with trading desk personnel, sales personnel and other
parties for the purpose of gathering, applying and interpreting information. Our research professionals are paid on the profitability of MOSt which may include earnings from investment banking and other business.
MOSt generally prohibits its analysts, persons reporting to analysts, and members of their households from maintaining a financial interest in the securities or derivatives of any companies that the analysts cover.
Additionally, MOSt generally prohibits its analysts and persons reporting to analysts from serving as an officer, director, or advisory board member of any companies that the analysts cover. Our salespeople, traders,
and other professionals or affiliates may provide oral or written market commentary or trading strategies to our clients that reflect opinions that are contrary to the opinions expressed herein, and our proprietary
trading and investing businesses may make investment decisions that are inconsistent with the recommendations expressed herein. In reviewing these materials, you should be aware that any or all of the foregoing
among other things, may give rise to real or potential conflicts of interest. MOSt and its affiliated company(ies), their directors and employees and their relatives may; (a) from time to time, have a long or short position
in, act as principal in, and buy or sell the securities or derivatives thereof of companies mentioned herein. (b) be engaged in any other transaction involving such securities and earn brokerage or other compensation
or act as a market maker in the financial instruments of the company(ies) discussed herein or act as an advisor or lender/borrower to such company(ies) or may have any other potential conflict of interests with
respect to any recommendation and other related information and opinions.; however the same shall have no bearing whatsoever on the specific recommendations made by the analyst(s), as the recommendations
made by the analyst(s) are completely independent of the views of the affiliates of MOSt even though there might exist an inherent conflict of interest in some of the stocks mentioned in the research report
Reports based on technical and derivative analysis center on studying charts company's price movement, outstanding positions and trading volume, as opposed to focusing on a company's fundamentals and, as
such, may not match with a report on a company's fundamental analysis. In addition MOST has different business segments / Divisions with independent research separated by Chinese walls catering to different set
of customers having various objectives, risk profiles, investment horizon, etc, and therefore may at times have different contrary views on stocks sectors and markets.
Unauthorized disclosure, use, dissemination or copying (either whole or partial) of this information, is prohibited. The person accessing this information specifically agrees to exempt MOSt or any of its affiliates or
employees from, any and all responsibility/liability arising from such misuse and agrees not to hold MOSt or any of its affiliates or employees responsible for any such misuse and further agrees to hold MOSt or any of
its affiliates or employees free and harmless from all losses, costs, damages, expenses that may be suffered by the person accessing this information due to any errors and delays. The information contained herein is
based on publicly available data or other sources believed to be reliable. Any statements contained in this report attributed to a third party represent MOSt’s interpretation of the data, information and/or opinions
provided by that third party either publicly or through a subscription service, and such use and interpretation have not been reviewed by the third party. This Report is not intended to be a complete statement or
summary of the securities, markets or developments referred to in the document. While we would endeavor to update the information herein on reasonable basis, MOSt and/or its affiliates are under no obligation to
update the information. Also there may be regulatory, compliance, or other reasons that may prevent MOSt and/or its affiliates from doing so. MOSt or any of its affiliates or employees shall not be in any way
responsible and liable for any loss or damage that may arise to any person from any inadvertent error in the information contained in this report. MOSt or any of its affiliates or employees do not provide, at any time,
any express or implied warranty of any kind, regarding any matter pertaining to this report, including without limitation the implied warranties of merchantability, fitness for a particular purpose, and non-infringement.
The recipients of this report should rely on their own investigations.
This report is intended for distribution to institutional investors. Recipients who are not institutional investors should seek advice of their independent financial advisor prior to taking any investment decision based on
this report or for any necessary explanation of its contents.
Most and it’s associates may have managed or co-managed public offering of securities, may have received compensation for investment banking or merchant banking or brokerage services, may have received any
compensation for products or services other than investment banking or merchant banking or brokerage services from the subject company in the past 12 months.
Most and it’s associates have not received any compensation or other benefits from the subject company or third party in connection with the research report.
Subject Company may have been a client of Most or its associates during twelve months preceding the date of distribution of the research report
MOSt and/or its affiliates and/or employees may have interests/positions, financial or otherwise of over 1 % at the end of the month immediately preceding the date of publication of the research in the securities
mentioned in this report. To enhance transparency, MOSt has incorporated a Disclosure of Interest Statement in this document. This should, however, not be treated as endorsement of the views expressed in the
report.
Motilal Oswal Securities Limited is registered as a Research Analyst under SEBI (Research Analyst) Regulations, 2014. SEBI Reg. No. INH000000412
There are no material disciplinary action that been taken by any regulatory authority impacting equity research analysis activities
Analyst Certification
The views expressed in this research report accurately reflect the personal views of the analyst(s) about the subject securities or issues, and no part of the compensation of the research analyst(s) was, is, or will be
directly or indirectly related to the specific recommendations and views expressed by research analyst(s) in this report. The research analysts, strategists, or research associates principally responsible for preparation
of MOSt research receive compensation based upon various factors, including quality of research, investor client feedback, stock picking, competitive factors and firm revenues
Disclosure of Interest Statement
§
Analyst ownership of the stock
§
Served as an officer, director or employee
NTPC
No
No
Disclosures
A graph of daily closing prices of securities is available at www.nseindia.com and http://economictimes.indiatimes.com/markets/stocks/stock-quotes
Regional Disclosures (outside India)
For U.S.
This report is not directed or intended for distribution to or use by any person or entity resident in a state, country or any jurisdiction, where such distribution, publication, availability or use would be contrary to law,
regulation or which would subject MOSt & its group companies to registration or licensing requirements within such jurisdictions.
Motilal Oswal Securities Limited (MOSL) is not a registered broker - dealer under the U.S. Securities Exchange Act of 1934, as amended (the"1934 act") and under applicable state laws in the United States. In
addition MOSL is not a registered investment adviser under the U.S. Investment Advisers Act of 1940, as amended (the "Advisers Act" and together with the 1934 Act, the "Acts), and under applicable state laws in the
United States. Accordingly, in the absence of specific exemption under the Acts, any brokerage and investment services provided by MOSL, including the products and services described herein are not available to or
intended for U.S. persons.
This report is intended for distribution only to "Major Institutional Investors" as defined by Rule 15a-6(b)(4) of the Exchange Act and interpretations thereof by SEC (henceforth referred to as "major institutional
investors"). This document must not be acted on or relied on by persons who are not major institutional investors. Any investment or investment activity to which this document relates is only available to major
institutional investors and will be engaged in only with major institutional investors. In reliance on the exemption from registration provided by Rule 15a-6 of the U.S. Securities Exchange Act of 1934, as amended (the
"Exchange Act") and interpretations thereof by the U.S. Securities and Exchange Commission ("SEC") in order to conduct business with Institutional Investors based in the U.S., MOSL has entered into a chaperoning
agreement with a U.S. registered broker-dealer, Motilal Oswal Securities International Private Limited. ("MOSIPL"). Any business interaction pursuant to this report will have to be executed within the provisions of this
chaperoning agreement.
The Research Analysts contributing to the report may not be registered /qualified as research analyst with FINRA. Such research analyst may not be associated persons of the U.S. registered broker-dealer, MOSIPL,
and therefore, may not be subject to NASD rule 2711 and NYSE Rule 472 restrictions on communication with a subject company, public appearances and trading securities held by a research analyst account.
Motilal Oswal Capital Markets Singapore Pte Limited is acting as an exempt financial advisor under section 23(1)(f) of the Financial Advisers Act(FAA) read with regulation 17(1)(d) of the Financial Advisors
Regulations and is a subsidiary of Motilal Oswal Securities Limited in India. This research is distributed in Singapore by Motilal Oswal Capital Markets Singapore Pte Limited and it is only directed in Singapore to
accredited investors, as defined in the Financial Advisers Regulations and the Securities and Futures Act (Chapter 289), as amended from time to time.
In respect of any matter arising from or in connection with the research you could contact the following representatives of Motilal Oswal Capital Markets Singapore Pte Limited:
Anosh Koppikar
Kadambari Balachandran
Email : anosh.Koppikar@motilaloswal.com
Email : kadambari.balachandran@motilaloswal.com
Contact : (+65)68189232
Contact : (+65) 68189233 / 65249115
Office Address : 21 (Suite 31),16 Collyer Quay,Singapore 04931
For Singapore
29 May 2015
Motilal Oswal Securities Ltd
Motilal Oswal Tower, Level 9, Sayani Road, Prabhadevi, Mumbai 400 025
Phone: +91 22 3982 5500 E-mail: reports@motilaloswal.com
10