29 May 2015
4QFY15 Results Update | Sector: Metals
SAIL
BSE SENSEX
27,828
Bloomberg
Equity Shares (m)
M.Cap. (INRb)/(USDb)
52-Week Range (INR)
1, 6, 12 Rel. Per (%)
Avg Val/Vol ‘000
Free float
Financials & Valuation (INR b)
Y/E Mar
Sales
EBITDA
NP
Adj. EPS
EPS Gr(%)
BV/Sh.INR
RoE (%)
P/E (x)
P/BV
EV/EBITDA
( )
2015 2016E 2017E
461.2
51.8
21.1
5.1
106.9
4.8
0.7
11.3
500.5
44.3
-1.4
-0.3
104.2
-0.3
0.7
14.8
578.4
69.5
10.3
2.5
104.3
2.4
30.4
0.7
10.2
S&P CNX
8,434
SAIL IN
4,130.1
313.5/5.1
113/65
-12/-23/-40
516/6091
25.0
CMP: INR66
TP: INR41 (-38%)
Sell
Above estimates on lower cost; price and volume headwinds continue
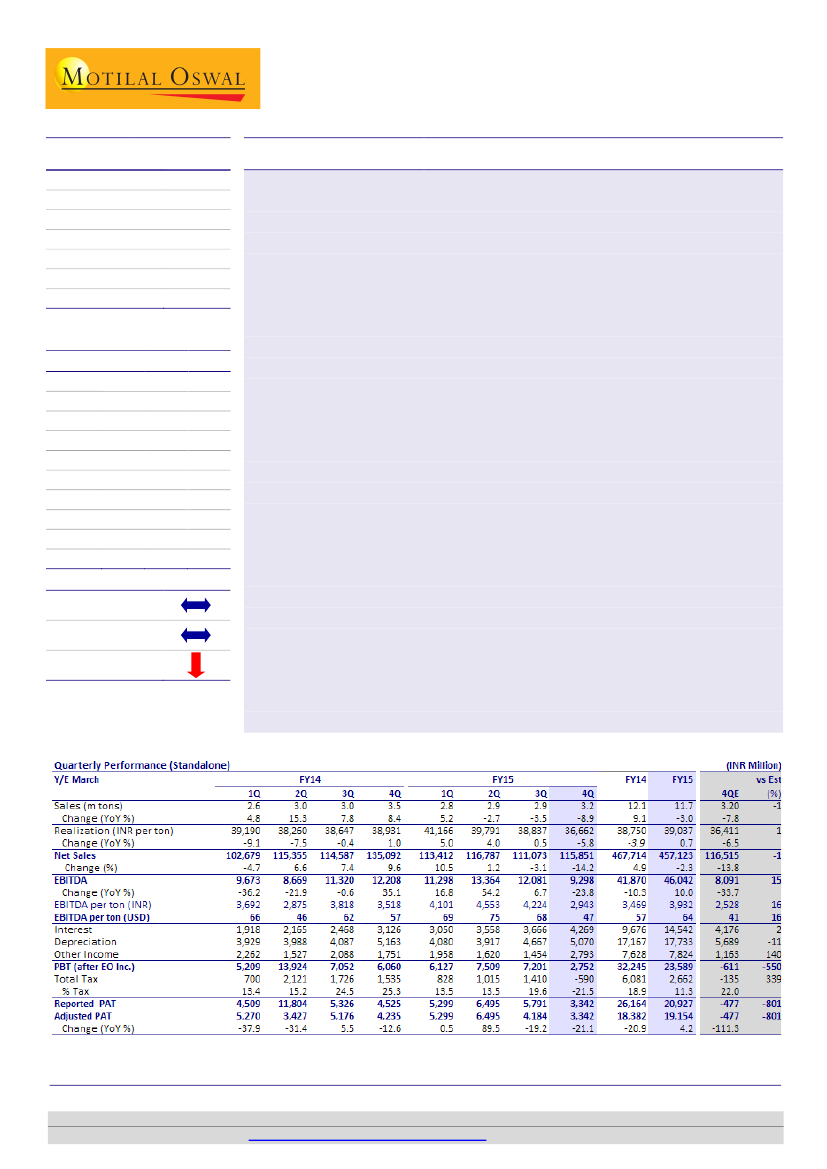
Standalone EBITDA at INR9.3b (down 23% YoY/24% QoQ) was 15% ahead of our
estimate on lower cost. PAT was down 26% YoY (-42% QoQ) to INR3.3b as against our
estimate of a loss of INR477m due to higher other income (INR2.9b v/s est. of
INR1.1b) and tax credit of INR590m.
Volume down 9% YoY:
Steel sales volume declined 9% YoY to 3.16mt on poor
demand. Finished steel inventories increased 90kt QoQ. Saleable steel production
was up 5% YoY (8% QoQ) to 3.4mt. ISP, which was commissioned in 3QFY15,
continues to operate at low levels due to lack of downstream capacities and
typically 9-12 months of stabilization phase. The management is guiding for 2mt
overall volume growth in FY16E to 13.7mt (our est. 14.2mt).
Realization fell 6% QoQ; further downside in 1QFY16:
Net sales realization (NSR)
declined by ~INR2,000/t QoQ (-6%) to INR33,183/ton. The management expects
further cut to the tune of INR1,000-1,500/ton based on the run-rate in April/May.
EBITDA/ton declined INR1,280 QoQ to INR2,943:
Lower realization was partly
offset by INR800/ton QoQ savings in cost. We expect EBITDA/ton to fall further in
1QFY16 to INR1,920 on likely price cut. With lower coking coal prices and volume
leverage, we expect EBITDA/t to improve to ~INR4,260/ton by FY17E. SAIL did not
provide for DMF (MMDRA Act, 2015) unlike Tata Steel, which would have further
impacted profitability.
Interest cost continues to rise; FY16E capex at INR75b:
Interest cost rose 16%
QoQ to INR4.3b as capacities get commissioned while borrowings continue to rise
(INR20b higher QoQ). Capex was INR65b in FY15 and is expected to increase to
INR75b in FY16.
Target price INR41; maintain Sell:
Our FY16E/17E EBITDA is cut by 20%/2% on
lower steel realization partly getting offset by lower coking coal prices in
FY17E,.Our EV/EBITDA-based (6.5x FY17E) target price is INR41 (INR38 earlier).
11.1 -106.9 -814.5
14.9 -217.3
Estimate change
TP change
Rating change
Sanjay Jain
(SanjayJain@MotilalOswal.com); +91 22 3982 5412
Dhruv Muchhal
(Dhruv.Muchhal@MotilalOswal.com); +91 22 3027 8033
Investors are advised to refer through disclosures made at the end of the Research Report.
Motilal Oswal research is available on
www.motilaloswal.com/Institutional-Equities,
Bloomberg, Thomson Reuters, Factset and S&P Capital.

SAIL
Other key highlights
Lower power and fuel cost drive savings:
Lower power and fuel cost was the
key driver of lower-than-expected cost and drove the EBITDA beat of 10%.
Power and fuel cost per ton of saleable steel production came at INR3,700 v/s.
our estimate of INR4,400 and was down from INR3,850 in 4QFY14.
Tax rate at 11.3% for FY15:
SAIL benefited from investment allowance tax
provision in FY15 driving its overall tax rate to just 11.3% (and a deferred tax
asset in 4QFY15). With capitalization of ~INR280b over the next two years, tax
rate is guided to be at 16-17% in FY16E/17E.
Staff cost down 4% YoY adjusted for impact of lower interest rate:
On absolute
basis staff cost grew by 2% to INR97b in FY15. However this included INR5.5b
impact of increase in actuarial valuation reassessment at lower interest rate.
Adjusting for this, staff cost was down 4% to INR91.8b as it benefits from natural
attrition. In 4QFY15 impact of actuarial revaluation was INR3b.
Exhibit 1: Quarterly trends in cost
Net Sales Realization (INR/ton)
Volumes (m tons)
Sales
Prodn. (net of interplant transfer)
Expenditure (INR m)
Inc(-)/Dec in stock & captive cons.
Consumption of Raw Materials
Staff cost
Power & Fuel
Other Expenditure
EBITDA
Costs per ton of production (INR)
Inc(-)/Dec in stock & captive cons.
Consumption of Raw Materials
Staff cost
Power & Fuel
Other Expenditure
EBITDA per ton
of sales volumes
1QFY13 2QFY13 3QFY13 4QFY13 1QFY14 2QFY14 3QFY14 4QFY14 1QFY15 2QFY15 3QFY15 4QFY15
43,110 41,362 38,800 38,533 39,190 38,260 38,647 38,931 41,166 39,791 38,837 36,662
2.5
2.9
-13,073
56,427
19,925
12,240
17,104
15,153
2.6
2.9
-11,209
57,342
20,898
12,739
17,339
11,093
2.8
3.0
-7,143
52,974
20,815
11,140
17,531
11,384
3.2
2.8
11,264
45,274
24,734
12,185
20,808
9,039
2.6
2.9
-6,110
46,676
22,948
11,526
17,967
9,673
3.0
3.0
4,556
46,927
24,954
12,977
17,272
8,669
3.0
3.0
-3,739
50,819
22,678
12,298
21,211
11,320
3.5
3.1
14,240
48,297
25,206
12,621
22,520
12,208
2.8
2.8
-439
44,267
24,585
13,223
20,478
11,298
2.9
3.1
-596
43,691
23,645
14,751
21,931
13,364
2.9
3.0
-6,506
46,665
23,003
13,508
22,322
12,081
3.2
3.2
-6,540
50,611
26,130
12,753
23,599
9,298
-4,582 -3,841 -2,416 4,023 -2,116 1,501 -1,261 4,549
-158
-194 -2,201 -2,015
19,779 19,651 17,920 16,169 16,168 15,462 17,140 15,430 15,946 14,246 15,786 15,592
6,984 7,162 7,041 8,834 7,949 8,222 7,649 8,053 8,856 7,710 7,782 8,050
4,290 4,366 3,769 4,352 3,992 4,276 4,148 4,032 4,763 4,810 4,570 3,929
5,995 5,942 5,931 7,431 6,223 5,691 7,154 7,195 7,377 7,151 7,552 7,270
6,061 4,241 4,140 2,825 3,692 2,875 3,818 3,518 4,101 4,553 4,224 2,943
Source: MOSL, Company
Maintain Sell; target price INR41
NSR is expected to decline further by INR1,000-1,500/t QoQ in 1QFY16 with
more downside risk because import prices are nearly 3000-4000/t lower than
current domestic steel prices. Buildup of steel inventories and continued import
pressure will likely force another price cut.
While we expect volumes to grow by ~2.5mt YoY in FY16E, SAIL is guiding for
volumes increase of ~2mt (it has high leverage to volumes). Moreover, it is
cautious of achieving growth target amid tepid domestic demand and continued
pressure from imports.
Our FY16E EBITDA is cut by 20% to INR38.5b on cut to steel realization estimate.
FY17E EBITDA is cut by 2% to INR63.6b as impact of lower realization is partly
offset by benefit of lower coking coal cost. Our EV/EBITDA based TP (6.5x FY17E)
2
29 May 2015

SAIL
is INR41 (from INR38 earlier) on lower-than-earlier expected net debt in FY17E
(adjustments to working capital estimate).
Key catalyst over the next 12 months
Aggressive exports from Chinese/CIS suppliers.
Delay in production ramp up
Key risks
Currency depreciation which would increase cost of imported steel for domestic
consumers.
Tariff and non-tariff barriers to steel imports
Exhibit 2: Target price derivation
YEAR
Sales (m tons)
EBITDA (INR per ton)
EBITDA
Target EV/EBITDA(x)
Target EV
less: Net Debt (INR m)
add: CWIP (50% disc.)
Equity value
Target price (INR/sh.)
2013
11.1
4,628
51,212
2014
12.1
3,727
44,985
2015
11.7
4,427
51,844
6.5
336,987
274,364
147,992
210,616
51
2016E
2017E
14.2
16.2
3,127
4,296
44,310
69,465
6.5
6.5
288,015
451,524
342,597
396,390
135,492
115,492
80,911
170,626
20
41
Source: MOSL, Company
183,642
361,549
229,317
339,585
Exhibit 3: Metal sector valuation
Rating
Steel
Tata Steel
JSW Steel
SAIL
Non-Ferrous
Hindalco
Nalco
Vedanta
Mining
Coal India
Hindustan Zinc
NMDC
Buy
Buy
Sell
Buy
Buy
Neutral
Buy
Buy
Sell
Price MCAP
EPS
(INR) (USD M) FY15E FY16E FY17E
329
916
66
129
48
197
391
169
129
5,022
3,485
4,284
4,197
1,965
9,178
38,898
11,245
8,059
2.9
74.5
4.2
11.1
4.9
20.3
21.7
19.2
16.6
26.6
48.1
1.3
10.4
5.6
10.3
22.4
14.8
10.4
63.7
62.6
2.6
19.2
6.5
11.4
28.5
16.3
10.4
P/E (x)
FY16E FY17E
12.4
19.1
48.9
12.4
8.6
19.1
17.5
11.4
12.4
5.2
14.6
25.6
6.7
7.4
17.3
13.7
10.4
12.5
EV/EBITDA (x)
FY16E FY17E
7.2
7.3
11.0
7.3
2.6
7.5
9.7
6.1
7.5
5.1
6.7
9.1
5.9
1.5
6.4
P/B(x)
FY15E FY16E
1.8
1.0
0.6
1.1
1.0
0.8
1.6
0.9
0.6
1.0
0.9
0.8
7.4
6.1
5.9
4.9
1.6
1.5
7.7
1.6
1.5
Source: MOSL, Company
29 May 2015
3

SAIL
Story in charts
Exhibit 4: Volumes to increase at 18% CAGR FY15-17E
Volumes (mt)
16.2
6,429
5,343
4,217
3,469
3,932
2,718
3,937
Exhibit 5: But EBITDA/t to remain under pressure
EBITDA/t - INR
11.7
11.4
11.1
12.1
11.7
14.2
FY11
FY12
FY13
FY14
FY15E
FY16E
FY17E
FY11
FY12
FY13
FY14
FY15E
FY16E
FY17E
Source: MOSL, Company
Exhibit 6: Interest/depreciation to see steep rise
Interest - INR b
Depreciation - INR b
32
26
15
5
7
16
7
14
17
10
15
18
20
24
Exhibit 7: Net debt will continue to remain rise
Capex
Net Debt
114
101
95
89
93
68
75
60
FY11
FY12
FY13
FY14
FY15E
FY16E
FY17E
Source: MOSL, Company
Exhibit 8: ROIC to decline further
98.5
71.9
47.9
63.6 60.5
37.2
21.6
14.4
8.8
8.3
3.6
6.3
Exhibit 9: SAIL 1yr fwd EV/EBITDA trading range
16
12
8
4
0
7.7
6.9
1.1
EV/EBDITA(x)
Median(x)
Peak(x)
Min(x)
Avg(x)
15.0
8.1
Source: MOSL, Company
29 May 2015
4

SAIL
Financials and valuations
Income Statement (Consolidated)
Y/E March
Sales (m tons)
Change (%)
Net Sales
Change (%)
Total Expenditure
EBIDTA
Change (%)
EBITDA per ton (INR)
Depreciation
EBIT
Interest
Other income
PBT before EO
Extra ordinary Item
PBT
Current Tax
Defrred Tax
Total Tax
Effective Rate (%)
Reported PAT
Change (%)
Minority Interest
Adjusted PAT
Change (%)
2010
12.1
7.3
405,726
-7.3
311,118
94,608
9.0
7,806
14,296
80,312
4,740
26,909
102,482
464
102,946
33,432
1,049
34,481
33.5
68,465
9.5
3.2
68,153
9.3
2011
11.7
-3.2
433,994
7.0
354,567
79,427
-16.0
6,768
16,030
63,398
5,724
14,923
72,597
1,239
73,836
24,293
-598
23,696
32.1
50,140
-26.8
1.8
49,296
-27.7
2012
11.4
-2.9
466,582
7.5
402,541
64,041
-19.4
5,618
16,859
47,182
7,782
16,046
55,446
-2,620
52,826
15,234
1,663
16,897
32.0
35,930
-28.3
37,711
-23.5
2013
11.1
-2.9
450,872
-3.4
399,660
51,212
-20.0
4,628
15,297
35,916
8,465
9,451
36,902
-2,293
34,608
11,190
124
11,314
32.7
23,294
-35.2
24,836
-34.1
2014
12.1
9.1
471,012
4.5
426,026
44,985
-12.2
3,727
18,419
26,566
10,573
8,005
23,999
9,596
33,594
2,527
4,553
7,079
21.1
26,515
13.8
18,940
-23.7
2015
11.7
-3.0
461,150
-2.1
409,306
51,844
15.2
4,427
18,985
32,859
15,439
7,015
24,436
1,998
26,434
-400
4,060
3,661
13.8
22,773
-14.1
21,050
11.1
(INR Million)
2016E
14.2
21.0
500,507
8.5
456,197
44,310
-14.5
3,127
27,053
17,257
20,942
2,316
-1,370
-1,370
-1,035
1,106
71
-5.2
-1,441
-106.3
-1,443
-106.9
2017E
16.2
14.1
578,386
15.6
508,921
69,465
56.8
4,296
33,316
36,150
24,413
1,959
13,695
13,695
1,827
1,558
3,385
24.7
10,310
-815.5
10,308
-814.5
Balance Sheet (Consolidated)
Y/E March
Sources of Funds
Share Capital
Reserves and Surplus
Share holders fund
Loans
Deferred Tax Liability
Capital Employed
Application of Funds
Gross Fixed Assets
Less: Depreciation
Net Fixed Assets
Capital WIP
Investments
Curr. Assets, Loans & Advances
Inventory
Sundry Debtors
Cash & Bank Balances
Interest Receivable/Accrued
Loans and Advances
Current Liabilities
Sundry Creditors
Other Current Liabilities
Provisions
Net Current Assets
Application of Funds
E: MOSL Estimates
2010
41,304
296,086
337,390
176,378
14,301
528,079
2011
41,304
334,823
376,127
204,751
15,567
596,457
2012
41,305
361,426
402,732
173,606
17,817
594,155
2013
41,305
375,169
416,474
225,405
19,002
660,881
2014
41,305
391,761
433,067
260,896
22,222
716,184
2015
41,305
400,146
441,451
300,437
25,769
767,656
(INR Million)
2016E
41,305
388,942
430,248
340,437
26,875
797,559
2017E
41,305
389,490
430,796
380,437
28,434
839,666
374,194
223,104
151,090
153,822
447
404,391
238,301
166,091
224,220
608
440,657
253,014
187,643
283,157
685
451,411
267,528
183,883
361,549
729
566,469
283,515
282,953
339,585
565
678,487
302,501
375,986
295,985
2,553
778,487
329,554
448,932
270,985
2,553
878,487
362,870
515,617
230,985
2,553
91,617
36,235
227,185
7,863
36,618
115,069
40,799
177,490
25,146
31,549
138,989
48,478
66,623
22,669
36,711
161,657
45,632
41,763
24,772
45,209
153,655
55,006
31,580
24,249
52,656
179,010
32,106
26,073
23,442
78,743
191,975
41,138
-2,160
23,442
78,702
221,847
47,539
-15,954
23,442
79,113
71,240
41,155
64,407
222,717
528,079
32,651
91,210
60,654
205,538
596,457
33,236
97,603
59,962
122,670
594,155
34,449
100,715
69,150
114,720
660,881
32,218
130,415
61,432
93,082
716,184
36,228
144,374
65,640
93,132
767,656
47,994
144,374
65,640
75,089
797,559
55,462
144,374
65,640
90,511
839,666
29 May 2015
5

SAIL
Financials and valuations
Ratios
Y/E March
Basic (INR)
EPS
Cash EPS
Book Value per Share
Dividend Per Share
Valuation (x)
P/E
Cash PE
EV/EBITDA
EV/Sales
EV( USD/Ton)
Price to Book Value
Profitability Ratios (%)
EBITDA Margin
RoE
RoCE (pre-tax)
RoIC (pre-tax)
Turnover Ratios
Debtors (Days)
Inventory (Days)
Creditors (Days)
Working Capital (Days)
Asset Turnover (x)
Leverage Ratio
Debt/Equity (x)
2010
16.5
20.0
81.7
3.3
2011
11.9
16.0
91.1
2.4
2012
9.1
12.8
97.5
2.0
2013
6.0
9.3
100.8
2.0
2014
4.6
10.9
104.8
2.0
2015
5.1
10.1
106.9
2.0
2016E
-0.3
6.2
104.2
2.0
2017E
2.5
10.6
104.3
2.0
6.4
4.7
4.3
0.8
469
0.8
8.3
5.9
6.6
0.9
595
0.8
12.6
8.1
9.7
1.1
1,096
0.8
16.6
7.0
12.1
1.2
1,097
0.7
14.9
7.5
11.3
1.3
1,224
0.7
-217.3
12.2
14.8
1.3
1,129
0.7
30.4
7.2
10.2
1.2
1,071
0.7
23.3
22.0
23.5
60.5
33
82
84
-4
0.8
18.3
13.8
13.9
37.2
34
97
34
24
0.7
13.7
9.7
10.6
21.6
38
109
30
44
0.8
11.4
6.1
7.2
14.4
37
131
31
59
0.7
9.6
4.5
5.0
8.8
43
119
28
48
0.7
11.2
4.8
5.4
8.3
25
142
32
53
0.6
8.9
-0.3
2.5
3.6
30
140
35
56
0.6
12.0
2.4
4.7
6.3
30
140
35
67
0.7
-0.2
0.1
0.3
0.4
0.5
0.6
0.8
0.9
Cash Flow Statement
Y/E March
OP/(Loss) before Tax
Depreciation & Amort.
Interest Paid
Direct Taxes Paid
(Inc)/Dec in Working Capital
CF from Oper. Activity
Other Items
CF after EO Items
(Inc)/Dec in FA & CWIP
Free Cash Flows
CF from Inv. Activity
Inc / (Dec) in Debt
Interest Paid
Dividends Paid
CF from Finan. Activity
Inc / ( Dec) in Cash
Add: Opening Balance
Closing Balance
E: MOSL Estimates
2010
102,946
14,296
4,740
-33,432
-2,904
85,646
-270
85,376
-113,954
-28,388
-114,034
89,714
-4,740
-13,993
70,981
42,322
184,863
227,185
2011
73,836
16,030
5,724
-24,293
-32,517
38,779
1,247
40,026
-100,595
-61,974
-100,753
28,373
-5,724
-11,617
11,032
-49,695
227,185
177,490
2012
52,826
16,859
7,782
-15,234
-27,999
34,234
-1,216
33,018
-95,202
-61,045
-95,279
-31,145
-7,782
-9,681
-48,606
-110,867
177,490
66,623
2013
34,608
15,297
8,465
-11,190
-16,909
30,271
339
30,610
-89,147
-58,920
-89,191
51,799
-8,465
-9,613
33,721
-24,860
66,623
41,763
2014
33,594
18,419
10,573
-2,527
11,454
71,514
-3,928
67,586
-93,093
-21,414
-92,928
35,491
-10,573
-9,760
15,158
-10,184
41,763
31,580
2015
26,434
18,985
15,439
-393
1,555
62,019
-21,937
40,082
-68,400
-8,370
-70,389
50,000
-15,439
-9,762
24,799
-5,507
31,580
26,073
(INR Million)
2016E
-1,370
27,053
20,942
1,076
-10,231
37,471
2017E
13,695
33,316
24,413
-2,238
-28,805
40,381
37,471
-75,000
-37,529
-75,000
40,000
-20,942
-9,762
9,296
-28,233
26,073
-2,160
0.0
40,381
-60,000
-19,619
-60,000
40,000
-24,413
-9,762
5,825
-13,794
-2,160
-15,954
29 May 2015
6

SAIL
Corporate profile: SAIL
Company description
Steel Authority of India Ltd (SAIL), a public sector
undertaking (PSU), is the largest steel producer in
India, with ~20% market share. Its current capacity
of 13mtpa is vertically integrated from mines to
finished steel and is spread across four plants in the
mineral-rich belt of Chhattisgarh, Orissa and
Jharkhand. SAIL is totally self sufficient in iron ore
(captive mines). However, it has to depend on
purchase of coking coal and a large share is
imported. It has a wide range of products and is a
large producer of special steel.
Exhibit 11: Shareholding pattern (%)
Mar-15
Promoter
DII
FII
Others
75.0
15.4
6.0
3.6
Dec-14
75.0
15.2
6.2
3.6
Mar-14
80.0
10.9
5.9
3.2
Exhibit 8: Sensex rebased
120
105
90
75
60
May-14
Aug-14
Nov-14
Feb-15
May-15
SAIL
Sensex - Rebased
Exhibit 12: Top holders
Holder Name
LIC of India
LIC of India Market Plus-1 Growth Fund
% Holding
10.1
1.2
Note: FII Includes depository receipts
Exhibit 13: Top management
Name
C S Verma
Vinod Kumar Thakral
Designation
Chairman
Director
Exhibit 14: Directors
Name
C S Verma
Vinod Kumar Thakral
Anil Kumar Chaudhary
Binod Kumar
Upendra Prasad Singh
Atmanand*
Name
J M Mauskar*
H S Pati
S S Mohanty
T S Suresh
Kalyan Maity
Sunil Barthwal
*Independent
Exhibit 15: Auditors
Name
B N Misra & Co
O P Totla & Co
S K Mittal & Co
K C Kohli & Co
R J Goel & Co
Sanjay Gupta & Associates
Type
Statutory
Statutory
Statutory
Cost Auditor
Cost Auditor
Cost Auditor
Exhibit 16: MOSL forecast v/s consensus
EPS
(INR)
FY16
FY17
MOSL
forecast
-0.3
2.5
Consensus
forecast
6.6
8.1
Variation
(%)
-105.3
-69.3
29 May 2015
7

This document has been prepared by Motilal Oswal Securities Limited (hereinafter referred to as Most) to provide information about the company(ies) and/sector(s), if any, covered in the report and may be distributed
SAIL
by it and/or its affiliated company(ies). This report is for personal information of the selected recipient/s and does not construe to be any investment, legal or taxation advice to you. This research report does not
constitute an offer, invitation or inducement to invest in securities or other investments and Motilal Oswal Securities Limited (hereinafter referred as MOSt) is not soliciting any action based upon it. This report is not for
public distribution and has been furnished to you solely for your general information and should not be reproduced or redistributed to any other person in any form. This report does not constitute a personal
recommendation or take into account the particular investment objectives, financial situations, or needs of individual clients. Before acting on any advice or recommendation in this material, investors should consider
whether it is suitable for their particular circumstances and, if necessary, seek professional advice. The price and value of the investments referred to in this material and the income from them may go down as well as
up, and investors may realize losses on any investments. Past performance is not a guide for future performance, future returns are not guaranteed and a loss of original capital may occur.
MOSt and its affiliates are a full-service, integrated investment banking, investment management, brokerage and financing group. We and our affiliates have investment banking and other business relationships with a
some companies covered by our Research Department. Our research professionals may provide input into our investment banking and other business selection processes. Investors should assume that MOSt and/or
its affiliates are seeking or will seek investment banking or other business from the company or companies that are the subject of this material and that the research professionals who were involved in preparing this
material may educate investors on investments in such business. The research professionals responsible for the preparation of this document may interact with trading desk personnel, sales personnel and other
parties for the purpose of gathering, applying and interpreting information. Our research professionals are paid on the profitability of MOSt which may include earnings from investment banking and other business.
MOSt generally prohibits its analysts, persons reporting to analysts, and members of their households from maintaining a financial interest in the securities or derivatives of any companies that the analysts cover.
Additionally, MOSt generally prohibits its analysts and persons reporting to analysts from serving as an officer, director, or advisory board member of any companies that the analysts cover. Our salespeople, traders,
and other professionals or affiliates may provide oral or written market commentary or trading strategies to our clients that reflect opinions that are contrary to the opinions expressed herein, and our proprietary
trading and investing businesses may make investment decisions that are inconsistent with the recommendations expressed herein. In reviewing these materials, you should be aware that any or all of the foregoing
among other things, may give rise to real or potential conflicts of interest. MOSt and its affiliated company(ies), their directors and employees and their relatives may; (a) from time to time, have a long or short position
in, act as principal in, and buy or sell the securities or derivatives thereof of companies mentioned herein. (b) be engaged in any other transaction involving such securities and earn brokerage or other compensation
or act as a market maker in the financial instruments of the company(ies) discussed herein or act as an advisor or lender/borrower to such company(ies) or may have any other potential conflict of interests with
respect to any recommendation and other related information and opinions.; however the same shall have no bearing whatsoever on the specific recommendations made by the analyst(s), as the recommendations
made by the analyst(s) are completely independent of the views of the affiliates of MOSt even though there might exist an inherent conflict of interest in some of the stocks mentioned in the research report
Reports based on technical and derivative analysis center on studying charts company's price movement, outstanding positions and trading volume, as opposed to focusing on a company's fundamentals and, as
such, may not match with a report on a company's fundamental analysis. In addition MOST has different business segments / Divisions with independent research separated by Chinese walls catering to different set
of customers having various objectives, risk profiles, investment horizon, etc, and therefore may at times have different contrary views on stocks sectors and markets.
Unauthorized disclosure, use, dissemination or copying (either whole or partial) of this information, is prohibited. The person accessing this information specifically agrees to exempt MOSt or any of its affiliates or
employees from, any and all responsibility/liability arising from such misuse and agrees not to hold MOSt or any of its affiliates or employees responsible for any such misuse and further agrees to hold MOSt or any of
its affiliates or employees free and harmless from all losses, costs, damages, expenses that may be suffered by the person accessing this information due to any errors and delays. The information contained herein is
based on publicly available data or other sources believed to be reliable. Any statements contained in this report attributed to a third party represent MOSt’s interpretation of the data, information and/or opinions
provided by that third party either publicly or through a subscription service, and such use and interpretation have not been reviewed by the third party. This Report is not intended to be a complete statement or
summary of the securities, markets or developments referred to in the document. While we would endeavor to update the information herein on reasonable basis, MOSt and/or its affiliates are under no obligation to
update the information. Also there may be regulatory, compliance, or other reasons that may prevent MOSt and/or its affiliates from doing so. MOSt or any of its affiliates or employees shall not be in any way
responsible and liable for any loss or damage that may arise to any person from any inadvertent error in the information contained in this report. MOSt or any of its affiliates or employees do not provide, at any time,
any express or implied warranty of any kind, regarding any matter pertaining to this report, including without limitation the implied warranties of merchantability, fitness for a particular purpose, and non-infringement.
The recipients of this report should rely on their own investigations.
This report is intended for distribution to institutional investors. Recipients who are not institutional investors should seek advice of their independent financial advisor prior to taking any investment decision based on
this report or for any necessary explanation of its contents.
Most and it’s associates may have managed or co-managed public offering of securities, may have received compensation for investment banking or merchant banking or brokerage services, may have received any
compensation for products or services other than investment banking or merchant banking or brokerage services from the subject company in the past 12 months.
Most and it’s associates have not received any compensation or other benefits from the subject company or third party in connection with the research report.
Subject Company may have been a client of Most or its associates during twelve months preceding the date of distribution of the research report
MOSt and/or its affiliates and/or employees may have interests/positions, financial or otherwise of over 1 % at the end of the month immediately preceding the date of publication of the research in the securities
mentioned in this report. To enhance transparency, MOSt has incorporated a Disclosure of Interest Statement in this document. This should, however, not be treated as endorsement of the views expressed in the
report.
Motilal Oswal Securities Limited is registered as a Research Analyst under SEBI (Research Analyst) Regulations, 2014. SEBI Reg. No. INH000000412
There are no material disciplinary action that been taken by any regulatory authority impacting equity research analysis activities
Analyst Certification
The views expressed in this research report accurately reflect the personal views of the analyst(s) about the subject securities or issues, and no part of the compensation of the research analyst(s) was, is, or will be
directly or indirectly related to the specific recommendations and views expressed by research analyst(s) in this report. The research analysts, strategists, or research associates principally responsible for preparation
of MOSt research receive compensation based upon various factors, including quality of research, investor client feedback, stock picking, competitive factors and firm revenues
Disclosure of Interest Statement
Analyst ownership of the stock
Served as an officer, director or employee
SAIL
No
No
Disclosures
A graph of daily closing prices of securities is available at www.nseindia.com and http://economictimes.indiatimes.com/markets/stocks/stock-quotes
Regional Disclosures (outside India)
For U.S.
This report is not directed or intended for distribution to or use by any person or entity resident in a state, country or any jurisdiction, where such distribution, publication, availability or use would be contrary to law,
regulation or which would subject MOSt & its group companies to registration or licensing requirements within such jurisdictions.
Motilal Oswal Securities Limited (MOSL) is not a registered broker - dealer under the U.S. Securities Exchange Act of 1934, as amended (the"1934 act") and under applicable state laws in the United States. In
addition MOSL is not a registered investment adviser under the U.S. Investment Advisers Act of 1940, as amended (the "Advisers Act" and together with the 1934 Act, the "Acts), and under applicable state laws in the
United States. Accordingly, in the absence of specific exemption under the Acts, any brokerage and investment services provided by MOSL, including the products and services described herein are not available to or
intended for U.S. persons.
This report is intended for distribution only to "Major Institutional Investors" as defined by Rule 15a-6(b)(4) of the Exchange Act and interpretations thereof by SEC (henceforth referred to as "major institutional
investors"). This document must not be acted on or relied on by persons who are not major institutional investors. Any investment or investment activity to which this document relates is only available to major
institutional investors and will be engaged in only with major institutional investors. In reliance on the exemption from registration provided by Rule 15a-6 of the U.S. Securities Exchange Act of 1934, as amended (the
"Exchange Act") and interpretations thereof by the U.S. Securities and Exchange Commission ("SEC") in order to conduct business with Institutional Investors based in the U.S., MOSL has entered into a chaperoning
agreement with a U.S. registered broker-dealer, Motilal Oswal Securities International Private Limited. ("MOSIPL"). Any business interaction pursuant to this report will have to be executed within the provisions of this
chaperoning agreement.
The Research Analysts contributing to the report may not be registered /qualified as research analyst with FINRA. Such research analyst may not be associated persons of the U.S. registered broker-dealer, MOSIPL,
and therefore, may not be subject to NASD rule 2711 and NYSE Rule 472 restrictions on communication with a subject company, public appearances and trading securities held by a research analyst account.
Motilal Oswal Capital Markets Singapore Pte Limited is acting as an exempt financial advisor under section 23(1)(f) of the Financial Advisers Act(FAA) read with regulation 17(1)(d) of the Financial Advisors
Regulations and is a subsidiary of Motilal Oswal Securities Limited in India. This research is distributed in Singapore by Motilal Oswal Capital Markets Singapore Pte Limited and it is only directed in Singapore to
accredited investors, as defined in the Financial Advisers Regulations and the Securities and Futures Act (Chapter 289), as amended from time to time.
In respect of any matter arising from or in connection with the research you could contact the following representatives of Motilal Oswal Capital Markets Singapore Pte Limited:
Anosh Koppikar
Kadambari Balachandran
Email : anosh.Koppikar@motilaloswal.com
Email : kadambari.balachandran@motilaloswal.com
Contact : (+65)68189232
Contact : (+65) 68189233 / 65249115
Office Address : 21 (Suite 31),16 Collyer Quay,Singapore 04931
For Singapore
Motilal Oswal Securities Ltd
29 May 2015
Motilal Oswal Tower, Level 9, Sayani Road, Prabhadevi, Mumbai 400 025
Phone: +91 22 3982 5500 E-mail: reports@motilaloswal.com
8