29 May 2015
4QFY15 Results Update | Sector:
Cement
The Ramco Cements
BSE SENSEX
27,828
Bloomberg
Equity Shares (m)
M.Cap. (INR b) / (USD b)
52-Week Range (INR)
1, 6, 12 Rel. Per (%)
Avg Val INRm/Vol ‘000
Free float (%)
S&P CNX
8,434
TRCL IN
238.0
76.9/1.2
380/256
3/-3/7
77/247
57.7
CMP: INR323
TP: INR416 (+29%)
Buy
Strong margin show despite dismal volume; cost moderates QoQ; demand
recovery in south and pricing strength to be the key catalysts
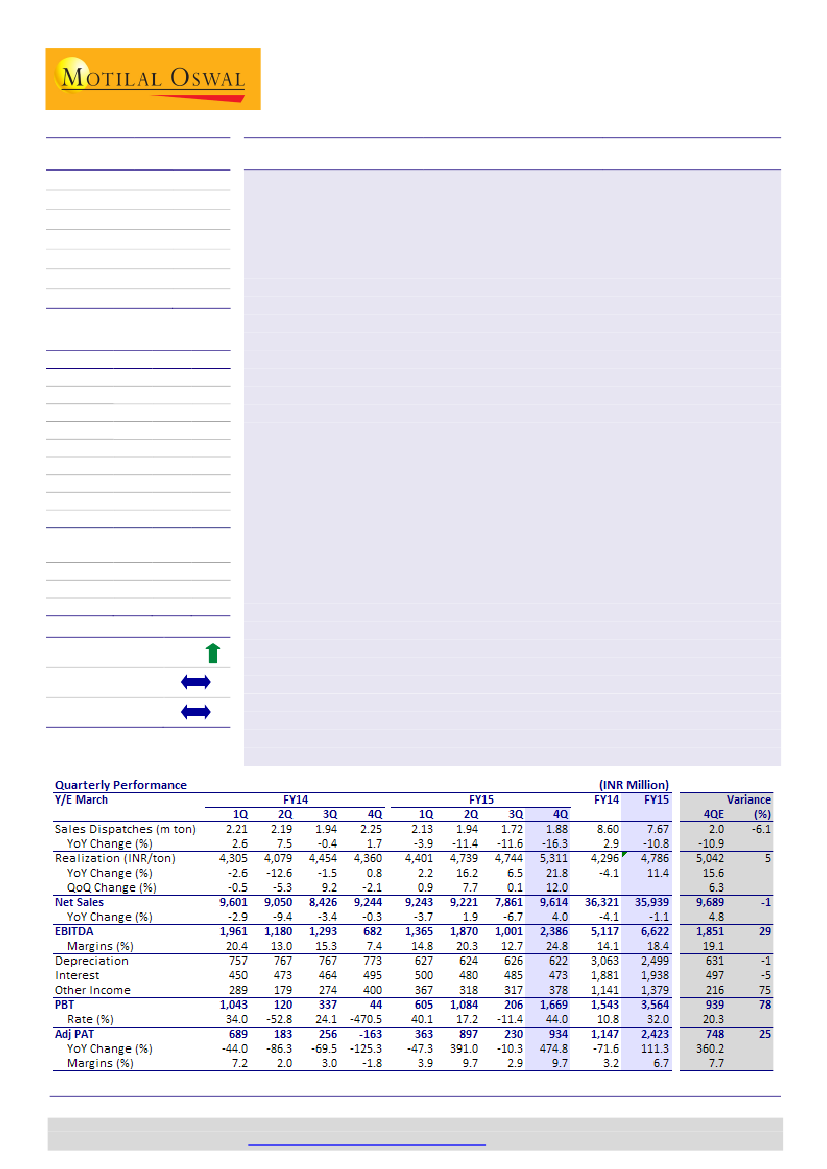
Pricing strength offset dismal volume:
Ramco Cement’s (TRCL) 4QFY15 revenue
stood at INR9.6b (in line)—up 4% YoY and 22% QoQ). Led by strong uptrend in
cement prices in south, TRCL posted 12% QoQ (+22% YoY) growth in realizations,
which more than offset volume trend that were weakest in five years. 4QFY15
volume de-grew 16.3% YoY (+9% QoQ) to 1.88mt.
Strong margin show, 10-Q high profitability:
EBITDA stood at INR2.3b (v/s INR1b
in 3QFY15 and INR682m in 4QFY14) v/s est. of INR1.8b, translating into EBITDA
margin of 24.8% (+12.1ppQoQ, +17.4pp YoY). EBITDA/ton stood at INR1,269
(+INR687 QoQ, +INR966 YoY) v/s est. of INR924. Cement EBITDA/ton stood at
INR1,300. However, higher tax due to change in surcharge on corporate tax
dented PAT, which stood at INR934m (v/s est. of INR748m).
Efficiency measures and fuel price reduction benefit cost:
TRCL posted 4% QoQ
moderation in blended cost/ton (INR3,845/ton). Besides all-round cost efficiency
measures, this was led by softening fuel prices and rise in pet coke mix (~14%).
This was, however, partially negated by increase in royalty on limestone (from
INR63/ton in 3Q to INR80/ton), higher rail freight (negated benefits of diesel price
reduction).
Other updates:
(a) 0.95mt grinding unit at Visakhapatnam, AP commissioned in
March-15, (b) Wind farm division recorded a fall of 5.6crore units in generation of
power compared with FY14, (c) dividend of INR1.5 per share on equity capital
declared (v/s INR1/share in FY14), (d) capex of INR3b-3.5b in FY16 toward
maintenance and clinker de-bottlenecking at Jayanthipuram (AP) plant, which
would augment capacity by ~0.5mt, (e) targets 50% pet coke mix over medium
term.
Valuation and view:
We raise FY16/17E EPS by 16%/8% to factor in for higher
realizations in FY16 (INR22/bag YoY v/s the earlier estimate of INR17/bag YoY) and
lower volume (2% YoY in FY16 v/s the earlier estimate of 5%). The stock trades at
13.2x FY17E EPS and 7.9x FY17E EV/EBITDA, and EV/ton of USD97. We maintain
Buy
with a TP of INR416, an upside of 29% (valuing cement business at EV/ton of
USD120). Demand recovery in south (particularly in AP and Tamil Nadu) with
pricing strength would be the key catalysts.
Financials & Valuation (INR b)
Y/E MAR
2015 2016E 2017E
Sales
35.9 40.5 47.2
EBITDA
6.6
9.3 11.9
NP
2.4
3.9
5.8
Adj EPS (INR) 10.2 16.3 24.4
EPS Gr. (%) 106.8 60.3 49.6
BV/Sh. (INR) 111.1 125.1 146.1
RoE (%)
9.5 13.8 18.0
RoCE (%)
10.2 14.3 19.4
Payout (%)
17.1 14.2 14.3
Valuations
P/E (x)
31.7 19.8 13.2
P/BV (x)
2.9
2.6
2.2
EV/EBITDA
(x) 15.5 10.6
7.9
103
97
EV/Ton (USD)
114
Estimate change
TP change
Rating change
8-16%
Sandipan Pal
(Sandipan.Pal@MotilalOswal.com); +91 22 3982 5436
Jinesh Gandhi
(Jinesh@MotilalOswal.com); +91 22 3982 5416
Investors are advised to refer through disclosures made at the end of the Research Report.
Motilal Oswal research is available on
www.motilaloswal.com/Institutional-Equities,
Bloomberg, Thomson Reuters, Factset and S&P Capital.

The Ramco Cements
Exhibit 1:
Cement
volumes de-grew 16.3% YoY
Volume (MT)
22.1
4.9
24.0
10.7 12.8
0.5 2.6
7.5
-0.4 1.7
Growth (%)
Exhibit 2: Best realizations ever recorded (INR m)
-3.9
-11.4-11.6-16.3
1.9
1.7 2.2 2.2 2.0 2.0 2.2 2.2 2.2 1.9 2.2 2.1 1.9
1.7
Source: Company, MOSL
Exhibit 4:
Lower operating costs coupled with higher realizations
Exhibit 3:
Cement segment EBITDA and margin trend
EBITDA (INR m)
28.0
21.9
31.0 31.4
23.2
15.2
20.4
13.0
15.3
7.4
14.8
20.3
12.7
24.8
Margin (%)
lead to high EBTIDA/ton
Source: Company, MOSL
Exhibit 5: Per ton analysis (incl Windmills)
INR/Ton
Net realization
RM Cost
Employee Expenses
Power, Oil & Fuel
Freight and Handling Outward
Other Expenses
Total Expenses
EBITDA
Cement EBITDA (ex windmills)
4QFY15
5,114
4QFY14
4,114
YoY (%)
24
3QFY15
4,576
QoQ (%)
12
877
320
871
1,051
725
3,845
1,269
1,300
799
249
1,006
1,024
733
3,810
304
335
10
29
-13
3
-1
1
318
287
934
330
915
1,055
759
3,993
-6
-3
-5
0
-4
-4
583
118
589
121
Source: Company, MOSL
Exhibit 6: Revised forecast
(INR M)
Net Sales
EBITDA
Net Profit
EPS (INR)
Rev
40,502
9,329
3,885
16.3
FY16E
Old
40,659
8,090
3,336
14.0
Chg (%)
-0.4
15.3
16.4
16.4
Rev
47,176
11,863
5,812
24.4
FY17E
Old
47,501
10,763
5,377
22.6
Chg (%)
-0.7
10.2
8.1
8.1
Source: Company, MOSL
29 May 2015
2

The Ramco Cements
Valuation and views
TRCL is among the lowest cost cement producers in the South due to focused
initiatives on operating efficiencies, higher usage of captive power (insulates
against tariff rise or unavailability), strategic location of plants, etc.
Strong brand and higher trade segment mix aids premium pricing in core
markets. These give significant competitive advantage and strong profitability
levers in times of recovery.
However delay in recovery of cement demand in south, coupled with ongoing
weakness in TN and deterioration in captive limestone quality (leading higher
import and RM cost) had been an overhang in recent times for TRCL. With
resolution of these issues and likely revival of demand scenario in south over
FY16 offer strong headroom for operating revival.
We raise 16/17E EPS by 16%/8% to factor in for higher realizations in FY16
(INR22/bag YoY v/s earlier estimate of INR17/bag YoY) and lower volume (2%
YoY in FY16 v/s earlier estimate of 5%). The stock trades at 13.2x FY17E EPS and
7.9x FY17E EV/EBITDA and USD97. We maintain
Buy
with TP of INR416, an
upside of 29% (valuing cement business at EV/ton of USD120).
Exhibit 8: Market mix
Utilization (%)
53
7.7
54
8.4
Andhra
Pradesh
12%
Karnataka
9%
Kerala
24%
Source: Company, MOSL
East (WB
and Orissa)
10%
Exhibit 7: Robust utilization headroom
Capacity (mt)
73
65
64
8.0
58
7.3
Dispatch (mt)
60
7.5
58
8.4
59
8.6
50
7.8
5.8
8.0
6.5
10.0 12.5 12.5 12.5 14.5 14.5 14.5 15.5 15.5
Tamil Nadu
45%
Exhibit 9: Expect steady recovery in profitability (EBITDA/ton)
as southern demand picks up…
Exhibit 10: …and will trigger de-leveraging
1,352
1,073
925
702
1,121 1,073
809
541
1,137
1.7
1.9
Net debt (INR b)
1.6
Net DER (x)
1,222
1.6
1.3
1.1
1.2
1.0
0.8
0.5
16.1 24.2 25.3 27.5 26.6 26.1 28.6 26.5 23.4 17.5
FY08 FY09 FY10 FY11 FY12 FY13 FY14 FY15 FY16E FY17E
Source: Company, MOSL
FY08
FY09
FY10
FY11
FY12
FY13
FY14
FY15 FY16E FY17E
Source: Company, MOSL
29 May 2015
3

The Ramco Cements
Financials and valuations
Income Statement
Y/E March
Net Sales
Change (%)
EBITDA
Margin (%)
Depreciation
EBIT
Int. and Finance Charges
Other Income - Rec.
PBT bef. EO Exp.
EO Expense/(Income)
PBT after EO Exp.
Current Tax
Deferred Tax
Tax Rate (%)
Reported PAT
PAT Adj for EO items
Change (%)
Margin (%)
2010
28,009
14.0
8,576
30.6
1,961
6,615
1,515
205
5,305
1
5,304
816
952
33.3
3,536
3,537
-3.1
12.6
2011
26,049
-7.0
6,181
23.7
2,208
3,973
1,399
399
2,973
16
2,957
824
39
29.2
2,094
2,105
-40.5
8.1
2012
32,030
23.0
9,163
28.6
2,539
6,624
1,585
536
5,575
1
5,574
1,121
602
30.9
3,851
3,852
83.0
12.0
2013
37,884
18.3
9,631
25.4
2,806
6,825
1,785
842
5,882
5
5,877
1,174
672
31.4
4,032
4,035
4.8
10.7
2014
36,321
-4.1
5,117
14.1
3,063
2,054
1,881
1,141
1,314
-230
1,543
-44
210
10.8
1,377
1,172
-71.0
3.2
2015
35,939
-1.1
6,622
18.4
2,499
4,123
1,938
1,379
3,564
0
3,564
88
1,053
32.0
2,424
2,424
106.8
6.7
(INR Million)
2016E
40,502
12.7
9,329
23.0
3,027
6,302
1,965
1,375
5,713
0
5,713
1,828
0
32.0
3,885
3,885
60.3
9.6
2017E
47,176
16.5
11,863
25.1
3,137
8,726
1,795
1,615
8,547
0
8,547
2,735
0
32.0
5,812
5,812
49.6
12.3
Balance Sheet
Y/E March
Equity Share Capital
Total Reserves
Net Worth
Deferred Liabilities
Total Loans
Capital Employed
Gross Block
Less: Accum. Deprn.
Net Fixed Assets
Capital WIP
Total Investments
2010
238
15,344
15,582
5,918
25,665
47,164
48,111
11,186
36,925
3,177
887
2011
238
17,107
17,345
5,890
27,912
51,147
51,105
13,175
37,930
5,457
2,673
10,988
3,923
1,751
400
4,913
5,900
4,564
1,335
5,088
51,147
2012
238
20,266
20,504
6,492
27,104
54,100
56,704
15,553
41,152
5,276
2,665
11,491
4,911
2,079
475
4,026
6,483
4,892
1,591
5,008
54,100
2013
238
23,470
23,708
7,164
26,671
57,542
63,568
18,359
45,209
2,300
2,658
14,547
5,948
3,028
536
5,035
7,172
5,300
1,873
7,375
57,542
2014
238
24,583
24,821
7,374
29,000
61,195
69,375
21,422
47,953
2,000
2,834
15,899
6,855
3,040
447
5,557
7,492
6,443
1,049
8,407
61,195
2015
238
26,214
26,452
8,271
27,136
61,859
73,925
23,920
50,004
1,000
3,558
15,763
5,206
3,802
618
6,136
8,844
7,221
1,623
6,919
61,859
(INR Million)
2016E
238
29,545
29,783
8,271
24,136
62,190
77,425
26,947
50,477
1,000
3,558
16,591
5,707
3,804
739
6,341
9,437
7,609
1,828
7,154
62,190
2017E
238
34,527
34,765
8,271
18,136
61,172
79,425
30,084
49,340
1,000
3,558
17,586
6,204
4,136
599
6,647
10,312
8,124
2,188
7,274
61,172
Curr. Assets, Loans&Adv.
11,357
Inventory
4,125
Account Receivables
1,555
Cash and Bank Balance
356
Loans and Advances
5,320
Curr. Liability & Prov.
5,462
Account Payables
4,265
Provisions
1,198
Net Current Assets
5,894
Appl. of Funds
47,164
E: MOSL Estimates; * Adjusted for treasury stocks
29 May 2015
4

The Ramco Cements
Financials and valuations
Ratios
Y/E March
Basic (INR)
Consol EPS
Cash EPS
BV/Share
DPS
Payout (%)
Valuation (x)
P/E
Cash P/E
P/BV
EV/Sales
EV/EBITDA
EV/Ton (US$)
Dividend Yield (%)
Return Ratios (%)
RoE
RoCE
Working Capital Ratios
Asset Turnover (x)
Inventory (Days)
Debtor (Days)
Leverage Ratio (x)
Current Ratio
Debt/Equity
2010
15
23
65
2.0
15.8
2011
9
18
73
1.3
16.5
2012
16.2
26.9
86.2
2.5
18.0
2013
17.0
28.7
99.6
3.0
20.6
2014
4.9
17.8
104.3
1.0
20.2
2015
10.2
20.7
111.1
1.5
17.1
2016E
16.3
29.0
125.1
2.0
14.2
2017E
24.4
37.6
146.1
3.0
14.3
65.6
18.2
3.1
2.8
20.2
115
0.3
31.7
15.6
2.9
2.9
15.5
114
0.5
19.8
11.1
2.6
2.5
10.6
103
0.6
13.2
8.6
2.2
2.0
7.9
97
0.9
25.1
17.4
12.8
10.1
20.4
15.4
18.3
15.6
4.8
6.1
9.5
10.2
13.8
14.3
18.0
19.4
0.6
53.8
18
0.5
55.0
22
0.6
56.0
21
0.7
57.3
26
0.6
68.9
27
0.6
52.9
34
0.7
51.4
30
0.8
48.0
28
2.1
1.6
1.9
1.6
1.8
1.3
2.0
1.1
2.1
1.2
1.8
1.8
1.7
1.0
0.8
0.5
Cash Flow Statement
Y/E March
Oper. Profit/(Loss) before Tax
Interest/Dividends Recd.
Depreciation
Direct Taxes Paid
(Inc)/Dec in WC
CF from Operations
EO expense
CF from Operating incl EO
(inc)/dec in FA
Free Cash Flow
(Pur)/Sale of Investments
CF from investments
Issue of Shares
(Inc)/Dec in Debt
Interest Paid
Dividend Paid
CF from Fin. Activity
Inc/Dec of Cash
Add: Beginning Balance
Closing Balance
2010
6,615
205
1,961
-816
-1,190
6,775
-4
6,771
-5,759
1,013
-1
-5,760
0
1,031
-1,515
-557
-1,042
-30
386
356
2011
3,973
399
2,208
-824
850
6,606
-21
6,585
-5,273
1,312
-1,785
-7,058
16
2,247
-1,399
-346
517
44
356
400
2012
6,624
536
2,539
-1,121
155
8,732
-162
8,570
-5,419
3,152
8
-5,411
0
-808
-1,585
-692
-3,084
75
400
475
2013
6,825
842
2,806
-1,174
-2,306
6,993
-5
6,989
-3,888
3,101
7
-3,881
2
-434
-1,785
-830
-3,047
61
475
536
2014
2,054
1,141
3,063
44
-1,121
5,180
230
5,410
-5,507
-97
-176
-5,684
15
2,330
-1,881
-279
184
-89
536
447
2015
4,123
1,379
2,499
-244
1,282
9,039
0
9,039
-3,550
5,489
-724
-4,274
-378
-1,864
-1,938
-415
-4,594
171
447
618
(INR Million)
2016E
6,302
1,375
3,027
-1,828
263
9,139
0
9,139
-3,500
5,639
0
-3,500
0
-3,000
-1,965
-553
-5,518
122
618
739
2017E
8,726
1,615
3,137
-2,735
-260
10,484
0
10,484
-2,000
8,484
0
-2,000
0
-6,000
-1,795
-830
-8,624
-141
739
599
29 May 2015
5

The Ramco Cements
Corporate profile
Company description
The Ramco Cements (TRCL) is one of the top three
cement producers in South India with total
nameplate capacity of 12.5mtpa (0.95mtpa in West
Bengal and the balance in the South). It also has
operational wind farm capacity of 159MW and
157MW of CPP capacity. Despite the unfavorable
southern market, MC offers an attractive play due
to superior operating efficiency, premium
profitability and strong FCF visibility.
Exhibit 11: Sensex rebased
The Ramco Cement
370
340
310
280
250
May-14
Aug-14
Nov-14
Feb-15
May-15
Sensex - Rebased
Exhibit 12: Shareholding pattern (%)
Mar-15
Promoter
DII
FII
Others
42.3
21.0
16.9
19.8
Dec-14
42.3
19.2
18.0
20.5
Mar-14
42.3
18.2
18.7
20.8
Exhibit 13: Top holders
Holder Name
Aberdeen Global Asian Smaller Companies Fund
The Governor Government of Tamil Nadu
Sudarshan Securities Pvt Ltd
Reliance Capital Trustee Co. Ltd
Aberdeen Global Emerging Markets Smaller
% Holding
4.0
3.4
2.5
2.3
2.1
Note: FII Includes depository receipts
Exhibit 14: Top management
Name
P R Ramasubrahmaneya Rajha
P R Venketrama Raja
Designation
Chairman & MD
Director
Exhibit 15: Directors
Name
P R Ramasubrahmaneya Rajha
P R Venketrama Raja
M B N Rao*
Name
R S Agarwal*
M M Venkatachalam*
Swaran Singh
*Independent
Exhibit 16: Auditors
Name
CNGSN & Associates
M S Jagannathan & N Krishnaswami
Geeyes & Co
Type
Statutory
Statutory
Cost Auditor
Exhibit 17: MOSL forecast v/s consensus
EPS
(INR)
FY16
FY17
MOSL
forecast
16.3
24.4
Consensus
forecast
16.2
25.1
Variation
(%)
0.9
-2.8
29 May 2015
6

The Ramco Cements
NOTES
29 May 2015
7

This document has been prepared by Motilal Oswal Securities Limited (hereinafter referred to as Most) to provide information about the company(ies) and/sector(s), if any, covered in the report and may be distributed
by it and/or its affiliated company(ies). This report is for personal information of the selected recipient/s and does not construe to be any investment, legal or taxation advice to you. This research report does not
The Ramco Cements
constitute an offer, invitation or inducement to invest in securities or other investments and Motilal Oswal Securities Limited (hereinafter referred as MOSt) is not soliciting any action based upon it. This report is not for
public distribution and has been furnished to you solely for your general information and should not be reproduced or redistributed to any other person in any form. This report does not constitute a personal
recommendation or take into account the particular investment objectives, financial situations, or needs of individual clients. Before acting on any advice or recommendation in this material, investors should consider
whether it is suitable for their particular circumstances and, if necessary, seek professional advice. The price and value of the investments referred to in this material and the income from them may go down as well as
up, and investors may realize losses on any investments. Past performance is not a guide for future performance, future returns are not guaranteed and a loss of original capital may occur.
MOSt and its affiliates are a full-service, integrated investment banking, investment management, brokerage and financing group. We and our affiliates have investment banking and other business relationships with a
some companies covered by our Research Department. Our research professionals may provide input into our investment banking and other business selection processes. Investors should assume that MOSt and/or
its affiliates are seeking or will seek investment banking or other business from the company or companies that are the subject of this material and that the research professionals who were involved in preparing this
material may educate investors on investments in such business. The research professionals responsible for the preparation of this document may interact with trading desk personnel, sales personnel and other
parties for the purpose of gathering, applying and interpreting information. Our research professionals are paid on the profitability of MOSt which may include earnings from investment banking and other business.
MOSt generally prohibits its analysts, persons reporting to analysts, and members of their households from maintaining a financial interest in the securities or derivatives of any companies that the analysts cover.
Additionally, MOSt generally prohibits its analysts and persons reporting to analysts from serving as an officer, director, or advisory board member of any companies that the analysts cover. Our salespeople, traders,
and other professionals or affiliates may provide oral or written market commentary or trading strategies to our clients that reflect opinions that are contrary to the opinions expressed herein, and our proprietary
trading and investing businesses may make investment decisions that are inconsistent with the recommendations expressed herein. In reviewing these materials, you should be aware that any or all of the foregoing
among other things, may give rise to real or potential conflicts of interest. MOSt and its affiliated company(ies), their directors and employees and their relatives may; (a) from time to time, have a long or short position
in, act as principal in, and buy or sell the securities or derivatives thereof of companies mentioned herein. (b) be engaged in any other transaction involving such securities and earn brokerage or other compensation
or act as a market maker in the financial instruments of the company(ies) discussed herein or act as an advisor or lender/borrower to such company(ies) or may have any other potential conflict of interests with
respect to any recommendation and other related information and opinions.; however the same shall have no bearing whatsoever on the specific recommendations made by the analyst(s), as the recommendations
made by the analyst(s) are completely independent of the views of the affiliates of MOSt even though there might exist an inherent conflict of interest in some of the stocks mentioned in the research report
Reports based on technical and derivative analysis center on studying charts company's price movement, outstanding positions and trading volume, as opposed to focusing on a company's fundamentals and, as
such, may not match with a report on a company's fundamental analysis. In addition MOST has different business segments / Divisions with independent research separated by Chinese walls catering to different set
of customers having various objectives, risk profiles, investment horizon, etc, and therefore may at times have different contrary views on stocks sectors and markets.
Unauthorized disclosure, use, dissemination or copying (either whole or partial) of this information, is prohibited. The person accessing this information specifically agrees to exempt MOSt or any of its affiliates or
employees from, any and all responsibility/liability arising from such misuse and agrees not to hold MOSt or any of its affiliates or employees responsible for any such misuse and further agrees to hold MOSt or any of
its affiliates or employees free and harmless from all losses, costs, damages, expenses that may be suffered by the person accessing this information due to any errors and delays. The information contained herein is
based on publicly available data or other sources believed to be reliable. Any statements contained in this report attributed to a third party represent MOSt’s interpretation of the data, information and/or opinions
provided by that third party either publicly or through a subscription service, and such use and interpretation have not been reviewed by the third party. This Report is not intended to be a complete statement or
summary of the securities, markets or developments referred to in the document. While we would endeavor to update the information herein on reasonable basis, MOSt and/or its affiliates are under no obligation to
update the information. Also there may be regulatory, compliance, or other reasons that may prevent MOSt and/or its affiliates from doing so. MOSt or any of its affiliates or employees shall not be in any way
responsible and liable for any loss or damage that may arise to any person from any inadvertent error in the information contained in this report. MOSt or any of its affiliates or employees do not provide, at any time,
any express or implied warranty of any kind, regarding any matter pertaining to this report, including without limitation the implied warranties of merchantability, fitness for a particular purpose, and non-infringement.
The recipients of this report should rely on their own investigations.
This report is intended for distribution to institutional investors. Recipients who are not institutional investors should seek advice of their independent financial advisor prior to taking any investment decision based on
this report or for any necessary explanation of its contents.
Most and it’s associates may have managed or co-managed public offering of securities, may have received compensation for investment banking or merchant banking or brokerage services, may have received any
compensation for products or services other than investment banking or merchant banking or brokerage services from the subject company in the past 12 months.
Most and it’s associates have not received any compensation or other benefits from the subject company or third party in connection with the research report.
Subject Company may have been a client of Most or its associates during twelve months preceding the date of distribution of the research report
MOSt and/or its affiliates and/or employees may have interests/positions, financial or otherwise of over 1 % at the end of the month immediately preceding the date of publication of the research in the securities
mentioned in this report. To enhance transparency, MOSt has incorporated a Disclosure of Interest Statement in this document. This should, however, not be treated as endorsement of the views expressed in the
report.
Motilal Oswal Securities Limited is registered as a Research Analyst under SEBI (Research Analyst) Regulations, 2014. SEBI Reg. No. INH000000412
There are no material disciplinary action that been taken by any regulatory authority impacting equity research analysis activities
Analyst Certification
The views expressed in this research report accurately reflect the personal views of the analyst(s) about the subject securities or issues, and no part of the compensation of the research analyst(s) was, is, or will be
directly or indirectly related to the specific recommendations and views expressed by research analyst(s) in this report. The research analysts, strategists, or research associates principally responsible for preparation
of MOSt research receive compensation based upon various factors, including quality of research, investor client feedback, stock picking, competitive factors and firm revenues
Disclosure of Interest Statement
Analyst ownership of the stock
Served as an officer, director or employee
THE RAMCO CEMENTS
No
No
Disclosures
A graph of daily closing prices of securities is available at www.nseindia.com and http://economictimes.indiatimes.com/markets/stocks/stock-quotes
Regional Disclosures (outside India)
For U.S.
This report is not directed or intended for distribution to or use by any person or entity resident in a state, country or any jurisdiction, where such distribution, publication, availability or use would be contrary to law,
regulation or which would subject MOSt & its group companies to registration or licensing requirements within such jurisdictions.
Motilal Oswal Securities Limited (MOSL) is not a registered broker - dealer under the U.S. Securities Exchange Act of 1934, as amended (the"1934 act") and under applicable state laws in the United States. In
addition MOSL is not a registered investment adviser under the U.S. Investment Advisers Act of 1940, as amended (the "Advisers Act" and together with the 1934 Act, the "Acts), and under applicable state laws in the
United States. Accordingly, in the absence of specific exemption under the Acts, any brokerage and investment services provided by MOSL, including the products and services described herein are not available to or
intended for U.S. persons.
This report is intended for distribution only to "Major Institutional Investors" as defined by Rule 15a-6(b)(4) of the Exchange Act and interpretations thereof by SEC (henceforth referred to as "major institutional
investors"). This document must not be acted on or relied on by persons who are not major institutional investors. Any investment or investment activity to which this document relates is only available to major
institutional investors and will be engaged in only with major institutional investors. In reliance on the exemption from registration provided by Rule 15a-6 of the U.S. Securities Exchange Act of 1934, as amended (the
"Exchange Act") and interpretations thereof by the U.S. Securities and Exchange Commission ("SEC") in order to conduct business with Institutional Investors based in the U.S., MOSL has entered into a chaperoning
agreement with a U.S. registered broker-dealer, Motilal Oswal Securities International Private Limited. ("MOSIPL"). Any business interaction pursuant to this report will have to be executed within the provisions of this
chaperoning agreement.
The Research Analysts contributing to the report may not be registered /qualified as research analyst with FINRA. Such research analyst may not be associated persons of the U.S. registered broker-dealer, MOSIPL,
and therefore, may not be subject to NASD rule 2711 and NYSE Rule 472 restrictions on communication with a subject company, public appearances and trading securities held by a research analyst account.
Motilal Oswal Capital Markets Singapore Pte Limited is acting as an exempt financial advisor under section 23(1)(f) of the Financial Advisers Act(FAA) read with regulation 17(1)(d) of the Financial Advisors
Regulations and is a subsidiary of Motilal Oswal Securities Limited in India. This research is distributed in Singapore by Motilal Oswal Capital Markets Singapore Pte Limited and it is only directed in Singapore to
accredited investors, as defined in the Financial Advisers Regulations and the Securities and Futures Act (Chapter 289), as amended from time to time.
In respect of any matter arising from or in connection with the research you could contact the following representatives of Motilal Oswal Capital Markets Singapore Pte Limited:
Anosh Koppikar
Kadambari Balachandran
Email : anosh.Koppikar@motilaloswal.com
Email : kadambari.balachandran@motilaloswal.com
Contact : (+65)68189232
Contact : (+65) 68189233 / 65249115
Office Address : 21 (Suite 31),16 Collyer Quay,Singapore 04931
For Singapore
Motilal Oswal Securities Ltd
29 May 2015
Motilal Oswal Tower, Level 9, Sayani Road, Prabhadevi, Mumbai 400 025
Phone: +91 22 3982 5500 E-mail: reports@motilaloswal.com
8