23 June 2015
Update | Sector: Technology
MindTree Consulting
BSE Sensex
27,804
S&P CNX
8,382
CMP: INR1,351
TP: INR1,300 (-4%)
Neutral
Digital-ready
Capabilities, references in fast-growing Digital drive growth confidence
Stock Info
Bloomberg
Equity Shares (m)
52-Week Range (INR)
1, 6, 12 Rel. Per (%)
M.Cap. (INR b)
M.Cap. (USD b)
Avg Val(INRm)/Vol‘000
Free float (%)
MTCL IN
83.7
1,589/834
-6/10/41
113.1
1.8
255/214
86.3
Financial Snapshot (INR Billion)
Y/E Mar
2015 2016E 2017E
Net Sales
35.6 41.8 49.7
EBITDA
Adj PAT
EPS (INR)
Growth (%)
BV/Sh. (INR)
RoE (%)
RoCE (%)
P/E (x)
P/BV (x)
7.1
5.4
63.9
18.6
29.4
32.8
21.2
5.6
8.4
6.1
72.7
13.8
27.5
31.8
18.6
4.7
10.7
7.7
91.7
26.1
28.7
33.9
14.7
3.9
Shareholding Pattern (%)
As on
Mar-15 Dec-14 Mar-14
Promoter
DII
FII
Others
13.7
7.9
37.7
40.7
13.7
7.9
39.9
38.4
16.6
10.1
36.0
37.3
MTCL cited that the opportunity size in Digital-led IT services is expected to grow
to USD220b by 2020. The company has built significant capabilities and
references in Digital, and remains confident of continuing industry-leading
growth on the back of Digital push.
MTCL’s growth endeavor is focused on pillars of consultative selling, enabling
clients’ Digital transformation, focused acquisitions, and global expansion.
While pricing in Digital in the experimental stage is not at a premium, deal sizes
get significantly bigger as the programs move beyond the proof-of-concept stage.
MTCL expects traditional services (67% of the business) to continue driving
majority revenues despite faster growth in Digital. Its endeavor in traditional is to
differentiate every offering, aptly illustrated by its mWatch platform for IMS.
At 18.6x FY16E and 14.7x FY17E EPS, the stock trades well above the average
across its listed history (seven years). We believe that premium is justified, given
the execution over the last few years, but see limited upside to CMP at current
levels.
239.5 288.1 350.9
“Locally local”, mining-focused, Digital approach
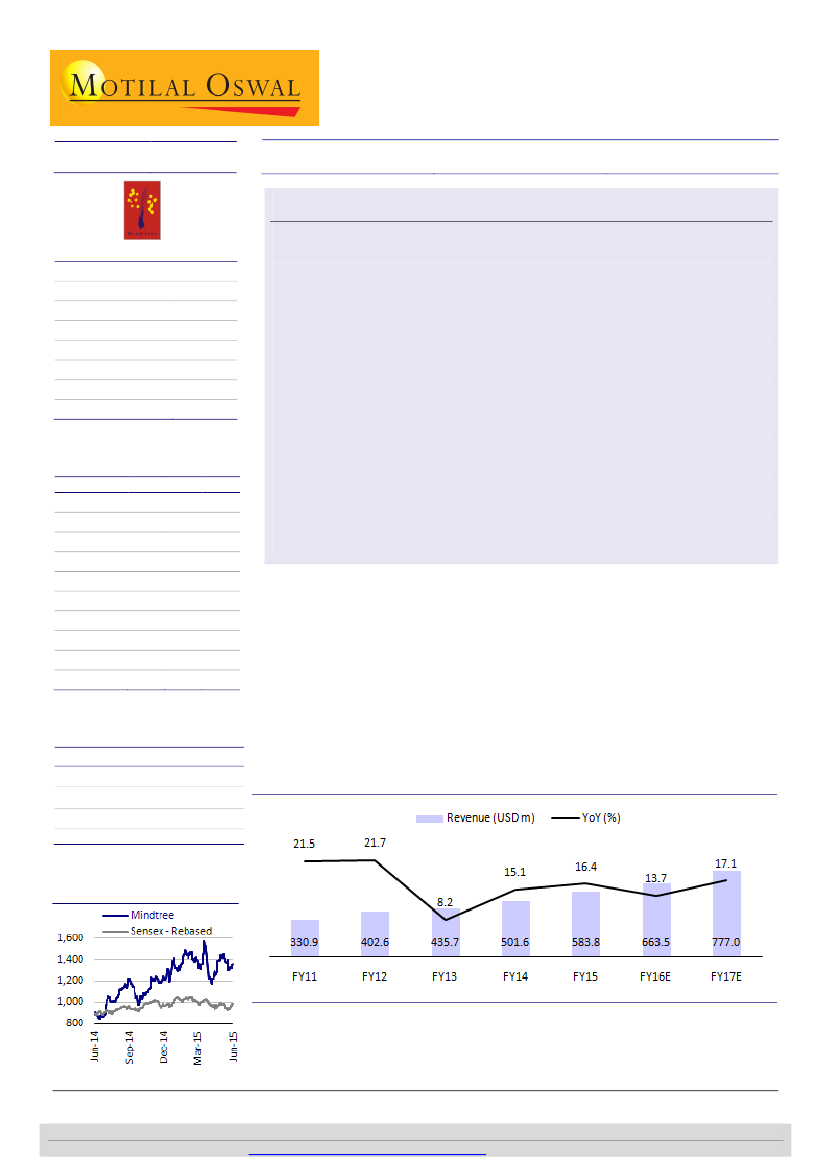
MTCL’s 16.4% USD revenue growth in FY15 was well ahead of the industry and
contributed by the company’s healthy execution of client mining, along with the
capabilities in Digital. Strategic mining approach led to 22% growth in key
accounts, above the overall company growth.
MTCL remains confident of growing above the industry with its mining-focused,
“locally local” and Digital-based approach. The approach to client relationships
is changing too—from delivery excellence-led to business expertise-led.
Exhibit 1: Healthy execution has helped drive growth leadership
Notes:
FII incl. depository receipts
Stock Performance (1-year)
Source: Company, MOSL
Ashish Chopra
(Ashish.Chopra@MotilalOswal.com); +91 22 3982 5424
Investors are advised to refer through disclosures made at the end of the Research Report.
Motilal Oswal research is available on
www.motilaloswal.com/Institutional-Equities,
Bloomberg, Thomson Reuters, Factset and S&P Capital.

MindTree Consulting
Six pillars of MTCL’s growth strategy
Execution of growth above the industry average will be focused around six pillars:
1.
Digital transformation:
MTCL cited the advantage of the fact that it was born
Digital, and has worked with global leaders in their omni-channel and other
Digital references. This positions it well to capture the growth opportunity in the
segment.
2.
Expertise selling:
MTCL is looking to change the way it sells. Customer
engagements will change with more consulting and domain centricity
3.
Acquisitions
will be led by strategy, not size. Potential targets will be companies
where MTCL lacks capabilities or gets access to marquee customers.
4.
Value-driven delivery:
MTCL is striving to embed the lean and agile
methodologies of delivering business. The focus is on differentiating the way in
which traditional services are delivered. Automation and AI are the future
course, but they will never comprise 100% of the solution. Technology
advancements will need to be coupled with and re-imagined in the context of
process excellence.
5.
Differentiated culture:
Changing market requires very different thinking on how
people can be changed in terms of capabilities/competencies. The industry is
currently not paying adequate importance to this; this could be the big
differentiator for MTCL in the next 3-5 years.
6.
Increased global footprint:
MTCL will invest in more client-facing people. There
is enough headroom to grow across regions; but to achieve the same through a
“locally local” approach, MTCL will need to expand its global footprint.
Exhibit 2: Digital, Automation, IoT are the drivers of next leg of IT Services growth
Increasing
thrust on
understanding
customer’s
core business
Smaller deals,
faster time-to-
market, fail-
first approach
Unabated
momentum in
Digital, SaaS,
Cloud
Multi-segment
specialists
across the
globe
5 trends
shaping the IT
Services
industry
The next growth
opportunities -
Automation,
Artificial
Intelligence and
Internet of things
Source: Company, MOSL
23 June 2015
2

MindTree Consulting
Digital—Quashing notions around Pricing | Sizes | Margins
By 2020, size of the Digital Services market could grow up to USD220b. Various
estimates suggest that of the total spend on IT Services, anywhere between 50%
and 80% could go toward Digital.
That said, a large part of the work currently is around experimentation and
proof of concept—where there is a natural reluctance by customers to spend
high dollars, so premium pricing in Digital is an outcome of such experiments
converting into dedicated programs.
Once converted into dedicated programs, size of Digital engagements can
become significantly large.
Even in the early stages during proof of concept, the company does not see the
business diluting its operating margins.
Exhibit 3: Expect Digital to drive growth in the foreseeable future
Source: Company, MOSL
Digital @ MTCL is a combination of four themes
1.
2.
3.
4.
Creating digital customer experiences:
MTCL cited instances of driving Digital
marketing programs for customers over the years. Given the omni-channel
imperative in almost every industry, the seamless transactions/interactions
across multiple platforms should offer convenience, at speed and with a richer
experience.
Digitizing the value chain:
Connecting with back-end systems to bring forth the
delivery/fulfillment convenience is an equally important element of the overall
Digital proposition. Such back-end readiness is imperative for offerings like 1-
hour delivery and mobile re-insurance.
Developing sense & respond system:
The data deluge on new platforms enables
greater predictive insights besides hindsight analytics. Real-time recognition and
determining the course of action is, therefore, a key endeavor at MTCL.
Shaping innovative business models:
Born-in-the-cloud startups are disrupting
status quo in multiple industries. This compels existing leaders to transform
business models using technology to compete with this set.
23 June 2015
3

MindTree Consulting
Exhibit 4: MTCL's key predictions for technology services over the next 3-5 years
Source: Company, MOSL
Traditional may still continue to dominate revenues
Despite all the thrust on Digital, traditional, which is still ~67% of revenues, will
continue to contribute majority of the revenues. Classifying the work in existing
and new areas as 2
nd
and 3
rd
platforms, MTCL cited that today 70% of the ICT
spending is on 2
nd
platform and 24% on the third; this ratio is expected to change
to 60:40 by 2020. MTCL’s approach in the traditional segments is to have
differentiated offerings, like automation driven by its mWatch IMS platform.
Valuation and view
MTCL has been a focused mid-tier company with play on select verticals (BFSI,
Retail, Travel, Hi-Tech) and services (Digital, IMS, ADM). Its pragmatic strategy
has been backed by strong execution, which has helped the company grow
above industry in its IT Services business (two-thirds of the company’s
revenue)—at a CAGR of 25% over FY10-14.
However, almost all the revenue in the Hi-tech vertical, which is ~33% of the
business, comes from Product Engineering services (a volatile segment). The
segment was flat in FY12, declined by 4% in FY13 and returned to marginal
growth in FY14 (5.3% YoY). FY15 has seen significant improvement over the past
performance, with the first three quarters showing consecutive sequential
growth. However, the segment (which still forms a significant proportion of the
business) remains volatile and currently lacks visibility of structural continued
growth.
With momentum in the Hi-tech vertical and continued traction in Digital/SMAC
in the near term, expect the growth at MTCL to beat the industry average in the
near-to-medium term despite sluggishness in two out of its top-10 accounts.
This will partly be led by the company’s acquisition of Discoverture. ~33%
revenue exposure to Digital augurs well for the MTCL’s growth, and the
company continues to actively invest in building capabilities and leadership in
this area.
At ~20% EBITDA margin, MTCL has more levers to expand the same compared
with peers, with current SGA run-rate of ~22% well above other companies.
Even utilization including trainees at ~70% is below peers, and could see further
23 June 2015
4

MindTree Consulting
uptick. While the SGA may not come down immediately, risk to margins is the
least among tier-II IT.
At 18.6x FY16E and 14.7x FY17E EPS, the stock trades well above the average
across its listed history (seven years). We expect the company to grow its USD
revenues at a CAGR of 15.4% over FY15-17E and EPS at a CAGR of 19.8% during
the period. We believe that premium to historical average of 11x is justified
considering: [1] The turnaround following the acquisition of Kyocera and
product foray, [2] strong execution in IT Services driving confidence of above-
industry growth, and also the strong book-to-bill in the last three quarters [3]
capabilities in Digital, and [4] maximum cushion to profitability.
Our target price of INR1,300 discounts FY17E EPS by 14x—implying no upside to
CMP. Maintain
Neutral.
MTCL and PSYS are our preferred business models in
tier-II IT from a long-term perspective.
Exhibit 6: One year forward PB
Avg(x)
Min(x)
27.3
17.0
PB (x)
5.5
4.5
3.5
2.5
1.5
4.0
0.5
1.1
2.5
5.1
4.3
Peak(x)
Avg(x)
Min(x)
Exhibit 5: One year forward PE
30
25
20
15
10
5
0
11.8
PE (x)
Peak(x)
Source: Company, MOSL
23 June 2015
5

MindTree Consulting
Financials and valuations
Income Statement
Y/E March
Sales
Change (%)
Cost of Services
SG&A Expenses
EBITDA
% of Net Sales
Depreciation
Interest
Other Income
Forex
PBT
Tax
Rate (%)
PAT
Change (%)
FY10
12,960
4.7
7,982
2,512
2,466
19.0
652
27
96
673
2,557
398
15.6
2,159
387.8
FY11
15,091
16.4
10,145
3,164
1,781
11.8
712
4
86
155
1,307
222
17.0
1,085
-49.7
FY12
19,152
26.9
12,261
3,961
2,930
15.3
695
5
188
197
2,615
430
16.4
2,185
101.4
FY13
23,618
23.3
14,274
4,484
4,860
20.6
624
10
350
-340
4,236
847
20.0
3,389
55.1
FY14
30,316
28.4
17,820
6,394
6,102
20.1
809
4
376
120
5,785
1,275
22.0
4,510
34.1
FY15
35,619
17.5
20,741
7,786
7,092
19.9
1,018
1
656
179
6,908
1,545
22.4
5,363
18.5
(INR Million)
FY16E
41,800
17.4
23,949
9,405
8,446
20.2
1,276
-
731
21
7,922
1,818
23.0
6,104
13.7
FY17E
49,731
19.0
28,509
10,526
10,696
21.5
1,481
-
826
-
10,042
2,342
23.3
7,700
26.3
Balance Sheet
Y/E March
Share Capital
Reserves
Net Worth
Loan
Capital Employed
Gross Block
Less : Depreciation
Net Block
CWIP
Other LT Assets
Investments
Curr. Assets
Current Investments
Debtors
Cash & Bank Balance
Loans & Advances
Other Current Assets
Current Liab. & Prov
Net Current Assets
Deferred Tax
Application of Funds
E: MOSL Estimates
FY10
395
6,311
6,706
31
6,737
5,133
2,521
2,612
247
154
1,442
4,671
0
2,370
403
1,898
0
2,603
2,068
214
6,737
FY11
400
7,362
7,762
371
8,133
5,624
2,673
2,951
1
582
7
6,403
1,105
2,825
459
350
1,664
2,027
4,376
216
8,133
FY12
405
9,167
9,572
71
9,643
5,820
3,272
2,548
85
844
7
9,541
3,075
4,078
602
219
1,567
3,703
5,838
321
9,643
FY13
415
12,722
13,137
89
13,226
6,457
3,896
2,561
571
1,691
230
11,497
4,027
4,508
1,252
430
1,280
3,684
7,813
360
13,226
FY14
417
15,988
16,405
195
16,600
6,886
3,621
3,265
496
1,967
175
14,688
5,160
6,004
1,184
613
1,727
4,393
10,295
402
16,600
FY15
837
19,287
20,124
357
20,485
8,879
4,366
4,513
354
2,699
8
18,526
5,343
6,963
3,763
836
1,621
6,064
12,462
449
20,485
(INR Million)
FY16E
837
23,367
24,204
357
24,561
11,899
5,642
6,257
354
2,699
8
20,824
5,343
8,731
4,301
827
1,621
6,030
14,794
449
24,561
FY17E
837
28,638
29,475
357
29,832
14,609
7,123
7,486
354
2,699
8
25,996
5,343
10,377
7,673
983
1,621
7,161
18,836
449
29,832
23 June 2015
6

MindTree Consulting
Financials and valuations
Ratios
Y/E March
Basic (INR)
EPS
Cash EPS
Book Value
DPS
Payout %
Valuation (x)
P/E
Cash P/E
EV/EBITDA
EV/Sales
Price/Book Value
Dividend Yield (%)
Profitability Ratios (%)
RoE
RoCE
Turnover Ratios
Debtors (Days)
Fixed Asset Turnover (x)
FY10
52.8
69.1
164.8
3.0
5.7
FY11
12.4
21.9
94.7
2.5
20.2
FY12
26.9
35.1
116.7
4.0
14.9
50.3
38.5
36.1
5.5
11.6
0.3
35.3
25.6
67
5.0
15.0
14.3
68
5.1
25.2
25.1
78
7.5
29.8
37.0
70
9.2
FY13
40.9
48.0
157.3
6.0
14.7
FY14
53.9
63.5
195.7
12.5
23.2
25.1
21.3
17.4
3.5
6.9
0.9
30.5
35.5
72
9.3
FY15
63.9
76.0
239.5
17.0
26.6
21.2
17.8
14.7
2.9
5.6
1.3
29.4
32.8
71
7.9
FY16E
72.7
87.8
288.1
20.0
27.5
18.6
15.4
12.2
2.5
4.7
1.5
27.5
31.8
76
6.7
FY17E
91.7
109.3
350.9
24.0
26.2
14.7
12.4
9.4
2.0
3.9
1.8
28.7
33.9
76
6.6
Cash Flow Statement
Y/E March
CF from Operations
Cash for Working Capital
Net Operating CF
Net Purchase of FA
Free Cash Flow
Net Purchase of Invest.
Net Cash from Invest.
Proc. from equity issues
Proceeds from LTB/STB
Dividend Payments
Cash Flow from Fin.
Exchang diff on transln of forex cash & eq
Net Cash Flow
Opening Cash Bal.
Add: Net Cash
Closing Cash Bal.
E: MOSL Estimates
FY10
1,629
673
2,302
-745
1,557
-259
-1,004
94
-1,390
-46
-1,342
-8
-52
488
(52)
403
FY11
1,277
-844
433
-836
-403
453
-383
139
13
-150
2
4
56
403
56
459
FY12
2,551
-523
2,028
-410
1,618
-1,917
-2,327
120
398
-176
342
100
143
459
143
602
FY13
3,267
-603
2,664
-1,057
1,607
-862
-1,919
322
-233
-214
-125
30
650
602
650
1,252
FY14
4,985
-1,766
3,219
-1,517
1,702
-726
-2,243
63
-252
-924
-1,113
70
-67
1,252
-67
1,184
FY15
5,546
489
6,035
-1,851
4,184
823
-1,028
420
-4
-1,712
-1,296
-197
3,514
1,184
3,514
3,763
(INR Million)
FY16E
6,628
-1,794
4,834
-3,020
1,814
731
-2,289
0
0
-2,024
-2,024
0
521
3,763
521
4,301
FY17E
8,354
-670
7,684
-2,710
4,974
826
-1,884
0
0
-2,428
-2,428
0
3,372
4,301
3,372
7,673
23 June 2015
7

Disclosures
This document has been prepared by Motilal Oswal Securities Limited (hereinafter referred to as Most) to provide information about the company(ies) and/sector(s), if any, covered in the report and may be distributed
MindTree Consulting
by it and/or its affiliated company(ies). This report is for personal information of the selected recipient/s and does not construe to be any investment, legal or taxation advice to you. This research report does not
constitute an offer, invitation or inducement to invest in securities or other investments and Motilal Oswal Securities Limited (hereinafter referred as MOSt) is not soliciting any action based upon it. This report is not for
public distribution and has been furnished to you solely for your general information and should not be reproduced or redistributed to any other person in any form. This report does not constitute a personal
recommendation or take into account the particular investment objectives, financial situations, or needs of individual clients. Before acting on any advice or recommendation in this material, investors should consider
whether it is suitable for their particular circumstances and, if necessary, seek professional advice. The price and value of the investments referred to in this material and the income from them may go down as well as
up, and investors may realize losses on any investments. Past performance is not a guide for future performance, future returns are not guaranteed and a loss of original capital may occur.
MOSt and its affiliates are a full-service, integrated investment banking, investment management, brokerage and financing group. We and our affiliates have investment banking and other business relationships with a
some companies covered by our Research Department. Our research professionals may provide input into our investment banking and other business selection processes. Investors should assume that MOSt and/or
its affiliates are seeking or will seek investment banking or other business from the company or companies that are the subject of this material and that the research professionals who were involved in preparing this
material may educate investors on investments in such business. The research professionals responsible for the preparation of this document may interact with trading desk personnel, sales personnel and other
parties for the purpose of gathering, applying and interpreting information. Our research professionals are paid on the profitability of MOSt which may include earnings from investment banking and other business.
MOSt generally prohibits its analysts, persons reporting to analysts, and members of their households from maintaining a financial interest in the securities or derivatives of any companies that the analysts cover.
Additionally, MOSt generally prohibits its analysts and persons reporting to analysts from serving as an officer, director, or advisory board member of any companies that the analysts cover. Our salespeople, traders,
and other professionals or affiliates may provide oral or written market commentary or trading strategies to our clients that reflect opinions that are contrary to the opinions expressed herein, and our proprietary
trading and investing businesses may make investment decisions that are inconsistent with the recommendations expressed herein. In reviewing these materials, you should be aware that any or all of the foregoing
among other things, may give rise to real or potential conflicts of interest. MOSt and its affiliated company(ies), their directors and employees and their relatives may; (a) from time to time, have a long or short position
in, act as principal in, and buy or sell the securities or derivatives thereof of companies mentioned herein. (b) be engaged in any other transaction involving such securities and earn brokerage or other compensation
or act as a market maker in the financial instruments of the company(ies) discussed herein or act as an advisor or lender/borrower to such company(ies) or may have any other potential conflict of interests with
respect to any recommendation and other related information and opinions.; however the same shall have no bearing whatsoever on the specific recommendations made by the analyst(s), as the recommendations
made by the analyst(s) are completely independent of the views of the affiliates of MOSt even though there might exist an inherent conflict of interest in some of the stocks mentioned in the research report
Reports based on technical and derivative analysis center on studying charts company's price movement, outstanding positions and trading volume, as opposed to focusing on a company's fundamentals and, as
such, may not match with a report on a company's fundamental analysis. In addition MOST has different business segments / Divisions with independent research separated by Chinese walls catering to different set
of customers having various objectives, risk profiles, investment horizon, etc, and therefore may at times have different contrary views on stocks sectors and markets.
Unauthorized disclosure, use, dissemination or copying (either whole or partial) of this information, is prohibited. The person accessing this information specifically agrees to exempt MOSt or any of its affiliates or
employees from, any and all responsibility/liability arising from such misuse and agrees not to hold MOSt or any of its affiliates or employees responsible for any such misuse and further agrees to hold MOSt or any of
its affiliates or employees free and harmless from all losses, costs, damages, expenses that may be suffered by the person accessing this information due to any errors and delays. The information contained herein is
based on publicly available data or other sources believed to be reliable. Any statements contained in this report attributed to a third party represent MOSt’s interpretation of the data, information and/or opinions
provided by that third party either publicly or through a subscription service, and such use and interpretation have not been reviewed by the third party. This Report is not intended to be a complete statement or
summary of the securities, markets or developments referred to in the document. While we would endeavor to update the information herein on reasonable basis, MOSt and/or its affiliates are under no obligation to
update the information. Also there may be regulatory, compliance, or other reasons that may prevent MOSt and/or its affiliates from doing so. MOSt or any of its affiliates or employees shall not be in any way
responsible and liable for any loss or damage that may arise to any person from any inadvertent error in the information contained in this report. MOSt or any of its affiliates or employees do not provide, at any time,
any express or implied warranty of any kind, regarding any matter pertaining to this report, including without limitation the implied warranties of merchantability, fitness for a particular purpose, and non-infringement.
The recipients of this report should rely on their own investigations.
This report is intended for distribution to institutional investors. Recipients who are not institutional investors should seek advice of their independent financial advisor prior to taking any investment decision based on
this report or for any necessary explanation of its contents.
Most and it’s associates may have managed or co-managed public offering of securities, may have received compensation for investment banking or merchant banking or brokerage services, may have received any
compensation for products or services other than investment banking or merchant banking or brokerage services from the subject company in the past 12 months.
Most and it’s associates have not received any compensation or other benefits from the subject company or third party in connection with the research report.
Subject Company may have been a client of Most or its associates during twelve months preceding the date of distribution of the research report
MOSt and/or its affiliates and/or employees may have interests/positions, financial or otherwise of over 1 % at the end of the month immediately preceding the date of publication of the research in the securities
mentioned in this report. To enhance transparency, MOSt has incorporated a Disclosure of Interest Statement in this document. This should, however, not be treated as endorsement of the views expressed in the
report.
Motilal Oswal Securities Limited is registered as a Research Analyst under SEBI (Research Analyst) Regulations, 2014. SEBI Reg. No. INH000000412
There are no material disciplinary action that been taken by any regulatory authority impacting equity research analysis activities
Analyst Certification
The views expressed in this research report accurately reflect the personal views of the analyst(s) about the subject securities or issues, and no part of the compensation of the research analyst(s) was, is, or will be
directly or indirectly related to the specific recommendations and views expressed by research analyst(s) in this report. The research analysts, strategists, or research associates principally responsible for preparation
of MOSt research receive compensation based upon various factors, including quality of research, investor client feedback, stock picking, competitive factors and firm revenues
Disclosure of Interest Statement
Analyst ownership of the stock
Served as an officer, director or employee
MINDTREE
No
No
A graph of daily closing prices of securities is available at www.nseindia.com and http://economictimes.indiatimes.com/markets/stocks/stock-quotes
Regional Disclosures (outside India)
For U.S.
This report is not directed or intended for distribution to or use by any person or entity resident in a state, country or any jurisdiction, where such distribution, publication, availability or use would be contrary to law,
regulation or which would subject MOSt & its group companies to registration or licensing requirements within such jurisdictions.
Motilal Oswal Securities Limited (MOSL) is not a registered broker - dealer under the U.S. Securities Exchange Act of 1934, as amended (the"1934 act") and under applicable state laws in the United States. In
addition MOSL is not a registered investment adviser under the U.S. Investment Advisers Act of 1940, as amended (the "Advisers Act" and together with the 1934 Act, the "Acts), and under applicable state laws in the
United States. Accordingly, in the absence of specific exemption under the Acts, any brokerage and investment services provided by MOSL, including the products and services described herein are not available to or
intended for U.S. persons.
This report is intended for distribution only to "Major Institutional Investors" as defined by Rule 15a-6(b)(4) of the Exchange Act and interpretations thereof by SEC (henceforth referred to as "major institutional
investors"). This document must not be acted on or relied on by persons who are not major institutional investors. Any investment or investment activity to which this document relates is only available to major
institutional investors and will be engaged in only with major institutional investors. In reliance on the exemption from registration provided by Rule 15a-6 of the U.S. Securities Exchange Act of 1934, as amended (the
"Exchange Act") and interpretations thereof by the U.S. Securities and Exchange Commission ("SEC") in order to conduct business with Institutional Investors based in the U.S., MOSL has entered into a chaperoning
agreement with a U.S. registered broker-dealer, Motilal Oswal Securities International Private Limited. ("MOSIPL"). Any business interaction pursuant to this report will have to be executed within the provisions of this
chaperoning agreement.
The Research Analysts contributing to the report may not be registered /qualified as research analyst with FINRA. Such research analyst may not be associated persons of the U.S. registered broker-dealer, MOSIPL,
and therefore, may not be subject to NASD rule 2711 and NYSE Rule 472 restrictions on communication with a subject company, public appearances and trading securities held by a research analyst account.
Motilal Oswal Capital Markets Singapore Pte Limited is acting as an exempt financial advisor under section 23(1)(f) of the Financial Advisers Act(FAA) read with regulation 17(1)(d) of the Financial Advisors
Regulations and is a subsidiary of Motilal Oswal Securities Limited in India. This research is distributed in Singapore by Motilal Oswal Capital Markets Singapore Pte Limited and it is only directed in Singapore to
accredited investors, as defined in the Financial Advisers Regulations and the Securities and Futures Act (Chapter 289), as amended from time to time.
In respect of any matter arising from or in connection with the research you could contact the following representatives of Motilal Oswal Capital Markets Singapore Pte Limited:
Anosh Koppikar
Kadambari Balachandran
Email : anosh.Koppikar@motilaloswal.com
Email : kadambari.balachandran@motilaloswal.com
Contact : (+65)68189232
Contact : (+65) 68189233 / 65249115
Office Address : 21 (Suite 31),16 Collyer Quay,Singapore 04931
For Singapore
Motilal Oswal Securities Ltd
23 June 2015
Motilal Oswal Tower, Level 9, Sayani Road, Prabhadevi, Mumbai 400 025
Phone: +91 22 3982 5500 E-mail: reports@motilaloswal.com
8