08 July 2015
1QFY16 Results Update | Sector:
Technology
TCS
BSE SENSEX
27,574
Bloomberg
Equity Shares (m)
S&P CNX
8,329
TCS IN
1,958.7
CMP: INR2,521
TP: INR2,550 (+1%)
Neutral
CC revenue growth below estimate; USD2b Digital revenue run rate
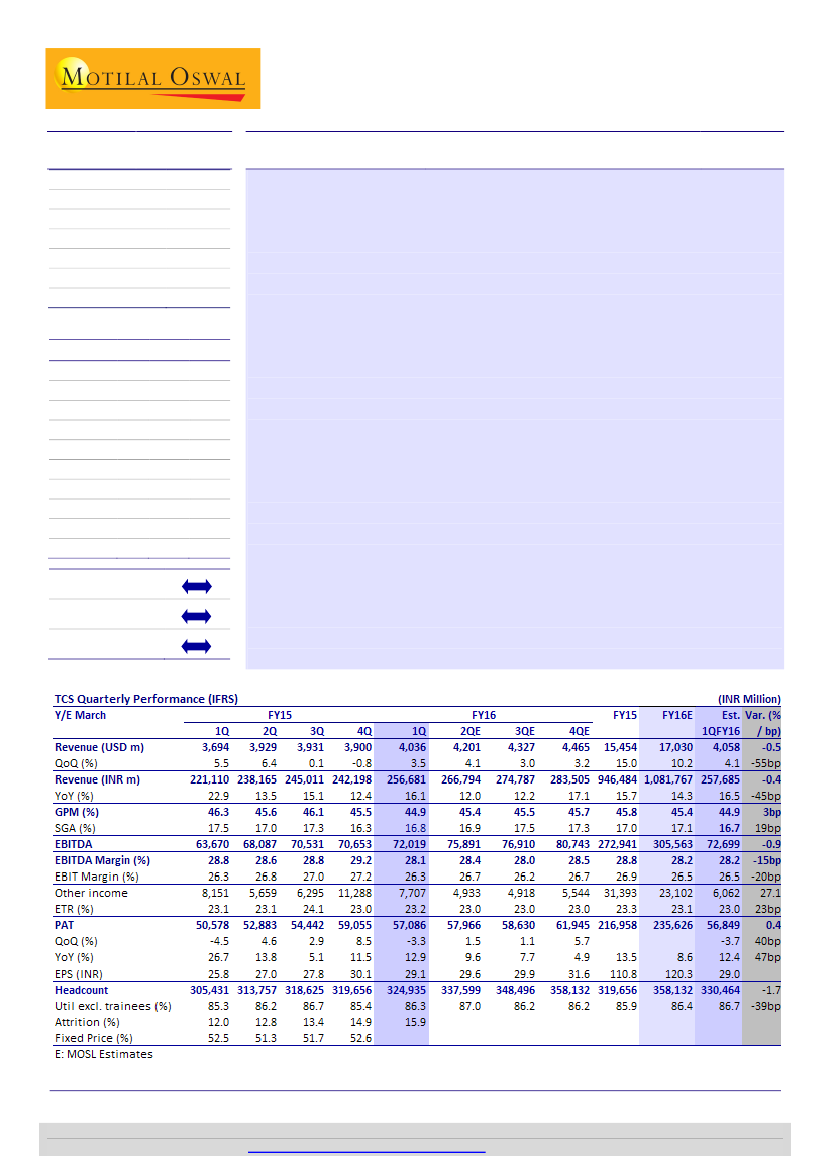
Lowest 1Q CC growth in six years:
TCS’ 3.5% QoQ growth (lower than our
estimate of 4.4%) in Constant Currency was the key highlight for the quarter; this
is the lowest growth in seasonally strong 1Q in the last six years. Volume growth
of 4.8% was sanguine and in line, but greater uptick in hardware & equipment
segment would have contributed partly toward the same.
In-line operating profitability and PAT:
EBIT margin for the quarter is 26.2%,
down 90bp QoQ and in line with our estimate of 26.5%. PAT was INR57.1b, -3.3%
QoQ and in line with our estimate of INR56.8b.
USD2b run rate in Digital:
For the first time, TCS shared its scale in Digital (at
12.5% of revenues) and cited that the segment is growing well above the
company average. Revenue share implies annualized run rate of USD2b from the
Digital segment; this compares with estimated Digital scale at ACN’s ~USD6b and
CTSH’s USD600m+, though definitions may vary across companies.
Cutting earnings by 2%:
We have cut our USD revenue estimate for FY16 by 1pp,
and our assumed CQGR of 3.4% over 2Q-4QFY16 implies FY16 USD revenue
growth of 10.2% (v/s 11.4% earlier). Consequently, our earnings estimates for
FY16/17 are lower by 2%.
Outperformance delta waning; maintain Neutral:
Despite traction in Digital,
softness/volatility in select segments and the base in large verticals limit the
likelihood of bettering 3.3-3.4% ask rates to meet our FY16/17 revenue estimates.
We expect USD revenue CAGR of 12.2% over FY15-17E and earnings CAGR of
12.5% during this period. Our Price Target of INR2525 discounts FY17E EPS by 18x.
Maintain Neutral.
M.Cap (INR b)/(USD b) 4,938/78.3
52-Week Range (INR) 2,834/2,300
1, 6, 12 Rel. Per (%)
-6/1/-3
Avg Val/Vol ‘000
Free float (%)
Financials & Valuation (INR b)
Y/E March
Sales
EBITDA
PAT
EPS (INR)
EPS Gr. (%)
BV/Sh.INR)
RoE (%)
P/E (x)
2015 2016E 2017E
946 1,082 1,246
273
217
13.5
38.5
23.0
306
236
8.6
38.0
21.2
15.5
1.7
353
274
16.5
36.7
18.2
13.2
1.9
3,083/1,207
26.1
110.8 120.3 140.1
293.4 340.3 422.4
EV/EBITDA(x) 17.6
Div.Yld (%)
3.1
Estimate change
TP change
Rating change
Ashish Chopra
(Ashish.Chopra@MotilalOswal.com); +91 22 3982 5424
Investors are advised to refer through disclosures made at the end of the Research Report.
Motilal Oswal research is available on
www.motilaloswal.com/Institutional-Equities,
Bloomberg, Thomson Reuters, Factset and S&P Capital.

TCS
Lowest 1Q CC growth in six years
TCS’ 1QFY16 constant currency (CC) revenue growth was 3.5% QoQ to
USD4036m, below our estimate of 4.4% QoQ CC growth. This is the lowest 1Q
CC revenue growth in six years. Even reported revenues during the quarter were
USD4036m, with no impact from cross currency movements (compared to our
estimate of 30bp negative impact).
Further, Services growth during the quarter was lower at 3.2%, compared to our
estimate of 4.1% QoQ.
Revenue growth was led by volume growth of 4.8% QoQ, while CC realization
declined 1.3%. While the volume growth was sanguine and in line, greater
uptick in hardware & equipment segment would also have some contribution
towards the same
Exhibit 1:
CC USD revenue growth of 3.5% QoQ was below our estimate
USD Revenues
4.1%
5.4%
3.0%
5.5%
1.9%
QoQ Growth (%)
6.4%
3.5%
0.1%
-0.8%
3,165
3,337
3,438
3,503
3,694
3,929
3,931
3,900
4,036
Source: Company, MOSL
Exhibit 2:
Breakup of revenue growth
4QFY15: USD revenue growth impacts
Volume
Realization change
Cross currency movements
QoQ revenue growth (%)
Percentage
4.8
-1.3
0.0
3.5
Source: Company, MOSL
Revenue miss was contributed by smaller segments – Latin America (-5.1%
QoQ CC), Japan and Diligenta, while bigger pieces like BFSI (+3.3% QoQ CC),
North America (+4.4% QoQ CC), Retail (+5.1% QoQ CC), and even Telecom
(+9.6% QoQ CC) grew in-line-to-above-company average.
While the weakness in Diligenta was in line with company’s expectations,
performance in Japan and Latin America was a negative surprise even for
TCS. On the other hand, Telecom surprised positively, but continues to
remain volatile, rather than any structural pickup.
For the first time, TCS shared its scale in Digital, at 12.5% of revenues, and
cited that the segment is growing well above company average. Revenue
share implies annualized run rate of USD2b from Digital segment. This
compares with estimated Digital scale at ACN of ~USD6b and CTSH’s
USD600m+, though definitions may continue to vary across companies.
9 July 2015
2

TCS
Exhibit 3:
Among larger verticals, only Manufacturing was weak
Verticals
BFSI
Mfg
Telecom
LS & Healthcare
Retail & Distr
Transportation
Energy and Utilities
Media & Entmnt
Hi-Tech
Others
Contr. to
overall rev (%)
40.6
9.9
8.6
6.9
13.8
3.5
4.0
2.5
5.8
4.4
QoQ
Gr. (%)
3.3
0.3
9.6
7.0
5.1
6.1
5.5
-6.7
2.3
-4.2
4 Quarter
CQGR
1.6
5.9
0.0
4.6
2.2
1.5
2.9
0.3
3.6
1.7
Source: Company, MOSL
Exhibit 4:
Latin America and Japan were the sluggish regions in 1QFY16
Geographies
North America
Latin America
UK
Continental Europe
India
APAC
MEA
Contr. to
overall rev (%)
52.8
1.9
16.1
11.0
6.4
9.6
2.2
QoQ
Gr. (%)
4.4
-5.1
2.8
2.2
2.6
2.6
8.1
4 Quarter
CQGR
2.5
-1.4
-0.2
0.0
2.6
8.4
4.7
Source: Company, MOSL
Exhibit 5:
Weakness more pronounced in Consulting and Enterprise solutions, like last
quarter
Services
ADM
Engg Services
IMS
EAS
Consulting
Products
Testing
BPO
Contr. to
overall rev (%)
40.3
4.5
14.7
15.1
2.9
2.5
8.5
11.5
QoQ
Gr. (%)
4.1
2.7
5.1
1.3
(7.7)
17.7
3.8
2.4
4 Quarter
CQGR
1.9
2.2
6.3
0.9
(0.2)
2.2
1.9
1.4
Source: Company, MOSL
Margins in line, PAT beat on higher forex gain
EBIT margin for the quarter is 26.2%, down 90bp QoQ, in line with our estimate
of 26.5%. Sequential movement in EBIT margin was dictated by following
factors:
Wage hikes: -190bp
Currency: +70bp
Operational efficiency: +30bp
9 July 2015
3

TCS
Exhibit 6:
Impact from wage hikes was partially offset by INR depreciation
SGA (% of Revenues)
30.2
27.0
29.7
29.1
26.3
EBIT Margin (%)
26.8
27.0
27.2
26.3
18.6
17.3
17.9
17.1
17.5
17.0
17.3
16.3
16.8
Source: Company, MOSL
Exhibit 7:
Utilization inched up again after taking a breather in 4QFY15
Util Excl. Trainees (%)
82.7
83.4
84.3
83.8
85.3
Util Incl. Trainees (%)
86.2
86.7
85.4
86.3
72.5
75.0
77.5
77.9
79.8
81.3
82.1
81.5
82.9
Source: Company, MOSL
PAT was INR57.1b, -3.3% QoQ, in line with our estimate of INR56.8b. Total other
income during the quarter was INR7.7b, well below INR11.3b in the previous
quarter, mainly on account of lower forex gains (INR1.97b v/s INT663b in
4QFY15).
Takeaways from Management commentary
Seasonality a factor in high attrition:
Attrition continued to inch up at TCS, now
15.9% on LTM basis. TCS cited that 3 quarters of high attrition were
compounded by seasonality of 1Q, and it should start to taper from 2Q.
Deals won across geographies:
TCS announced 9 large deal wins during the
quarter, won across geographies, including 5 in the US. Vertical-wise, it won 3
deals each in BFSI and Retail, and 1 each in Telecom, Manufacturing and Media.
Situation in Europe not impacting client spending:
TCS’ business in BFSI as well
as Europe remains pretty much status quo, and the recent uncertainty around
Greece is not impacting business. Also, the company’s exposure to the country
is negligible.
No incremental Visa issues:
TCS cited that visa investigations are an ongoing
process and there is nothing new to read into the media raised concerns around
one specific deal.
Digital spanning industries:
While consumer facing industries like Retail,
Consumer goods, Retail Banking and Insurance were the early adopters of
Digital, it is now becoming pervasive in B2B businesses too, with themes like IoT.
9 July 2015
4

TCS
Change in estimates
We have cut our USD revenue estimate for FY16 by 1pp, and our assumed CQGR of
3.4% over 2Q-4QFY16 implies FY16 USD revenue growth of 10.2% (v/s 11.4%
earlier). Consequently, our earnings estimates for FY16/17 are lower by 2%.
Exhibit 8:
Change in estimates
Revised
FY16E
FY17E
63.5
64.0
17,030
19,464
10.2
14.3
INR/USD
USD Revenue - m
USD revenue growth (%)
EBIT Margin (%)
EPS - INR
Earlier
FY16E
FY17E
63.0
64.0
17,212
19,761
11.4
14.8
26.5
120.3
26.8
140.1
27.1
123.2
27.0
143.4
Change
FY16E
FY17E
0.8%
0.0%
-1.1%
-1.5%
-118bp
-51bp
-59bp
-19bp
-2.3%
-2.3%
Source: Company, MOSL
Valuation and view
Over the past five years, TCS has led the incremental revenues as well as
operating profits not just domestically, but also in the global arena (compared to
peers multiple times its size); and its market cap is second only to IBM.
During the period of outperformance, TCS’ traction has been impressively
broad-based, unlike select pockets of stress across its peer group. However,
over the past couple of quarters, some factors that have led relative softness in
performance v/s the company’s expectations have had secular elements,
considering citations of similar trends by peers as well (Telecom, Insurance,
Energy). We see the growth outperformance to industry peers gradually coming
off, as was the case in FY15.
Despite traction in Digital, softness / volatility in select segments and the base in
large verticals limit the likelihood of bettering 3.3-3.4% ask rates to meet our
FY16/17 revenue estimates.
We expect USD revenue CAGR of 12.2% over FY15-17E and earnings CAGR of
12.5% during this period. Our Price Target of INR2525 discounts FY17E EPS by
18x. Higher multiple will be a function of sustained high growth delta to peers,
but there are little indicators of the same for the near-to-medium term.
Maintain
Neutral.
Key triggers
Turnaround in weak areas – Diligenta | Telecom | Energy.
Uptick in Japan revenues.
Digital-led resurgence in growth leadership
Key risk factors
Faster convergence of growth to peers.
Rapid appreciation in INR.
Pricing intensity in troubled European region.
9 July 2015
5

TCS
Exhibit 9:
TCS 1 year forward PE chart
30
24
18
12
6
7.0
18.2
PE (x)
Peak(x)
Avg(x)
25.8
19.9
Min(x)
11.5
9.5
7.5
5.5
3.5
1.5
2.3
6.5
6.6
Exhibit 10:
TCS 1-year forward PB chart
PB (x)
Peak(x)
Avg(x)
Min(x)
10.5
Exhibit 11:
Comparative Valuation
Company Mkt cap Rating
(USD b)
TCS
77.8 Neutral
Infosys
33.8 Buy
Wipro
21.1 Neutral
HCL Tech 20.4 Buy
TechM
7.1 Neutral
Cognizant 36.1 Not Rated
Tier-I Agg 196.2
TP Upside
EPS (INR)
(INR)
(%) FY15E FY16E
2,525 0.1 110.8 120.3
1,200 28.0 53.9
56.6
600
10.2 35.1
38.3
1,050 14.6 50.9
56.6
550
15.9 29.6
32.3
2.3
2.7
FY17E
140.1
65.9
42.5
64.0
40.6
3.5
P/E (x)
RoE (%)
FY15E FY16E FY17E FY15E FY16E
22.8
21.0
18.0
38.5
38.0
17.4
16.6
14.2
26.0
23.7
15.5
14.2
12.8
23.0
21.6
18.0
16.2
14.3
32.4
29.6
16.0
14.7
11.7
24.5
21.6
25.1
21.8
16.7
20.7
19.4
19.1
17.4
14.6
27.5
25.6
FY17E
36.7
24.3
21.0
27.6
23.1
20.6
25.5
Source: Company, MOSL
FY14-17E CAGR (%)
USD rev.
EPS
12.2
12.5
10.0
10.6
8.1
10.1
13.1
12.1
14.4
17.1
18.1
22.6
9 July 2015
6

TCS
Story in charts
Exhibit 12:
TCS continues to lead industry growth..
TCS
Infosys
Wipro (IT Services)
HCL Tech
Exhibit 13:
… India business remains a focus but volatile
India (INR)
International (USD)
FY11
FY12
FY13
FY14
FY15
1QFY15
2QFY15
3QFY15
4QFY15
1QFY16
Source: Company, MOSL
Exhibit 14:
Revenue growth finally getting delinked to
headcount..
150
140
130
120
110
100
Headcount
USD revenues
Exhibit 15:
..as competitive intensity gradually pulls down
pricing
Picing indexed at 100
102
100
98
96
94
Source: Company, MOSL
Exhibit 16:
Operating at peak efficiency, reflected in
utilization…
Util Excl. Trainees (%)
86.7
85.3 86.2
83.8
81.3
82.1
85.4
86.3
Exhibit 17:
..Margins have settled lower after currency-led
uptick, expect o sustain the band in near-to-medium term
SGA (% of Revenues)
30.2 29.7 29.1
26.3
EBIT Margin (%)
26.8
27.0
27.2
26.3
82.7
83.4
84.3
27.0
82.9
18.6
72.5
75.0
77.5
77.9
79.8
81.5
17.3
17.9
17.1
17.5
17.0
17.3
16.3
16.8
Source: Company, MOSL
9 July 2015
7

TCS
Exhibit 18:
Operating Metrics
2QFY13 3QFY13 4QFY13 1QFY14 2QFY14 3QFY14 4QFY14 1QFY15 2QFY15 3QFY15 4QFY15 1QFY16
Service Lines (%)
ADM
Engineering and Industrial Services
Infrastructure Services
Enterprise Solutions
Global Consulting
Asset Leverage Solutions
Assurance Services
BPO
Industry Verticals (%)
BFSI
Manufacturing
Telecom
Life Sciences & Healthcare
Retail & Distribution
Transportation
Energy and Utilities
Media & Entertainment
Hi-Tech
Others
Geographies (%)
America
UK
Rest of Europe
Europe
India
APAC
Latin America
MEA
Others
Revenue Mix (%)
Offshore
Onsite
GDC
Utilization
Excluding Trainees
Including Trainees
Total Employees
Trainee Additions
Lateral Additions
Overseas Additions
Gross Additions
Net Additions
Attrition (LTM %)
43.1
4.6
11.4
14.9
3.0
2.7
7.7
12.6
42.4
4.7
11.7
15.1
3.2
2.8
7.7
12.4
42.4
4.6
12.1
15.5
3.1
2.5
7.8
12.0
42.3
4.7
11.9
15.1
3.5
2.5
8.1
11.9
41.7
4.7
11.8
15.4
3.3
2.7
8.5
11.9
41.4
4.6
12.0
15.7
3.4
2.3
8.5
12.1
41.0
4.8
12.0
15.7
3.4
2.6
8.4
12.1
40.8
4.5
12.6
15.9
3.2
2.5
8.6
11.9
40.5
4.6
13.8
15.6
3.2
2.3
8.4
11.6
39.5
4.5
14.3
15.4
3.7
2.4
8.5
11.7
40.1
4.5
14.5
15.4
3.2
2.3
8.4
11.6
40.3
4.5
14.7
15.1
2.9
2.5
8.5
11.5
42.8
8.2
10.3
5.2
13.4
3.6
3.6
2.2
5.9
4.8
43.0
8.5
9.5
5.2
13.4
3.6
3.8
2.1
5.8
5.1
43.5
8.5
9.3
5.1
13.4
3.4
3.8
2.1
5.7
5.2
43.0
8.4
9.6
5.5
14.0
3.4
3.7
2.1
5.5
4.8
43.1
8.4
9.3
5.7
13.9
3.4
3.8
2.2
5.4
4.8
42.7
8.8
9.6
5.9
13.8
3.5
3.8
2.3
5.3
4.3
42.9
8.6
9.3
6.1
13.5
3.5
3.8
2.6
5.3
4.4
41.7
8.6
9.4
6.3
13.8
3.6
3.9
2.7
5.5
4.5
40.4
10.1
8.9
6.3
13.5
3.5
4.3
2.7
5.7
4.6
40.5
10.1
8.9
6.4
13.4
3.5
4.2
2.7
5.9
4.4
40.6
10.2
8.1
6.7
13.6
3.4
3.9
2.7
6.0
4.8
40.6
9.9
8.6
6.9
13.8
3.5
4.0
2.5
5.8
4.4
52.8
17.1
9.5
26.6
7.5
7.6
3.4
2.1
20.6
52.6
17.5
9.1
26.6
7.6
7.5
3.6
2.1
20.8
53.2
16.8
9.4
26.2
8.8
7.3
2.4
2.1
20.6
54.1
17.0
9.9
26.9
7.6
6.9
2.4
2.1
19.0
53.2
17.3
11.2
28.5
6.9
7.1
2.3
2.0
18.3
52.7
17.5
11.6
29.1
6.3
7.4
2.3
2.2
18.2
52.2
17.8
12.1
29.9
6.2
7.4
2.2
2.1
17.9
52.2
17.7
12.0
29.7
6.3
7.6
2.2
2.0
18.1
51.0
17.1
11.5
28.6
6.5
10.1
1.9
1.9
20.4
51.9
16.1
11.7
27.8
6.5
9.7
2.1
2.0
20.3
52.4
15.9
11.1
27.0
6.6
9.8
2.1
2.1
20.6
52.8
16.1
11.0
27.1
6.4
9.6
1.9
2.2
20.1
49.1
45.8
5.1
49.4
45.6
5.0
48.3
46.5
5.2
48.5
46.3
5.2
48.1
46.5
5.4
47.8
46.8
5.4
47.4
47.0
5.6
47.2
47.1
5.7
45.7
48.9
5.4
46.0
48.2
5.8
46.0
48.5
5.5
46.0
48.5
5.5
81.6
72.8
81.7
72.1
82.0
72.2
82.7
72.5
83.4
75.0
84.3
77.5
83.8
77.9
85.3
79.8
86.2
81.3
86.7
82.1
85.4
81.5
86.3
82.9
254,076 263,637 276,196 277,586 285,250 290,713 300,464 305,431 313,757 318,625 319,656 324,935
10,205 9,831 11,420
751 6,296 6,342 7,572 3,452 7,583 5,529 5,569 6,425
5,764 5,072 5,630 6,605 6,423 5,490 7,401 8,488 8,924 6,129 5,853 9,337
2,685 2,242 3,048 3,255 4,643 2,831 3,591 3,877 3,843 4,903 2,973 4,540
18,654 17,145 20,098 10,611 17,362 14,663 18,564 15,817 20,350 16,561 14,395 20,302
10,531 9,561 12,559 1,390 7,664 5,463 9,751 4,967 8,326 4,868 1,031 5,279
15.9
11.4
11.2
10.6
10.5
10.9
10.9
10.4
12.0
12.8
13.4
14.9
Source: MOSL, Company
9 July 2015
8

TCS
Exhibit 19:
Operating Metrics
2QFY13 3QFY13 4QFY13 1QFY14 2QFY14 3QFY14 4QFY14 1QFY15 2QFY15 3QFY15 4QFY15 1QFY16
QoQ growth (%)
Service Lines
3.8
1.7
3.1
3.9
3.9
2.3
0.9
4.9
5.6
-2.4
0.7
4.0
ADM
3.5
4.6
5.6
0.9
6.4
5.4
0.8
6.3
-1.1
8.7
-2.1
-0.8
Engineering and Industrial Services
4.9
12.5
6.1
6.7
2.4
4.6
4.8
1.9
10.7
16.5
3.7
0.6
Infrastructure Services
1.5
2.5
4.7
5.9
1.4
7.5
5.0
1.9
6.8
4.3
-1.2
-0.8
Enterprise Solutions
-6.2
12.0
10.2
-0.1
17.5
-0.6
6.1
1.9
-0.7
6.4
15.7
-14.2
Global Consulting
12.5
0.8
7.2
-7.9
4.1
13.9
-12.2
15.2
1.4
-2.2
4.4
-4.9
Asset Leverage Solutions
4.7
5.9
3.3
4.5
8.1
10.7
3.0
0.7
8.0
3.9
1.2
-2.0
Assurance Services
2.6
1.3
1.7
-0.2
3.2
5.4
4.8
1.9
3.7
3.7
0.9
-1.6
BPO
Industry Verticals
BFSI
Manufacturing
Telecom
Life Sciences & Healthcare
Retail & Distribution
Transportation
Energy and Utilities
Media & Entertainment
Hi-Tech
Others
Geographies
America
UK
Rest of Europe
Europe
India
APAC
Latin America
MEA
Others
Overall International business
Domestic Business
4.1
8.5
4.6
2.6
6.2
1.7
4.6
4.6
2.8
4.6
3.8
7.1
-4.7
3.3
3.3
3.3
9.1
-1.4
1.6
9.8
4.3
3.1
1.0
1.1
3.1
-2.6
3.1
3.1
1.3
5.1
2.9
2.9
7.5
12.3
8.8
4.1
1.4
4.1
0.4
-3.9
5.7
5.4
2.1
9.3
4.7
5.4
8.3
10.5
3.5
5.4
2.1
7.9
6.4
6.6
2.3
6.1
3.0
7.7
1.1
-7.7
2.4
-0.4
-1.3
5.3
-0.3
1.9
1.9
15.2
1.9
4.3
2.5
5.5
6.6
8.9
7.8
8.5
8.2
9.5
9.4
7.9
3.0
24.9
0.7
6.4
4.0
3.4
17.3
6.4
10.2
8.7
0.3
0.1
0.1
1.6
-0.7
0.1
-2.3
0.1
3.6
-4.3
-0.5
0.2
-9.7
3.9
0.7
-3.6
-7.9
-0.8
0.9
8.2
3.5
0.5
9.9
6.6
5.0
6.5
6.2
-4.2
0.0
-5.1
3.2
5.2
3.5
4.6
10.5
7.4
7.7
4.6
8.2
4.1
10.5
2.9
5.8
-1.0
3.3
4.7
2.0
9.4
3.3
4.3
3.2
4.6
4.3
-1.0
6.5
1.6
19.4
0.4
-31.2
3.1
2.1
1.8
19.6
5.9
5.3
9.6
6.9
-10.1
-1.6
4.1
4.1
-4.0
5.5
-10.1
3.7
7.3
19.3
11.7
-4.3
8.5
1.1
0.4
1.6
6.3
-4.4
2.1
4.2
6.7
5.2
-5.9
7.4
3.0
13.3
2.5
3.7
-5.8
0.9
3.6
6.3
4.7
0.3
1.9
-2.5
-2.7
0.2
2.0
0.4
5.5
4.9
4.6
4.8
7.2
8.3
5.5
0.4
6.6
5.4
6.9
3.9
2.7
1.9
2.4
9.7
41.3
-8.1
1.0
19.9
6.1
9.9
1.8
-5.8
1.8
-2.7
0.1
-3.9
10.6
5.3
-0.4
0.2
-2.0
-5.9
-3.6
0.7
0.2
-0.8
4.2
0.7
4.3
4.8
2.6
3.9
0.4
1.4
-6.4
8.4
1.0
3.7
0.1
-0.9
0.6
0.0
0.4
Source: Company, MOSL
9 July 2015
9

TCS
Corporate profile
Company description
TCS is the largest IT services company in India, with (LTM)
revenue of over USD~15b. It employs over 318,000 people
and provides IT and BPO services to over 1,000 global
clients. It is one of the preferred IT vendors for most
Fortune 500/Global 1,000 companies.
Exhibit 21: Sensex rebased
Exhibit 21:
Shareholding pattern (%)
Mar-15
Promoter
DII
FII
Others
73.9
4.7
17.0
4.5
Dec-14
73.9
4.7
16.8
4.6
Mar-14
73.9
5.4
16.1
4.6
Exhibit 22:
Top holders
Holder Name
LIC of India
Franklin Templeton Investment Funds
% Holding
2.3
1.1
Note: FII Includes depository receipts
Exhibit 23:
Top management
Name
Cyrus Mistry
N Chandrasekaran
Rajesh Gopinathan
Ajoyendra Mukherjee
Designation
Chairman
MD & CEO
CFO
Head, Global HR
Exhibit 24:
Director
Name
Cyrus Mistry
N Chandrasekaran
O P Bhatt*
Ron Sommer*
Aman Mehta*
Name
Vijay Kelkar*
Ishaat Hussain
Phiroz A Vandrevala
Clayton M Christensen*
Venkatraman Thyagarajan*
*Independent
Exhibit 25:
Auditors
Name
Deloitte Haskins & Sells LLP
Statutory
Type
Exhibit 26:
MOSL forecast v/s consensus
EPS (INR)
FY16
FY17
MOSL forecast
120.3
140.1
Consensus
forecast
121.7
139.5
Variation (%)
-1.2
0.4
9 July 2015
10

TCS
Financials and valuations
Key Assumptions
Y/E March
INR/USD Rate
Revenues (USD m)
Offshore Revenue (%)
Total Headcount
Net Addition
Per Capita Productivity
Utilization excl. trainees (%)
Utilization incl. trainees (%)
2010
47.4
6,339
51.0
160,429
16,668
41,678
80.5
68.1
2011
45.6
8,187
51.0
198,614
38,185
45,603
83.2
69.4
2012
48.1
10,171
50.6
238,583
39,969
46,528
82.2
68.7
2013
54.4
11,568
49.3
276,196
37,613
44,945
81.7
68.3
2014
60.9
13,443
47.9
300,464
24,268
46,623
83.6
75.4
2015
61.2
15,454
46.2
319,656
19,192
49,843
85.9
82.0
2016E
63.5
17,030
45.9
358,132
38,476
50,251
86.4
80.6
2017E
64.0
19,464
45.6
400,519
42,386
51,312
86.6
80.9
Income statement
Y/E March
Sales
Change (%)
Cost of Services
SG&A Expenses
EBITDA
% of Net Sales
Depreciation
Other Income
PBT
Tax
Rate (%)
Minority Interest
PAT
Change (%)
2010
300,289
8.0
157,243
56,246
86,800
28.9
7,209
2,255
81,846
12,088
14.8
1,019
68,729
32.9
2011
373,245
24.3
198,505
62,848
111,892
30.0
7,990
5,247
109,149
21,203
19.4
1,116
86,827
26.3
2012
488,938
31.0
258,773
85,988
144,177
29.5
9,036
4,041
139,182
31,688
22.8
1,110
106,384
22.5
2013
629,895
28.8
332,545
116,480
180,870
28.7
10,792
11,174
181,252
40,344
22.3
1,494
139,413
31.0
2014
818,094
29.9
422,065
144,707
251,322
30.7
13,243
15,891
253,969
60,712
23.9
2,089
191,168
37.1
2015
946,484
15.7
512,565
160,978
272,941
28.8
18,698
31,393
285,636
66,564
23.3
2,114
216,958
13.5
2016E
1,081,767
14.3
590,853
185,352
305,563
28.2
19,119
23,102
309,546
71,369
23.1
2,551
235,626
8.6
(INR Million)
2017E
1,245,685
15.2
678,798
214,027
352,859
28.3
18,686
23,305
357,479
80,433
22.5
2,551
274,495
16.5
Balance Sheet
Y/E March
Share Capital
Reserves
Net Worth
Preference shares
Minority Interest
Loans
Capital Employed
Gross Block
Less : Depreciation
Net Block
Other LT Assets
Investments
Curr. Assets
Debtors
Cash & Bank Balance
Other Current Assets
Current Liab. & Prov
Current Liabilities
Net Current Assets
Application of Funds
E: MOSL Estimates
2010
1,957
207,427
209,384
1,000
4,056
9,110
223,549
67,532
25,826
41,706
54,920
37,799
140,120
70,109
10,249
59,762
50,996
50,996
89,124
223,549
2011
1,957
250,432
252,389
1,000
4,663
10,718
268,771
86,156
33,816
52,340
89,929
18,390
171,948
95,479
47,401
29,068
63,837
63,837
108,111
268,771
2012
1,957
323,276
325,233
1,000
5,276
12,306
343,815
107,400
42,852
64,548
110,269
0
237,173
137,469
34,617
65,087
68,175
68,175
168,998
343,815
2013
1,957
407,524
409,481
1,000
6,561
10,894
427,936
135,587
53,644
81,944
88,815
33,765
315,022
172,366
79,035
63,621
91,609
91,609
223,413
427,936
2014
1,959
551,393
553,352
0
6,905
12,561
572,817
170,530
66,887
103,644
118,105
37,673
429,703
222,360
156,495
50,848
116,308
116,308
313,395
572,817
2015
1,959
572,808
574,767
0
9,136
19,004
602,907
201,300
85,585
115,716
137,276
7,283
489,263
231,541
197,713
60,010
146,630
146,630
342,633
602,907
2016E
1,959
664,638
666,596
0
9,730
16,985
693,311
242,853
104,703
138,150
142,518
7,558
603,888
287,886
260,077
55,924
198,803
198,803
405,084
693,311
(INR Million)
2017E
1,959
825,445
827,404
0
9,730
19,365
856,499
275,043
123,389
151,654
164,445
7,558
756,907
330,625
362,055
64,227
224,066
224,066
532,841
856,499
9 July 2015
11

TCS
Financials and valuations
Ratios
Y/E March
Basic (INR)
EPS
Cash EPS
Book Value
DPS
Payout %
Valuation (x)
P/E
Cash P/E
EV/EBITDA
EV/Sales
Price/Book Value
Dividend Yield (%)
Profitability Ratios (%)
RoE
RoCE
Turnover Ratios
Debtors (Days)
Fixed Asset Turnover (x)
2010
35.1
38.8
107.5
20.0
57.0
2011
44.4
48.4
129.5
14.0
31.6
57.5
52.7
44.1
13.2
19.7
0.5
37.4
41.0
88
7.6
37.4
42.2
81
7.9
2012
54.4
59.0
166.7
25.0
46.0
46.9
43.3
34.5
10.2
15.3
1.0
36.7
44.1
87
8.4
2013
71.2
76.7
209.7
22.0
30.9
35.8
33.2
27.0
7.8
12.2
0.9
37.8
44.1
90
8.6
2014
97.6
104.4
282.5
32.0
32.8
26.1
24.4
19.2
5.9
9.0
1.3
39.7
47.6
88
8.8
2015
110.8
120.3
293.4
79.0
71.3
23.0
21.2
17.6
5.1
8.7
3.1
38.5
43.2
90
8.6
2016E
120.3
130.1
340.3
42.5
35.3
21.2
19.6
15.5
4.4
7.5
1.7
38.0
44.2
90
8.5
2017E
140.1
149.7
422.4
48.0
34.3
18.2
17.0
13.2
3.7
6.0
1.9
36.7
43.1
91
8.6
Cash Flow Statement
Y/E March
CF from Operations
Cash for Working Capital
Net Operating CF
Net Purchase of FA
Net Purchase of Invest.
Net Cash from Invest.
Proc. from equity issues
Proceeds from LTB/STB
Dividend Payments
Cash Flow from Fin.
Free Cash Flow
Net Cash Flow
Opening Cash Bal.
Add: Net Cash
Closing Cash Bal.
E: MOSL Estimates
2010
75,856
-13,407
62,448
-3,987
58,461
-20,461
-24,448
0
4,605
-45,797
-41,192
-3,191
13,440
-3,191
10,249
2011
94,817
7,009
101,826
-53,633
48,193
19,409
-34,224
0
1,608
-32,058
-30,449
37,152
10,249
37,152
47,401
2012
115,419
-49,352
66,066
-41,584
24,483
18,390
-23,193
0
1,588
-57,246
-55,658
-12,785
47,401
-12,785
34,616
2013
150,205
-13,501
136,704
-6,733
129,971
-33,765
-40,498
0
-1,412
-50,377
-51,788
44,418
34,616
44,418
79,034
2014
204,411
12,834
217,246
-64,233
153,012
-3,909
-68,142
0
1,666
-73,310
-71,643
77,461
79,034
77,461
156,494
2015
215,179
25,257
240,437
-49,941
190,496
30,391
-19,550
0
6,444
-186,113
-179,670
41,217
156,494
41,217
197,712
2016E
254,745
-87
254,658
-46,795
207,863
-276
-47,071
-42,542
-2,020
-100,661
-145,223
62,365
197,712
62,365
260,076
(INR Million)
2017E
293,181
-25,779
267,402
-54,117
213,285
0
-54,117
0
2,381
-113,688
-111,307
101,978
260,076
101,978
362,054
9 July 2015
12

TCS
NOTES
9 July 2015
13

This document has been prepared by Motilal Oswal Securities Limited (hereinafter referred to as Most) to provide information about the company(ies) and/sector(s), if any, covered in the report and may be
distributed by it and/or its affiliated company(ies). This report is for personal information of the selected recipient/s and does not construe to be any investment, legal or taxation advice to you. This research report does
TCS
not constitute an offer, invitation or inducement to invest in securities or other investments and Motilal Oswal Securities Limited (hereinafter referred as MOSt) is not soliciting any action based upon it. This report is not
for public distribution and has been furnished to you solely for your general information and should not be reproduced or redistributed to any other person in any form. This report does not constitute a personal
recommendation or take into account the particular investment objectives, financial situations, or needs of individual clients. Before acting on any advice or recommendation in this material, investors should consider
whether it is suitable for their particular circumstances and, if necessary, seek professional advice. The price and value of the investments referred to in this material and the income from them may go down as well as
up, and investors may realize losses on any investments. Past performance is not a guide for future performance, future returns are not guaranteed and a loss of original capital may occur.
MOSt and its affiliates are a full-service, integrated investment banking, investment management, brokerage and financing group. We and our affiliates have investment banking and other business relationships with a
some companies covered by our Research Department. Our research professionals may provide input into our investment banking and other business selection processes. Investors should assume that MOSt and/or
its affiliates are seeking or will seek investment banking or other business from the company or companies that are the subject of this material and that the research professionals who were involved in preparing this
material may educate investors on investments in such business. The research professionals responsible for the preparation of this document may interact with trading desk personnel, sales personnel and other
parties for the purpose of gathering, applying and interpreting information. Our research professionals are paid on the profitability of MOSt which may include earnings from investment banking and other business.
MOSt generally prohibits its analysts, persons reporting to analysts, and members of their households from maintaining a financial interest in the securities or derivatives of any companies that the analysts cover.
Additionally, MOSt generally prohibits its analysts and persons reporting to analysts from serving as an officer, director, or advisory board member of any companies that the analysts cover. Our salespeople, traders,
and other professionals or affiliates may provide oral or written market commentary or trading strategies to our clients that reflect opinions that are contrary to the opinions expressed herein, and our proprietary
trading and investing businesses may make investment decisions that are inconsistent with the recommendations expressed herein. In reviewing these materials, you should be aware that any or all of the foregoing
among other things, may give rise to real or potential conflicts of interest. MOSt and its affiliated company(ies), their directors and employees and their relatives may; (a) from time to time, have a long or short position
in, act as principal in, and buy or sell the securities or derivatives thereof of companies mentioned herein. (b) be engaged in any other transaction involving such securities and earn brokerage or other compensation
or act as a market maker in the financial instruments of the company(ies) discussed herein or act as an advisor or lender/borrower to such company(ies) or may have any other potential conflict of interests with
respect to any recommendation and other related information and opinions.; however the same shall have no bearing whatsoever on the specific recommendations made by the analyst(s), as the recommendations
made by the analyst(s) are completely independent of the views of the affiliates of MOSt even though there might exist an inherent conflict of interest in some of the stocks mentioned in the research report
Reports based on technical and derivative analysis center on studying charts company's price movement, outstanding positions and trading volume, as opposed to focusing on a company's fundamentals and, as
such, may not match with a report on a company's fundamental analysis. In addition MOST has different business segments / Divisions with independent research separated by Chinese walls catering to different set
of customers having various objectives, risk profiles, investment horizon, etc, and therefore may at times have different contrary views on stocks sectors and markets.
Unauthorized disclosure, use, dissemination or copying (either whole or partial) of this information, is prohibited. The person accessing this information specifically agrees to exempt MOSt or any of its affiliates or
employees from, any and all responsibility/liability arising from such misuse and agrees not to hold MOSt or any of its affiliates or employees responsible for any such misuse and further agrees to hold MOSt or any of
its affiliates or employees free and harmless from all losses, costs, damages, expenses that may be suffered by the person accessing this information due to any errors and delays. The information contained herein is
based on publicly available data or other sources believed to be reliable. Any statements contained in this report attributed to a third party represent MOSt’s interpretation of the data, information and/or opinions
provided by that third party either publicly or through a subscription service, and such use and interpretation have not been reviewed by the third party. This Report is not intended to be a complete statement or
summary of the securities, markets or developments referred to in the document. While we would endeavor to update the information herein on reasonable basis, MOSt and/or its affiliates are under no obligation to
update the information. Also there may be regulatory, compliance, or other reasons that may prevent MOSt and/or its affiliates from doing so. MOSt or any of its affiliates or employees shall not be in any way
responsible and liable for any loss or damage that may arise to any person from any inadvertent error in the information contained in this report. MOSt or any of its affiliates or employees do not provide, at any time,
any express or implied warranty of any kind, regarding any matter pertaining to this report, including without limitation the implied warranties of merchantability, fitness for a particular purpose, and non-infringement.
The recipients of this report should rely on their own investigations.
This report is intended for distribution to institutional investors. Recipients who are not institutional investors should seek advice of their independent financial advisor prior to taking any investment decision based on
this report or for any necessary explanation of its contents.
Most and it’s associates may have managed or co-managed public offering of securities, may have received compensation for investment banking or merchant banking or brokerage services, may have received any
compensation for products or services other than investment banking or merchant banking or brokerage services from the subject company in the past 12 months.
Most and it’s associates have not received any compensation or other benefits from the subject company or third party in connection with the research report.
Subject Company may have been a client of Most or its associates during twelve months preceding the date of distribution of the research report
MOSt and/or its affiliates and/or employees may have interests/positions, financial or otherwise of over 1 % at the end of the month immediately preceding the date of publication of the research in the securities
mentioned in this report. To enhance transparency, MOSt has incorporated a Disclosure of Interest Statement in this document. This should, however, not be treated as endorsement of the views expressed in the
report.
Motilal Oswal Securities Limited is under the process of seeking registration under SEBI (Research Analyst) Regulations, 2014.
There are no material disciplinary action that been taken by any regulatory authority impacting equity research analysis activities
Analyst Certification
The views expressed in this research report accurately reflect the personal views of the analyst(s) about the subject securities or issues, and no part of the compensation of the research analyst(s) was, is, or will be
directly or indirectly related to the specific recommendations and views expressed by research analyst(s) in this report. The research analysts, strategists, or research associates principally responsible for preparation
of MOSt research receive compensation based upon various factors, including quality of research, investor client feedback, stock picking, competitive factors and firm revenues
Disclosure of Interest Statement
Analyst ownership of the stock
Served as an officer, director or employee
TATA CONSULTANCY SVCS
No
No
Disclosures
Regional Disclosures (outside India)
For U.S.
This report is not directed or intended for distribution to or use by any person or entity resident in a state, country or any jurisdiction, where such distribution, publication, availability or use would be contrary to law,
regulation or which would subject MOSt & its group companies to registration or licensing requirements within such jurisdictions.
Motilal Oswal Securities Limited (MOSL) is not a registered broker - dealer under the U.S. Securities Exchange Act of 1934, as amended (the"1934 act") and under applicable state laws in the United States. In
addition MOSL is not a registered investment adviser under the U.S. Investment Advisers Act of 1940, as amended (the "Advisers Act" and together with the 1934 Act, the "Acts), and under applicable state laws in the
United States. Accordingly, in the absence of specific exemption under the Acts, any brokerage and investment services provided by MOSL, including the products and services described herein are not available to or
intended for U.S. persons.
This report is intended for distribution only to "Major Institutional Investors" as defined by Rule 15a-6(b)(4) of the Exchange Act and interpretations thereof by SEC (henceforth referred to as "major institutional
investors"). This document must not be acted on or relied on by persons who are not major institutional investors. Any investment or investment activity to which this document relates is only available to major
institutional investors and will be engaged in only with major institutional investors. In reliance on the exemption from registration provided by Rule 15a-6 of the U.S. Securities Exchange Act of 1934, as amended (the
"Exchange Act") and interpretations thereof by the U.S. Securities and Exchange Commission ("SEC") in order to conduct business with Institutional Investors based in the U.S., MOSL has entered into a chaperoning
agreement with a U.S. registered broker-dealer, Motilal Oswal Securities International Private Limited. ("MOSIPL"). Any business interaction pursuant to this report will have to be executed within the provisions of this
chaperoning agreement.
The Research Analysts contributing to the report may not be registered /qualified as research analyst with FINRA. Such research analyst may not be associated persons of the U.S. registered broker-dealer, MOSIPL,
and therefore, may not be subject to NASD rule 2711 and NYSE Rule 472 restrictions on communication with a subject company, public appearances and trading securities held by a research analyst account.
For Singapore
Motilal Oswal Capital Markets Singapore Pte Limited is acting as an exempt financial advisor under section 23(1)(f) of the Financial Advisers Act(FAA) read with regulation 17(1)(d) of the Financial Advisors
Regulations and is a subsidiary of Motilal Oswal Securities Limited in India. This research is distributed in Singapore by Motilal Oswal Capital Markets Singapore Pte Limited and it is only directed in Singapore to
accredited investors, as defined in the Financial Advisers Regulations and the Securities and Futures Act (Chapter 289), as amended from time to time.
In respect of any matter arising from or in connection with the research you could contact the following representatives of Motilal Oswal Capital Markets Singapore Pte Limited:
Kadambari Balachandran
Email : kadambari.balachandran@motilaloswal.com
Contact : (+65) 68189233 / 65249115
Office Address : 21 (Suite 31),16 Collyer Quay,Singapore 04931
Motilal Oswal Securities Ltd
9 July 2015
Motilal Oswal Tower, Level 9, Sayani Road, Prabhadevi, Mumbai 400 025
Phone: +91 22 3982 5500 E-mail: reports@motilaloswal.com
14