13 July 2015
1QFY16 Results Update | Sector:
Financials
IndusInd Bank
BSE SENSEX
27,961
Bloomberg
Equity Shares (m)
M.Cap.(INR b)/(USD b)
52-Week Range (INR)
1, 6, 12 Rel. Per (%)
Avg Val/Vol ‘000
Free float (%)
S&P CNX
8,460
IIB IN
580.7
538.3/8.5
967 / 528
9/14/61
769/993
85.0
CMP: INR924
TP: INR1,140 (+23%)
Buy
Financials & Valuation (INR b)
Y/E Mar
2016E 2017E 2018E
NII
OP
NP
NIM (%)
EPS (INR)
EPS Gr. (%)
BV/Sh. (INR)
ABV/Sh.(INR)
RoE (%)
RoA (%)
Payout (%)
Valuations
P/E (X)
P/BV (X)
P/ABV (X)
Div. Yield (%)
44.1
41.6
24.3
4.0
41.8
23.5
287.1
285.4
18.0
2.0
14.0
22.2
3.2
3.2
0.5
54.8 69.8
51.9 66.3
30.2 38.7
4.1
4.2
52.1 66.6
24.5 27.8
331.9 389.2
329.1 385.3
16.8 18.5
2.1
2.2
14.0 14.0
17.8
2.8
2.8
0.7
13.9
2.4
2.4
0.9
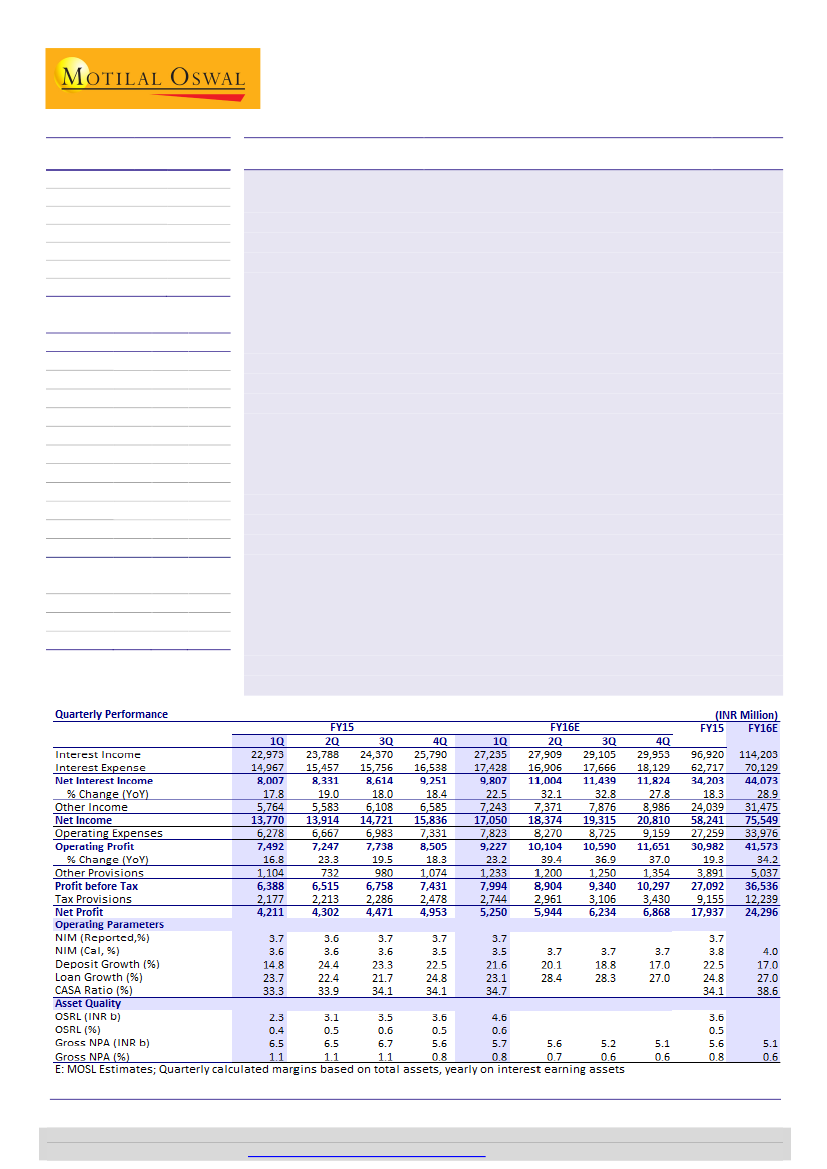
Results in line: Strong core operating performance; fueled to fly; best-in-class RoA
IIB’s 1QFY16 PAT was in line with our estimates (+25% YoY) at INR 5.2b, driven by
strong operating performance (23% YoY) and stable credit costs (52bp).
Consumer finance division (CFD) grew by 6% QoQ (18% YoY) and accounted for
46% of incremental credit growth v/s 28% in 4QFY15; this was partly helped by
recovery in CV loans (~25% of incremental growth), which returned to double
digits after seven quarters. Increasing share of CFD would lead to higher NIMs,
RoA/RoE and lower risk density (credit RWA was flat QoQ despite 5% loan growth).
SA customer acquisition remains healthy at 0.18mn/quarter despite reduction in
SA rates. Strong customer acquisition and deepening of relationships led to SA
deposits growth of 33% YoY (+8% QoQ). SA ratio improved to 18% (17.5% in 4Q).
Overall CASA ratio improved to 34.7% v/s 33.3% in 1QFY15.
Post the QIP issuance (INR43.3b), CET1 ratio has increased to 16.3%. Including the
INR7.5b equity issuance to promoters, CET1 would be >17%—the highest amongst
Indian banks. We expect 27% loan CAGR in FY15-18 and CET1 of ~14% in FY18.
Other highlights:
a) FX and IB fees continue to drive overall fee growth (accounted
for 47% of fees), b) NSL remained one of the best at 94bp (+10bp QoQ).
Maintain estimates; FY15-18E earnings CAGR of 25%+:
In planning cycle 3, IIB’s
key focus is to build scale with 3Ds strategy—Dominate (among the top three
banks in home markets), Differentiate (extensive use of technology and cross sell)
and Diversify (new product addition, payment solution, etc). Strong core
profitability (2.9% of avg. assets v/s private banks’ average of 2.5% and HDFCB’s
2.7%), improving CASA ratio (best among mid-sized private banks) and healthy
return ratios (RoA of 2%+ and RoE of 18-19%) are key positives. Delay in CV cycle
revival and sharp moderation in FX and IB fees remain the key risks to our
estimates.
Alpesh Mehta
(Alpesh.Mehta@MotilalOswal.com); +91 22 3982 5415
Vallabh Kulkarni
(Vallabh.Kulkarni@MotilalOswal.com); +91 22 3982 5430
Investors are advised to refer through disclosures made at the end of the Research Report.
Motilal Oswal research is available on
www.motilaloswal.com/Institutional-Equities,
Bloomberg, Thomson Reuters, Factset and S&P Capital.

IndusInd Bank
Exhibit 1: Quarterly Performance
Y/E March
Net Interest Income
% Change (Y-o-Y)
Other Income
Net Income
Operating Expenses
Operating Profit
% Change (Y-o-Y)
Other Provisions
Profit before Tax
Tax Provisions
Net Profit
% Change (Y-o-Y)
1QFY16E
9792
22
6725
16517
7808
8709
16
850
7859
2633
5226
24
1QFY16A V/S our Est Comments
9,807
0
In-line with expectation
22
Higher than expected treasury gains derived from shifting of investments
7,243
8
from HTM to AFS
17,050
7,823
9,227
23
1,233
7,994
2,744
5,250
25
3
0
6
45
2
4
0
Higher than expected provisions
Opex under control
Broadly in line with estimates
Source: MOSL, Company
Stable NIMs; Re-pricing benefit evident in cost of funds
Continued decline in yield
on the corporate book
Strong growth in lower yielding corporate segment (5% QoQ, 27% YoY) led to a
5bp QoQ decline in yield on loans. Yield in corporate segment declined 14bp
QoQ to 10.4%.
Strong growth in borrowings (4% QoQ and 51% YoY) in a lower interest rate
environment and deposits re-pricing (cost of deposits declined 8bp QoQ) led to
a 4bp QoQ decline in cost of funds.
As a result, NIM remained stable QoQ at 3.68%. Recovery in CV loan growth and
strong growth in unsecured segment supported yield in consumer finance
segment.
CV loans showing signs of recovery; Corporate loans drive loan growth
CFD portfolio grew 18% YoY
(+6% QoQ) vs 15% YoY in
4Q
Overall loan book growth remained strong (5% QoQ and 23% YoY) vs. banking
sector growth rate of ~9% in 1QFY16.
Incremental growth continued to be driven by corporate segment (+5% QoQ
and +27% YoY). Within this, large corporate (51% of CCB) grew 8% QoQ (+28%
YoY) and small business loans (21% of CCB) de-grew by 1% QoQ (41% YoY).
Consumer Finance Division (CFD) portfolio showed signs of recovery with
growth of 6% QoQ (18% YoY) driven by pick up in both vehicle book (4% QoQ,
18% YoY) and non vehicle book (19% of CFD; 11% QoQ and 63% YoY).
LAP (+50% YoY and +9% QoQ) and unsecured loans (+18% QoQ and +106% YoY)
were the key drivers of growth in non-vehicle book.
Management stated that they are witnessing higher momentum in CV segment;
growth in this segment is trending upwards. Share of vehicle finance in overall
portfolio remained broadly stable at 33.6%.
Going forward, we expect gradual shift of focus towards the consumer book.
Management guided with a pickup in CV book and continued traction in non-CV
book; it would take the CFD proportion to ~50% of the overall book over the
next 4-6 quarters.
13 July 2015
2

IndusInd Bank
Traction in SA continues; CASA ratio improves to 34.7%
Despite reduction in SA
deposit rates, SA growth
has remained strong
Traction in CASA deposits continued as it grew 6.5% QoQ and ~27% YoY. CASA
ratio was improved to 34.7% v/s 34.1% a quarter ago.
Continued traction in SA deposits (+8% QoQ and +33% YoY) is driven by: (a)
customer acquisition (60-65k new SA accounts per month) and (b) higher cross
sell (current cross-sell ratio of ~3.2).
Management is confident of maintaining SA momentum, despite lower rates, as
the wide product suites developed over the last few quarters and higher cross-
sell would ensure customer stickiness. Effective May 2015, the bank has revised
savings account interest rate to 4% (from 4.5% earlier; inline with large banks)
for balances of up to INR0.1m.
CA deposits increased 5% QoQ and 21% YoY. Increase in branch additions (173
branches added during last one year) and deeper penetration into India’s
hinterland is expected to keep CASA momentum strong.
Net stressed loans remain very low
Both GNPA (0.8%) and NNPA (0.31%) remained stable.
Slippages in corporate segment were INR13m (v/s INR 3.1b in 4QFY15) while
slippages in consumer finance book were INR1.2b v/s INR1.3b in 4QFY15.
ORSL increased during the quarter to 0.63% v/s 0.53% a quarter ago – impacted
by one corporate account.
Provision coverage ratio decline to 61% v/s 63% in 4QFY15.
Exhibit 2: In last two quarters, CV asset quality has started to trend lower while other segments have remained stable (%)
CV
Utility
CE
3W
2W
Cars
LAP/HL/PL
Cards
1QFY13 2QFY13 3QFY13 4QFY13 1QFY14 2QFY14 3QFY14 4QFY14 1QFY15 2QFY15 3QFY15 4QFY15 1QFY16
0.7
0.8
0.9
1.0
1.2
1.1
1.3
1.4
1.4
1.4
1.4
1.3
1.2
0.9
0.9
0.8
0.9
0.9
0.8
0.8
0.9
0.8
0.8
1.0
1.1
1.1
1.0
0.8
1.0
1.2
1.2
1.2
1.3
1.3
1.6
1.6
1.6
1.4
1.5
0.8
0.9
0.9
0.8
0.8
0.8
0.7
0.9
0.8
0.8
0.9
0.9
1.0
3.5
3.4
3.6
3.0
2.9
3.0
2.7
2.5
2.5
2.5
2.4
2.5
2.7
0.8
0.7
0.6
0.7
0.7
0.4
0.4
0.5
0.5
0.5
0.5
0.6
0.6
0.0
0.0
0.0
0.0
0.8
0.9
0.8
0.7
0.5
0.5
0.3
0.3
0.5
0.0
0.0
0.0
0.0
1.9
1.9
2.0
1.8
1.5
1.5
1.5
1.2
1.3
Source: MOSL, Company
Continued traction in fee income
Fee growth was mainly
driven by Forex and
investment banking fees
Investment Banking (+29% QoQ and +42% YoY) and Forex fees (+45% QoQ and
+18% YoY) were the key drivers of fee income growth during the quarter. FX and
IB fees accounted for 47% of overall fee income v/s 36% a quarter ago.
Trading profits were higher at INR1.3b v/s INR0.9b driven by realized profit on
shifting of securities from HTM to AFS.
13 July 2015
3

IndusInd Bank
Exhibit 3: Strong growth continues in FX and IB fees – account for 47% of overall fees
Trade related
Processing fees
Forex - Clients
Third Party Product
Investment banking
General banking
Fee income
1QFY16
562
1,044
1,595
1,070
1,229
489
5,989
4QFY15
798
1,106
1,102
1,274
955
450
5,686
1QFY15
615
861
1,349
747
867
427
4,865
QoQ (%) YoY (%)
-30
-9
-6
21
45
18
-16
43
29
42
9
15
5
23
Source: MOSL, Company
1QFY16 Conference Call highlights
FY16 Guidance
(a) Loans growth: 25% (b) Stable/Marginal improvement in NIM (c) 1200
branches by FY17 (d) Gradual CASA improvement to 40% by 2018
Balance sheet
RWA grew by 2% QoQ v/s loan growth of 5% QoQ led by a ) reduction in market
risk (7% QoQ) (Rise in share of G-sec, fall in non SLR portfolio and reduction in
MTM) b) fall in regulatory capital [capital relief on exposure to a) SE or small
business loan b) granular portfolio c) no exposure >INR50m (RWA on this 75%)]
Foreign currency assets are ~20% of corporate loans and against that bank has
foreign currency borrowings of US$800m
Added 0.18m savings account customers during the quarter. These customers
contributed INR7.8b in value terms
Disbursed loans against 6000 vehicles a month in 1Q v/s the average run rate of
4000-4500 a quarter ago. Disbursement growth stood at 33% YoY in 1Q to
INR45.6b (INR32.35b a year ago). 16% of the disbursements and outstanding
book in CV book is from old / used vehicles
Outstanding security receipts stood at INR2.1b
P&L related
Excess liquidity (led by a large IPO) during the quarter led to higher interest
income from RBI and others
Other highlights
Acquired Gems and Jewelery portfolio has INR170m GNPA and loan book of
INR45b. Portfolio has a strong collateral and is NIM, ROA accretive.
13 July 2015
4

IndusInd Bank
Valuation and view
Buy with a target price of
INR1,140 based on
Residual income model
(3.4x FY17E BV).
Strong core profitability (2.9%+ of average assets vs private banks average of
2.5% and HDFCB of 2.7%), improving CASA ratio (best amongst mid-sized private
banks), healthy return ratios (ROA of 2%+ and ROE of 18-19% and capitalization
(CET1 ratio of 16%+) are key positives. Third phase of growth cycle is likely to
focus on building scale with 3Ds strategy of Dominate (among top 3banks in
home markets), Differentiate (extensive use of technology and cross sell) and
Diversify (new product addition, payment solution etc). Management’s
execution in first two planning phases has been impeccable which increases our
comfort despite rich valuations
With the expected improvement in economic growth we expect underlying
growth in consumer finance division product to show strong revival. CV loans,
which contribute ~35% of the consumer finance division, have bottomed (+7%
QoQ v/s 7 quarters of flattish to declining growth). Further, new product
additions are also likely to drive growth. IIB is already witnessing healthy growth
in LAP, credit cards, 2W and Car loans. Corporate loan growth is likely to be
opportunistic (based on spreads available). Overall, we model in loan growth of
27% CAGR over FY15-18 and we do not envisage downside risk to our loan
growth estimates as IIB has levers (selling down less loans, less project loan
exposure) available in the balance sheet.
NIMs are likely to be flattish to improving led by higher share of retail liabilities,
expected improvement in loan mix towards high yielding CFD, benefit of falling
interest rate cycle (+40% of wholesale deposits) and higher share of fixed rate
loans (+42% CFD)
Close-to-customer business model of CV financing helped the bank maintain
strong asset quality performance, despite tough times. In our view, CV cycle has
bottomed out which would help reduce concerns over asset quality.
Overall superior margins, focused fee income strategy and control over C/I ratio
will keep earnings momentum healthy (25%+ CAGR). Capitalization remains one
of the best in the industry at 16.3% CET1 ratio. Maintain Buy with a target price
of INR 1,140 (Residual income model – 3.4x FY17E BV).
13 July 2015
5

IndusInd Bank
Exhibit 4: We largely maintain our earnings estimate
INR B
Net Interest Income
Other Income
Total Income
Operating Expenses
Operating Profits
Provisions
PBT
Tax
PAT
Margins (%)
Credit Cost (%)
RoA (%)
RoE (%)
Old Estimates
FY16 FY17 FY18
45.8 56.6
71.8
30.1 37.1
45.5
75.9 93.7 117.3
34.0 41.7
51.2
42.0 52.0
66.1
5.0
5.9
7.5
36.9 46.1
58.6
12.4 15.5
19.6
24.6 30.7
39.0
4.2
4.2
4.3
0.6
0.5
0.5
2.1
2.1
2.2
18.2
17.0
18.6
New estimates
FY16 FY17 FY18
44.1 54.8
69.8
31.5 38.8
47.6
75.5 93.6 117.4
34.0 41.7
51.2
41.6 51.9
66.3
5.0
6.4
8.1
36.5 45.5
58.1
12.2 15.2
19.5
24.3 30.2
38.7
4.0
4.1
4.2
0.6
0.6
0.6
2.0
2.1
2.2
18.0
16.8
18.5
Source: MOSL, Company
Variation (%)
FY16 FY17 FY18
-3.8
-3.2
-2.8
4.5
4.5
4.7
-0.5
-0.2
0.1
0.0
0.0
0.0
-0.9
-0.3
0.2
0.0
8.4
8.4
-1.0
-1.4
-0.9
-1.0
-1.4
-0.9
-1.0
-1.4
-0.9
Exhibit 5: One year forward P/BV
PB (x)
4.3
3.3
2.3
1.3
0.3
2.1
0.6
Peak(x)
Avg(x)
4.1
3.7
Min(x)
Exhibit 6: One year forward P/E
60
50
40
30
20
10
0
3.7
17.2
19.2
PE (x)
Peak(x)
Avg(x)
Min(x)
49.5
Source: MOSL, Company
Exhibit 7: DuPont Analysis: Improvement in core income continues to drive RoAs higher
Y/E March
Net Interest Income
Core Fee Income
Core Income
Operating Expenses
Cost to Core Income
Employee cost
Others
Core operating Profits
Non Interest income
Trading and others
Operating Profits
Provisions
NPA
Others
PBT
Tax
Tax Rate
RoA
Leverage (x)
RoE
FY08
1.36
1.17
2.53
1.82
71.87
0.55
1.27
0.71
1.35
0.18
0.89
0.37
0.28
0.10
0.52
0.18
34.33
0.34
20.39
6.93
FY09
1.80
1.33
3.13
2.15
68.66
0.74
1.41
0.98
1.79
0.47
1.45
0.55
0.49
0.06
0.89
0.31
34.79
0.58
20.04
11.69
FY10
2.81
1.37
4.19
2.34
55.81
0.92
1.41
1.85
1.76
0.38
2.24
0.54
0.42
0.13
1.69
0.58
34.28
1.11
17.52
19.49
FY11
3.40
1.55
4.95
2.49
50.28
0.94
1.55
2.46
1.76
0.21
2.67
0.50
0.40
0.10
2.17
0.75
34.38
1.43
13.52
19.27
FY12
3.30
1.77
5.07
2.60
51.31
0.94
1.66
2.47
1.96
0.19
2.66
0.35
0.28
0.07
2.31
0.76
32.70
1.55
12.37
19.23
FY13
3.41
1.89
5.31
2.68
50.58
1.01
1.67
2.62
2.08
0.19
2.81
0.40
0.34
0.07
2.41
0.79
32.68
1.62
10.96
17.78
FY14
3.61
2.01
5.61
2.73
48.56
1.01
1.72
2.89
2.36
0.35
3.24
0.58
0.39
0.19
2.65
0.90
33.84
1.76
9.98
17.53
FY15
3.49
2.13
5.62
2.78
49.50
1.00
1.78
2.84
2.45
0.32
3.16
0.40
0.35
0.05
2.76
0.93
33.79
1.83
10.38
18.98
FY16E
3.69
2.22
5.91
2.84
48.13
1.02
1.82
3.06
2.63
0.41
3.48
0.42
0.36
0.06
3.06
1.02
33.50
2.03
8.88
18.05
FY17E
FY18E
3.78
3.90
2.28
2.30
6.06
6.21
2.88
2.86
47.45
46.11
1.04
1.05
1.84
1.82
3.18
3.34
2.67
2.66
0.39
0.36
3.58
3.71
0.44
0.45
0.38
0.39
0.07
0.07
3.14
3.25
1.05
1.09
33.50
33.50
2.09
2.16
8.07
8.54
16.83
18.47
Source: MOSL, Company
6
13 July 2015

IndusInd Bank
Exhibit 8: DuPont Analysis: RoA remained healthy at ~1.9% while RoE increased to ~19.3%
NII
Fee income
Core Income
Operating costs
- Emp Costs
- Other Expenses
Cost to Core Income Ratio
Core Operating Profit
Trading and others
Operating Profit
Provisions
Tax
ROAA
Leverage (x)
ROAE
2QFY13 3QFY13 4QFY13 1QFY14 2QFY14 3QFY14 4QFY14 1QFY15 2QFY15 3QFY15 4QFY15 1QFY16
3.32
3.56
3.75
3.70
3.70
3.67
3.70
3.61
3.65
3.58
3.54
3.51
1.93
2.03
1.95
1.91
2.06
2.14
2.09
2.19
2.23
2.17
2.18
2.14
5.25
5.58
5.70
5.61
5.77
5.81
5.80
5.81
5.88
5.76
5.71
5.65
2.67
2.84
2.75
2.77
2.80
2.83
2.77
2.83
2.92
2.91
2.80
2.80
1.06
1.04
1.01
1.05
1.07
1.03
0.99
0.99
1.05
1.06
1.02
0.97
1.62
1.80
1.74
1.71
1.73
1.79
1.79
1.84
1.87
1.84
1.79
1.83
50.93
50.87
48.27
49.32
48.54
48.66
47.83
48.78
49.67
50.47
49.08
49.52
2.58
2.74
2.95
2.84
2.97
2.98
3.02
2.97
2.96
2.85
2.91
2.85
0.16
0.16
0.13
0.65
0.14
0.27
0.38
0.41
0.21
0.37
0.34
0.45
2.74
2.91
3.08
3.49
3.11
3.25
3.41
3.38
3.17
3.22
3.25
3.30
0.32
0.48
0.46
0.72
0.47
0.63
0.57
0.50
0.32
0.41
0.41
0.44
0.79
0.78
0.87
0.95
0.89
0.88
0.96
0.98
0.97
0.95
0.95
0.98
1.63
1.65
1.74
1.82
1.75
1.74
1.88
1.90
1.88
1.86
1.89
1.88
12.01
10.20
9.34
9.43
9.28
9.38
9.53
9.58
9.41
9.46
9.95
10.25
19.58
16.79
16.26
17.17
16.22
16.35
17.89
18.19
17.73
17.60
18.85
19.26
Source: MOSL, Company
13 July 2015
7

IndusInd Bank
Story in charts
Exhibit 9: NIM remained stable QoQ at 3.68% - decline in
yields was offset by improvement in cost of funds (%)
3.7 3.7
3.4
3.5
3.4
3.3 3.3 3.2 3.3
3.7 3.7
3.8
3.7 3.6 3.7 3.7 3.7
Exhibit 10: Traction in fee income continues
Fee Inc to avg. assets
2.2 2.2 2.2 2.1
2.1 2.1 2.1 2.2
1.9
1.9 2.0 2.0 1.9
1.9 1.8
1.6 1.7
5.2 5.7 6.0
4.3 4.4 4.9 5.1
3.9
3.0 3.3 3.4 3.5
1.9 2.1 2.5 2.6 2.7
Fee Inc (INR b)
Source: MOSL, Company
Exhibit 11: Strong deposit growth; Focus also remained on
borrowings
Deposits (INR b)
29
32
23
23
28
26 28 23
15
11 10 12
YoY Gr (%)
24 23 23 22
Exhibit 12: Strong CASA momentum; CASA ratio improved to
34.7% v/s 33.3% in 1QFY15 (%)
CASA Ratio
YoY CASA Gr (%)
24
Source: Company, MOSL
Exhibit 13: Above industry loan growth continues (%)
Loans (INR b)
31
28 30
34
31 31 31
26 27
YoY Gr (%)
25 23
24 24 24 24 22 22
Exhibit 14: CCB continues to drive loan growth (YoY, %)
CFD (% of loans)
CCB (% of loans)
55 53 52 51 50 48 49 49 51 51 53 55 57 57 58 59 58
45 47 48 49 50 52 51 51 49 49 47 45 43 43 42 41 42
Source: MOSL, Company
13 July 2015
8

IndusInd Bank
Exhibit 15: Slippage ratio returned to normal range post one-
off increase in 4QFY15 (%)
Exhibit 16: PCR declined 740bp QoQ to 62.6%
Overall
5.0
4.0
3.0
2.0
1.0
0.0
CFD
C&IB
GNPA (%)
NNPA (%)
PCR (%)
Source: MOSL, Company
Exhibit 17: One large corporate account was restructured
during the quarter (OSRL %)
0.5 0.6 0.5
0.4
0.3
0.3 0.2
0.3 0.3 0.3
0.3 0.3 0.3
0.4
0.6
Exhibit 18: Credit cost remains manageable
Credit Cost (annualized in bp)
68
57 55
36
42
62
50
44
54 54 54 51 54
60
41
53 52
0.2
0.2
Source: MOSL, Company
Exhibit 19: Strong CET1 ratio (including dilution impact) (%)
Exhibit 20: Investments in network expansion continue
(branches) – 10 branches added in 1QFY16
Source: MOSL, Company
13 July 2015
9

IndusInd Bank
Exhibit 21: Quarterly Snapshot (INR b)
FY14
1Q
Profit and Loss
Net Interest Income
Other Income
Trading profits
Others (Ex non core)
Total Income
Operating Expenses
Employee
Others
Operating Profits
Provisions
PBT
Taxes
PAT
Asset Quality
GNPA
NNPA
GNPA (%)
NNPA (%)
PCR (Calculated, %)
Ratios (%)
Fees to Total Income
Tax Rate
CASA (Reported)
Loan/Deposit
RoA
RoE
Margins (%) - Reported
Yield on loans
Cost of deposits
Margins
Balance Sheet (INR b)
Loans
Investments
Deposits
CASA Deposits
of which Savings
Current
Borrowings
Total Assets
Risk Weighted Assets
6,795
4,706
1,045
3,661
11,501
5,085
1,936
3,149
6,416
1,321
5,095
1,747
3,348
5,052
1,014
1.1
0.2
79.9
31.8
34.3
30.0
85.2
1.8
17.6
13.4
8.2
3.7
474
174
557
167
79
88
78
737
565
2Q
6,999
4,167
242
3,925
11,167
5,288
2,020
3,268
5,879
889
4,991
1,688
3,302
5,464
1,092
1.1
0.2
80.0
35.2
33.8
31.8
92.3
1.7
16.7
13.5
8.2
3.7
490
194
531
169
86
83
140
774
589
3Q
7,301
4,803
535
4,268
12,104
5,630
2,058
3,572
6,474
1,262
5,212
1,743
3,469
6,258
1,649
1.2
0.3
73.6
35.3
33.4
32.2
93.3
1.7
16.8
13.8
8.4
3.7
525
201
562
181
93
88
148
818
620
4Q
7,812
5,229
811
4,419
13,041
5,851
2,079
3,771
7,191
1,206
5,985
2,025
3,961
6,208
1,841
1.1
0.3
70.4
33.9
33.8
32.5
91.1
1.9
18.5
13.7
8.1
3.8
551
216
605
197
99
98
148
870
673
1Q
8,007
5,764
899
4,865
13,770
6,278
2,203
4,076
7,492
1,104
6,388
2,177
4,211
6,544
1,956
1.1
0.3
70.1
35.3
34.1
33.3
91.8
1.9
19.0
13.5
8.2
3.7
587
213
639
213
106
107
142
904
741
2Q
8,331
5,583
490
5,093
13,914
6,667
2,393
4,274
7,247
732
6,515
2,213
4,302
6,545
1,950
1.1
0.3
70.2
36.6
34.0
33.9
90.8
1.9
18.2
13.3
8.0
3.6
599
215
660
224
114
110
133
923
778
FY15
3Q
8,614
6,108
885
5,223
14,721
6,983
2,556
4,427
7,738
980
6,758
2,286
4,471
6,727
2,015
1.1
0.3
70.0
35.5
33.8
34.1
92.0
1.9
18.3
13.0
7.8
3.7
638
232
694
236
122
115
168
1,000
847
4Q
9,251
6,585
899
5,686
15,836
7,331
2,654
4,677
8,505
1,074
7,431
2,478
4,953
5,629
2,105
0.8
0.3
62.6
35.9
33.3
34.1
92.8
1.9
19.8
12.8
7.7
3.7
688
249
741
253
129
124
206
1,091
889
FY16
1Q
9,807
7,243
1,254
5,989
17,050
7,823
2,723
5,100
9,227
1,233
7,994
2,744
5,250
5,701
2,248
0.8
0.3
60.6
35.1
34.3
34.7
93.0
1.9
20.4
12.7
7.6
3.7
-5
-8
0
-77
-58
2
Variation (%)
QoQ
YoY
6
10
39
5
8
7
3
9
8
15
8
11
6
1
7
-2
0
-204
22
26
40
23
24
25
24
25
23
12
25
26
25
-13
15
-32
-2
-955
722
5
23
256
3
20
777
5
22
269
7
26
140
8
33
129
5
21
214
4
51
1,144
5
27
906
2
22
Source: MOSL, Company
13 July 2015
10

IndusInd Bank
Financials and valuations
Y/E March
Interest Income
Interest Expense
Net Interest Income
Change (%)
Non Interest Income
Net Income
Change (%)
Operating Expenses
Pre Provision Profits
Change (%)
Provisions (excl tax)
PBT
Tax
Tax Rate (%)
PAT
Change (%)
Equity Dividend (Incl tax)
Core PPP*
Change (%)
*Core PPP is (NII+Fee income-Opex)
Balance Sheet
Y/E March
Equity Share Capital
Reserves & Surplus
Net Worth
Of which Equity Networth
Deposits
Change (%)
of which CASA Dep
Change (%)
Borrowings
Other Liabilities & Prov.
Total Liabilities
Current Assets
Investments
Change (%)
Loans
Change (%)
Fixed Assets
Other Assets
Total Assets
Asset Quality
GNPA (INR m)
NNPA (INR m)
GNPA Ratio
NNPA Ratio
PCR (Excl Tech. write off)
E: MOSL Estimates
13 July 2015
2011
35,894
22,129
13,765
55.3
7,137
20,902
45.2
10,085
10,817
53.7
2,019
8,798
3,025
34.4
5,773
64.8
932
9,764
67.6
2012
53,592
36,549
17,042
23.8
10,118
27,160
29.9
13,430
13,730
26.9
1,804
11,927
3,900
32.7
8,026
39.0
1,196
12,680
29.9
2013
69,832
47,504
22,329
31.0
13,630
35,958
32.4
17,564
18,395
34.0
2,631
15,764
5,152
32.7
10,612
32.2
1,838
17,325
36.6
2014
82,535
53,628
28,907
29.5
18,905
47,812
33.0
21,853
25,960
41.1
4,676
21,283
7,203
33.8
14,080
32.7
2,154
23,327
34.6
2015
96,920
62,717
34,203
18.3
24,039
58,241
21.8
27,259
30,982
19.3
3,891
27,092
9,155
33.8
17,937
27.4
2,552
28,232
21.0
2016E
114,203
70,129
44,073
28.9
31,475
75,549
29.7
33,976
41,573
34.2
5,037
36,536
12,239
33.5
24,296
35.5
3,397
37,073
31.3
2017E
134,950
80,135
54,815
24.4
38,754
93,570
23.9
41,694
51,876
24.8
6,397
45,479
15,235
33.5
30,243
24.5
4,228
46,626
25.8
2018E
167,668
97,886
69,782
27.3
47,645
117,427
25.5
51,168
66,259
27.7
8,124
58,135
19,475
33.5
38,660
27.8
5,405
60,259
29.2
2011
4,660
35,842
40,502
40,502
343,654
28.7
93,309
47.6
55,254
16,948
456,358
40,246
135,508
30.3
261,656
27.3
5,965
12,983
456,358
2012
4,677
42,740
47,417
47,417
423,615
23.3
115,631
23.9
86,820
18,108
575,961
55,396
145,719
7.5
350,640
34.0
6,568
17,638
575,961
2013
5,229
71,074
76,303
76,303
541,167
27.7
158,674
37.2
94,596
21,000
733,065
68,487
196,542
34.9
443,206
26.4
7,561
17,269
733,065
2014
5,256
85,173
90,430
90,430
605,023
11.8
196,909
24.1
147,620
27,187
870,259
67,694
215,630
9.7
551,018
24.3
10,164
25,753
870,259
2015
5,295
101,151
106,445
106,445
741,344
22.5
252,996
28.5
206,181
37,190
1,091,159
107,791
248,594
15.3
687,882
24.8
11,576
35,316
1,091,159
2016E
5,807
164,755
170,562
170,562
867,372
17.0
335,187
32.5
217,349
44,684
1,299,967
84,652
285,883
15.0
873,610
27.0
11,677
44,145
1,299,967
1914%
5,050
1,524
0.6
0.2
69.8
(INR Million)
2017E
2018E
5,807
190,708
196,515
196,515
1,101,563
27.0
432,788
29.1
247,935
53,730
1,599,743
94,402
328,765
15.0
1,109,485
27.0
11,909
55,182
1,599,743
2306%
7,022
2,499
0.6
0.2
64.4
5,807
223,900
229,707
229,707
1,398,984
27.0
549,351
26.9
283,110
64,651
1,976,452
110,968
378,080
15.0
1,409,046
27.0
12,140
66,218
1,976,452
2355%
(%)
10,089
3,495
0.7
0.2
65.4
2,659
728
1.0
0.3
72.6
3,471
947
1.0
0.3
72.7
4,578
1,368
1.0
0.3
70.1
6,208
1,841
1.1
0.3
70.4
5,629
2,105
0.8
0.3
62.6
11

IndusInd Bank
Financials and valuations
Ratios
Y/E March
Spreads Analysis (%)
Avg. Yield-Earning Assets
Avg. Yield on loans
Avg. Yield on Investments
Avg. Cost-Int. Bear. Liab.
Avg. Cost of Deposits
Interest Spread
Net Interest Margin
Profitability Ratios (%)
RoE
RoA
Int. Expense/Int.Income
Fee Income/Net Income
Non Int. Inc./Net Income
Efficiency Ratios (%)
Cost/Income*
Empl. Cost/Op. Exps.
Busi. per Empl. (INR m)
NP per Empl. (INR lac)
* ex treasury and RWO
Asset-Liability Profile (%)
Loans/Deposit Ratio
CASA Ratio
Investment/Deposit Ratio
G-Sec/Investment Ratio
CAR
Tier 1
Y/E March
Book Value (INR)
Change (%)
Price-BV (x)
Adjusted BV (INR)
Price-ABV (x)
EPS (INR)
Change (%)
Price-Earnings (x)
Dividend Per Share (INR)
Dividend Yield (%)
E: MOSL Estimates
2.0
12.4
45.3
81.1
76.1
27.2
39.4
74.0
15.9
12.3
2011
82.1
55.7
82.8
27.3
34.4
81.7
13.9
11.4
2012
96.7
17.8
9.6
95.4
9.7
17.2
38.5
54.0
2.2
0.2
81.9
29.3
36.3
71.8
15.4
13.8
2013
141.9
46.7
6.5
140.2
6.6
20.3
18.3
45.7
3.0
0.3
91.1
32.5
35.6
71.3
13.8
12.7
2014
164.5
15.9
5.6
162.2
5.7
26.8
32.0
34.6
3.5
0.4
92.8
34.1
33.5
72.0
12.1
11.2
2015
193.7
17.7
4.8
191.1
4.9
33.9
26.5
27.4
4.0
0.4
100.7
38.6
33.0
70.2
16.1
15.4
2016E
287.1
48.3
3.2
285.4
3.2
41.8
23.5
22.2
5.0
0.5
100.7
39.3
29.8
74.2
15.1
14.5
2017E
331.9
15.6
2.8
329.1
2.8
52.1
24.5
17.8
6.3
0.7
100.7
39.3
27.0
78.3
14.2
13.8
2018E
389.2
17.3
2.4
385.3
2.4
66.6
27.8
13.9
8.0
0.9
50.3
37.9
87.0
0.9
51.3
36.1
84.2
1.0
50.6
37.7
84.3
1.0
48.6
37.0
79.0
1.0
49.5
36.0
74.5
1.0
48.1
35.8
78.0
1.2
47.4
36.2
84.5
1.3
46.1
36.5
89.6
1.4
19.3
1.4
61.7
30.1
34.1
19.2
1.6
68.2
33.6
37.3
17.8
1.6
68.0
34.5
37.9
17.5
1.8
65.0
33.7
39.5
19.0
1.8
64.7
35.8
41.3
18.05
2.03
61.4
35.1
41.7
16.8
2.1
59.4
35.3
41.4
18.5
2.2
58.4
35.1
40.6
9.9
12.1
6.1
6.2
6.0
3.7
3.8
11.5
13.8
7.7
8.0
8.0
3.4
3.6
11.7
14.1
7.5
8.3
8.3
3.4
3.7
11.3
13.3
7.2
7.7
7.6
3.5
3.9
10.8
12.5
7.2
7.4
7.7
3.4
3.8
10.4
11.6
6.8
6.9
7.1
3.5
4.0
10.1
11.0
6.7
6.6
6.6
3.5
4.1
10.1
11.0
6.7
6.5
6.4
3.6
4.2
2011
2012
2013
2014
2015
2016E
2017E
2018E
13 July 2015
12

IndusInd Bank
Corporate profile
Company description
IndusInd Bank (IIB) is one of the ten new private sector
banks which were awarded license in 1994. The bank
has pan-India presence with 811 branches and 1,543
ATMs as on June 30, 2015. It also has one representative
office each in Dubai and London. Current management
team, led by Managing Director Mr Romesh Sobti, took
charge in February 2008 and has since been effecting
structural and operational changes to improve
productivity and efficiency, leading to strong
improvement in core operating performance.
Exhibit 23: Shareholding pattern (%)
Jun-15
Promoter
DII
FII
Others
15.0
9.4
50.8
24.8
Mar-15
15.1
9.0
51.9
24.0
Jun-14
15.2
8.6
55.9
20.4
Exhibit 22: Sensex rebased
Exhibit 24: Top holders
Holder Name
Bridge India Fund
Afrin Dia
GA Global Investments Ltd
Goldman Sachs Investments (Mauritius) I
Franklin Templeton Investment Fund
% Holding
4.2
2.8
2.4
1.8
1.7
Note: FII Includes depository receipts
Exhibit 25:
Top management
Name
Romesh Sobti
Paul Abraham
SV Zaregaonkar
Suhail Chander
SV Parthasarathy
Designation
MD & CEO
COO
CFO
Head - Corporate Banking
Head – Consumer Finance
Exhibit 26: Directors
Name
R Seshasayee
Romesh Sobti
Vijay Vaid*
Ashok Kini*
S C Tripathi*
*Independent
Name
Kanchan Chitale*
T Anantha Narayanan
Y M Kale
Exhibit 27: Auditors
Name
BSR & Co
Statutory
Type
Exhibit 28: MOSL forecast v/s consensus
EPS (INR)
FY16
FY17
FY18
MOSL forecast
41.8
52.1
66.6
Consensus
forecast
42.6
53.9
69.4
Variation (%)
-1.8
-3.3
-4.1
13 July 2015
13

This document has been prepared by Motilal Oswal Securities Limited (hereinafter referred to as Most) to provide information about the company(ies) and/sector(s), if any, covered in the report and may be distributed
IndusInd Bank
by it and/or its affiliated company(ies). This report is for personal information of the selected recipient/s and does not construe to be any investment, legal or taxation advice to you. This research report does not
constitute an offer, invitation or inducement to invest in securities or other investments and Motilal Oswal Securities Limited (hereinafter referred as MOSt) is not soliciting any action based upon it. This report is not for
public distribution and has been furnished to you solely for your general information and should not be reproduced or redistributed to any other person in any form. This report does not constitute a personal
recommendation or take into account the particular investment objectives, financial situations, or needs of individual clients. Before acting on any advice or recommendation in this material, investors should consider
whether it is suitable for their particular circumstances and, if necessary, seek professional advice. The price and value of the investments referred to in this material and the income from them may go down as well as
up, and investors may realize losses on any investments. Past performance is not a guide for future performance, future returns are not guaranteed and a loss of original capital may occur.
MOSt and its affiliates are a full-service, integrated investment banking, investment management, brokerage and financing group. We and our affiliates have investment banking and other business relationships with a
some companies covered by our Research Department. Our research professionals may provide input into our investment banking and other business selection processes. Investors should assume that MOSt and/or
its affiliates are seeking or will seek investment banking or other business from the company or companies that are the subject of this material and that the research professionals who were involved in preparing this
material may educate investors on investments in such business. The research professionals responsible for the preparation of this document may interact with trading desk personnel, sales personnel and other
parties for the purpose of gathering, applying and interpreting information. Our research professionals are paid on the profitability of MOSt which may include earnings from investment banking and other business.
MOSt generally prohibits its analysts, persons reporting to analysts, and members of their households from maintaining a financial interest in the securities or derivatives of any companies that the analysts cover.
Additionally, MOSt generally prohibits its analysts and persons reporting to analysts from serving as an officer, director, or advisory board member of any companies that the analysts cover. Our salespeople, traders,
and other professionals or affiliates may provide oral or written market commentary or trading strategies to our clients that reflect opinions that are contrary to the opinions expressed herein, and our proprietary
trading and investing businesses may make investment decisions that are inconsistent with the recommendations expressed herein. In reviewing these materials, you should be aware that any or all of the foregoing
among other things, may give rise to real or potential conflicts of interest. MOSt and its affiliated company(ies), their directors and employees and their relatives may; (a) from time to time, have a long or short position
in, act as principal in, and buy or sell the securities or derivatives thereof of companies mentioned herein. (b) be engaged in any other transaction involving such securities and earn brokerage or other compensation
or act as a market maker in the financial instruments of the company(ies) discussed herein or act as an advisor or lender/borrower to such company(ies) or may have any other potential conflict of interests with
respect to any recommendation and other related information and opinions.; however the same shall have no bearing whatsoever on the specific recommendations made by the analyst(s), as the recommendations
made by the analyst(s) are completely independent of the views of the affiliates of MOSt even though there might exist an inherent conflict of interest in some of the stocks mentioned in the research report
Reports based on technical and derivative analysis center on studying charts company's price movement, outstanding positions and trading volume, as opposed to focusing on a company's fundamentals and, as
such, may not match with a report on a company's fundamental analysis. In addition MOST has different business segments / Divisions with independent research separated by Chinese walls catering to different set
of customers having various objectives, risk profiles, investment horizon, etc, and therefore may at times have different contrary views on stocks sectors and markets.
Unauthorized disclosure, use, dissemination or copying (either whole or partial) of this information, is prohibited. The person accessing this information specifically agrees to exempt MOSt or any of its affiliates or
employees from, any and all responsibility/liability arising from such misuse and agrees not to hold MOSt or any of its affiliates or employees responsible for any such misuse and further agrees to hold MOSt or any of
its affiliates or employees free and harmless from all losses, costs, damages, expenses that may be suffered by the person accessing this information due to any errors and delays. The information contained herein is
based on publicly available data or other sources believed to be reliable. Any statements contained in this report attributed to a third party represent MOSt’s interpretation of the data, information and/or opinions
provided by that third party either publicly or through a subscription service, and such use and interpretation have not been reviewed by the third party. This Report is not intended to be a complete statement or
summary of the securities, markets or developments referred to in the document. While we would endeavor to update the information herein on reasonable basis, MOSt and/or its affiliates are under no obligation to
update the information. Also there may be regulatory, compliance, or other reasons that may prevent MOSt and/or its affiliates from doing so. MOSt or any of its affiliates or employees shall not be in any way
responsible and liable for any loss or damage that may arise to any person from any inadvertent error in the information contained in this report. MOSt or any of its affiliates or employees do not provide, at any time,
any express or implied warranty of any kind, regarding any matter pertaining to this report, including without limitation the implied warranties of merchantability, fitness for a particular purpose, and non-infringement.
The recipients of this report should rely on their own investigations.
This report is intended for distribution to institutional investors. Recipients who are not institutional investors should seek advice of their independent financial advisor prior to taking any investment decision based on
this report or for any necessary explanation of its contents.
Most and it’s associates may have managed or co-managed public offering of securities, may have received compensation for investment banking or merchant banking or brokerage services, may have received any
compensation for products or services other than investment banking or merchant banking or brokerage services from the subject company in the past 12 months.
Most and it’s associates have not received any compensation or other benefits from the subject company or third party in connection with the research report.
Subject Company may have been a client of Most or its associates during twelve months preceding the date of distribution of the research report
MOSt and/or its affiliates and/or employees may have interests/positions, financial or otherwise of over 1 % at the end of the month immediately preceding the date of publication of the research in the securities
mentioned in this report. To enhance transparency, MOSt has incorporated a Disclosure of Interest Statement in this document. This should, however, not be treated as endorsement of the views expressed in the
report.
Motilal Oswal Securities Limited is registered as a Research Analyst under SEBI (Research Analyst) Regulations, 2014. SEBI Reg. No. INH000000412
There are no material disciplinary action that been taken by any regulatory authority impacting equity research analysis activities
Analyst Certification
The views expressed in this research report accurately reflect the personal views of the analyst(s) about the subject securities or issues, and no part of the compensation of the research analyst(s) was, is, or will be
directly or indirectly related to the specific recommendations and views expressed by research analyst(s) in this report. The research analysts, strategists, or research associates principally responsible for preparation
of MOSt research receive compensation based upon various factors, including quality of research, investor client feedback, stock picking, competitive factors and firm revenues
Disclosure of Interest Statement
Analyst ownership of the stock
Served as an officer, director or employee
INDUSIND BANK
No
No
Disclosures
A graph of daily closing prices of securities is available at www.nseindia.com and http://economictimes.indiatimes.com/markets/stocks/stock-quotes
Regional Disclosures (outside India)
For U.S.
This report is not directed or intended for distribution to or use by any person or entity resident in a state, country or any jurisdiction, where such distribution, publication, availability or use would be contrary to law,
regulation or which would subject MOSt & its group companies to registration or licensing requirements within such jurisdictions.
Motilal Oswal Securities Limited (MOSL) is not a registered broker - dealer under the U.S. Securities Exchange Act of 1934, as amended (the"1934 act") and under applicable state laws in the United States. In
addition MOSL is not a registered investment adviser under the U.S. Investment Advisers Act of 1940, as amended (the "Advisers Act" and together with the 1934 Act, the "Acts), and under applicable state laws in the
United States. Accordingly, in the absence of specific exemption under the Acts, any brokerage and investment services provided by MOSL, including the products and services described herein are not available to or
intended for U.S. persons.
This report is intended for distribution only to "Major Institutional Investors" as defined by Rule 15a-6(b)(4) of the Exchange Act and interpretations thereof by SEC (henceforth referred to as "major institutional
investors"). This document must not be acted on or relied on by persons who are not major institutional investors. Any investment or investment activity to which this document relates is only available to major
institutional investors and will be engaged in only with major institutional investors. In reliance on the exemption from registration provided by Rule 15a-6 of the U.S. Securities Exchange Act of 1934, as amended (the
"Exchange Act") and interpretations thereof by the U.S. Securities and Exchange Commission ("SEC") in order to conduct business with Institutional Investors based in the U.S., MOSL has entered into a chaperoning
agreement with a U.S. registered broker-dealer, Motilal Oswal Securities International Private Limited. ("MOSIPL"). Any business interaction pursuant to this report will have to be executed within the provisions of this
chaperoning agreement.
The Research Analysts contributing to the report may not be registered /qualified as research analyst with FINRA. Such research analyst may not be associated persons of the U.S. registered broker-dealer, MOSIPL,
and therefore, may not be subject to NASD rule 2711 and NYSE Rule 472 restrictions on communication with a subject company, public appearances and trading securities held by a research analyst account.
Motilal Oswal Capital Markets Singapore Pte Limited is acting as an exempt financial advisor under section 23(1)(f) of the Financial Advisers Act(FAA) read with regulation 17(1)(d) of the Financial Advisors
Regulations and is a subsidiary of Motilal Oswal Securities Limited in India. This research is distributed in Singapore by Motilal Oswal Capital Markets Singapore Pte Limited and it is only directed in Singapore to
accredited investors, as defined in the Financial Advisers Regulations and the Securities and Futures Act (Chapter 289), as amended from time to time.
In respect of any matter arising from or in connection with the research you could contact the following representatives of Motilal Oswal Capital Markets Singapore Pte Limited:
Kadambari Balachandran
Email : kadambari.balachandran@motilaloswal.com
Contact : (+65) 68189233 / 65249115
Office Address : 21 (Suite 31),16 Collyer Quay,Singapore 04931
For Singapore
Motilal Oswal Securities Ltd
13 July 2015
Motilal Oswal Tower, Level 9, Sayani Road, Prabhadevi, Mumbai 400 025
Phone: +91 22 3982 5500 E-mail: reports@motilaloswal.com
14