16 July 2015
1QFY16 Results Update | Sector:
Media
HT Media
BSE SENSEX
28,446
Bloomberg
Equity Shares (m)
M.Cap.(INR b)/(USD b)
52-Week Range (INR)
1, 6, 12 Rel. Per (%)
Avg Val INRm/Vol ‘000
Free float (%)
Financials & Valuation (INR b)
Y/E MAR
Net Sales
EBITDA
Adj. NP
Adj. EPS (INR)
Adj.EPS Gr.(%)
BV/Sh (INR)
RoE (%)
RoCE (%)
P/E (x)
P/BV (x)
Estimate change
TP change
Rating change
2015 2016E 2017E
22.9
2.8
1.8
8.5
14.9
9.9
10.5
10.3
1.0
24.3
2.9
1.8
7.7
-9.0
8.1
9.7
11.3
0.9
5-8%
26.4
3.2
2.1
9.2
18.4
8.7
10.4
9.5
0.8
n
n
S&P CNX
8,608
HTML IN
232.8
20.3/0.3
145/87
-12/-32/-36
21/187
30.5
n
CMP: INR87
n
TP: INR100 (+15%)
Neutral
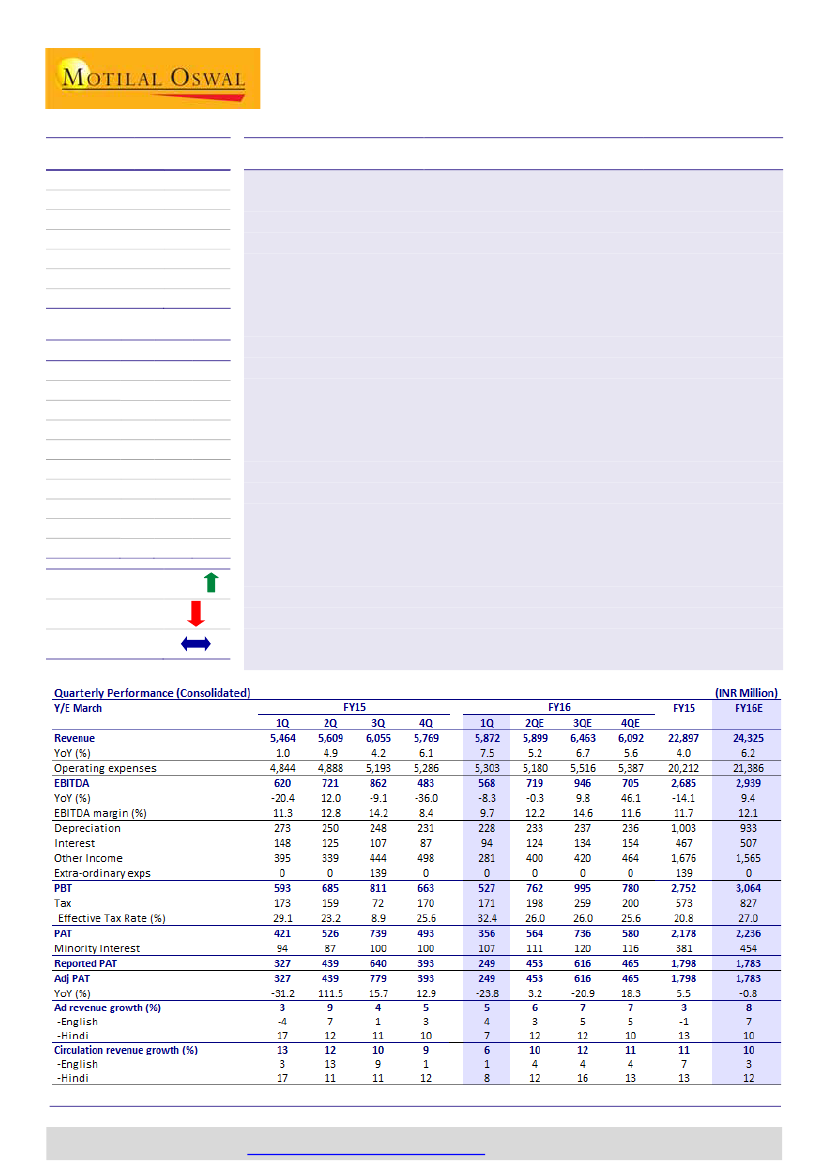
EBITDA and ad growth in line; lower other income impacts PAT
EBITDA down 8%, PAT down 24% (YoY):
HTML’s 1QFY16 PAT declined 24% YoY to
INR393m, led by 1) continued sluggishness in ad growth, 2) front-ended digital
investments for the year (Shine.com), 3) lower other income due to MTM impact
of increased interest rates on mutual fund investments, and 4) higher tax rate. The
impact was partially offset by continued benign raw material prices (down 5% YoY)
Ad and circulation revenue up 5-6% YoY; broadly in line:
Revenue grew 7% YoY to
INR5.87b (est: INR5.74b). Ad revenue increased 5% YoY to INR4.43b (~7% adjusted
for election billing in 1QFY15), with Hindi up 7% YoY and English up 4% YoY.
Circulation revenue grew 6% YoY (English up 1%; Hindi up 8%).
EBITDA margin down 170bp despite favorable newsprint prices:
EBITDA margin
declined 170bp to 9.7%. While raw material costs were favorable (down ~400bp),
the company incurred higher other expenses (up ~500bp YoY)—largely toward
advertising and sales promotion in the digital business. HTML has front-ended the
investments in digital business, with EBITDA loss at INR239m for 1QFY16
compared with its target of INR500m-600m loss for the full year.
Maintaining EBITDA estimates but upgrading earnings 5-8%; Neutral:
HT Media’s
1QFY16 operating performance was broadly in line. While we remain positive on
the regional business (HMVL), sluggish English ad growth, losses in the digital
segment and low dividend pay-out are the key concerns. We are maintaining our
EBITDA estimates but upgrading earnings 5/8% in FY16/FY17 on lower
depreciation and finance costs. The stock trades at a P/E of 11.3x FY16E and 9.5x
FY17E. Maintain
Neutral
with a revised target price of INR100/sh based on 11x
FY17E EPS.
90.0 100.2 111.1
Shobhit Khare
(Shobhit.Khare@MotilalOswal.com); +91 22 3982 5428
Jay Gandhi
(Jay.Gandhi@MotilalOswal.com); +91 22 3089 6693
Investors are advised to refer through disclosures made at the end of the Research Report.
Motilal Oswal research is available on
www.motilaloswal.com/Institutional-Equities,
Bloomberg, Thomson Reuters, Factset and S&P Capital.

HT Media
Exhibit 1: Quarterly Revenue, EBITDA, and margin trend
Revenue (INR b)
20.3
17.2
14.6
24.0
19.8
17.8
18.6 18.2
19.0
14.8
14.4
EBITDA (INR b)
EBITDA margin (%)
16.014.314.4 16.3
13.9 12.814.2
13.7
12.0
11.3
11.1
9.7
8.4 9.7
Source: Company, MOSL
Exhibit 2: RM Cost as % of revenue
RM cost (INR m)
36.7
31.0
35.3
37.0
32.2
29.9
35.1
37.8
34.7
35.6
36.3
34.1
RM cost (% of revenue)
32.5
32.8
34.0
31.8
35.5
37.0
38.2
30.1
32.9
34.3
33.8
33.8
30.2
Source: Company, MOSL
Exhibit 3: Ad
revenue
break-up (INR b)
Hindi (INR b)
English (INR b)
1.4
1.5
1.5 1.7
0.8 1.0 0.9
0.8 0.7 0.7
0.9 0.9 1.1 1.1
1.0
1.1 1.2 1.1
1.2
1.1 1.3 1.3
1.3 1.6 1.4
2.8 2.7 2.7 2.6 3.0 2.6 2.6 2.5 3.0 2.7 2.8 2.6 3.1 2.8 2.7 2.8 3.2 2.9 2.8
2.1 2.2 2.2 2.3 2.4
1.9
Source: Company, MOSL
16 July 2015
2

HT Media
Exhibit 4: Circulation revenue break-up (INR b)
English (INR b)
Hindi (INR b)
0.5 0.5 0.5 0.5
0.4 0.5 0.5 0.5
0.4 0.4 0.4 0.4
0.3 0.3 0.3 0.4
0.3 0.3 0.3 0.3 0.3 0.3 0.3 0.3 0.3
0.2 0.2 0.2
0.1 0.2 0.2 0.1 0.1 0.1 0.2 0.2 0.2 0.2 0.2 0.1 0.2 0.2 0.2 0.2 0.2 0.2 0.2 0.2 0.2 0.2
Source: Company, MOSL
Exhibit 5: YoY ad revenue growth (%)
35
19
24
15
3
5
1
English
21
Hindi
20
Total
24
29
15
8
27
21
22 17
25 21
20
18
17
13
8
12
11
10
-4
14
11
16
17
12 11 10
7
2
3
1
8
10
4
6
6
9
6
10
-3
-4
3
7
9
1
4
3
5
4
5
-6
-3
-3
-2
-3
Source: Company, MOSL
Exhibit 6: YoY circulation revenue growth (%)
English
21
6
-2
-13
9
3
7
3
8
11 12
Hindi
19
16
Total
18 14
13 12 10
14
9
6
Source: Company, MOSL
16 July 2015
3

HT Media
Exhibit 7: HT Media: Consolidated quarterly results
Revenue
Operating expenditure
EBITDA
EBITDA margin (%)
Depreciation
Interest
Other income
PBT
Tax
Effective tax rate (%)
PAT
Minority interest
Reported net profit
Revenue mix (INR m)
Advertising
-English
-Hindi
Circulation
-English
-Hindi
Radio and entertainment
Others
Total
Operating cost (INR m)
Consumption of raw material
Employee cost
Other expenditure
Total Operating Costs
Operating Cost (% of Revenue)
Consumption of raw material
Employee cost
Other expenditure
1QFY15
5,464
4,844
620
11.3
273
148
395
593
173
29.1
421
94
327
4QFY15
5,769
5,286
483
8.4
231
87
498
663
170
25.6
493
100
393
1QFY16
5,872
5,303
569
9.7
228
94
281
527
171
32.4
357
107
250
YoY%
7
9
-8
-166bps
-17
-36
-29
-11
-1
328bps
-15
14
-24
QoQ%
2
0
18
132bps
-1
8
-44
-20
1
677bps
-28
7
-36
1QFY16E
5,743
5,191
552
9.6
297
190
299
364
95
26.0
269
102
167
v/s est (%)
2
2
3
7bps
-23
-50
-6
45
80
637bps
32
5
49
4,214
2,659
1,555
686
193
493
240
324
5,464
4,387
2,921
1,466
711
203
508
253
419
5,769
4,430
2,768
1,662
729
195
534
245
467
5,872
5
4
7
6
1
8
2
44
7
1
-5
13
3
-4
5
-3
12
2
4,418
2,739
1,679
754
207
547
269
301
5,743
0
1
-1
-3
-6
-2
-9
55
2
1,856
1,252
1,737
4,844
1,744
1,218
2,324
5,286
1,765
1,379
2,159
5,303
-5
10
24
9
1
13
-7
0
1,831
1,377
1,983
5,191
-4
0
9
2
34.0
22.9
31.8
30.2
21.1
40.3
30.1
23.5
36.8
-392bps
59bps
499bps
-17bps
238bps
-352bps
Source: Company, MOSL
16 July 2015
4

HT Media
Exhibit 8: HT Media: A Snapshot
INRb
Consolidated revenue
YoY (%)
Ad revenue
YoY (%)
-English
YoY (%)
-Hindi
YoY (%)
Circulation revenue
YoY (%)
-English
YoY (%)
-Hindi
YoY (%)
Operating expenses
YoY (%)
% of revenue
RM cost (INRb)
YoY (%)
% of revenue
Newsprint consumed ('000 tonnes)
YoY (%)
News print cost per kg
YoY (%)
FY08
12.2
15
10.1
16
8.4
13
1.7
32
1.5
10
0.5
10
1.0
10
10.3
19
85
4.6
7
38.1
150
15
28
-9
FY09
13.6
12
11.3
12
8.9
5
2.4
45
1.5
3
0.5
-7
1.1
8
12.6
22
93
5.6
20
41.1
147
-2
34
22
FY10
14.4
6
11.4
1
8.4
-5
3.0
22
1.8
19
0.6
28
1.2
15
11.6
-8
81
4.8
-15
33.1
143
-3
31
-10
FY11
17.9
24
13.9
22
10.2
20
3.8
27
1.8
0
0.6
-3
1.2
1
14.5
25
81
6.3
31
35.0
178
24
30
-2
FY12
20.0
12
15.3
10
11.0
8
4.4
16
2.0
8
0.6
4
1.3
10
17.2
18
86
7.2
16
36.1
180
1
33
8
FY13
20.5
2
15.3
0
10.7
-2
4.6
5
2.2
13
0.7
7
1.6
15
17.7
3
86
7.2
0
35.4
175
-2
33
1
FY14
22.0
7
16.7
9
11.4
6
5.3
15
2.6
15
0.8
17
1.8
15
18.9
7
86
7.3
1
33.3
175
0
35
7
FY15
22.9
4
17.2
3
11.2
-1
6.0
13
2.8
11
0.8
7
2.0
13
20.2
7
88
7.4
0
32.1
183
5
36
2
FY16E
24.3
6
18.6
8
12.0
7
6.6
10
3.1
10
0.9
3
2.3
12
21.4
6
88
7.3
-1
30.0
199
9
32
-10
FY17E
26.4
9
20.1
8
12.8
6
7.3
11
3.4
9
0.9
1
2.5
12
23.2
9
88
7.8
7
29.4
211
6
33
1
Source: Company, MOSL
Exhibit 9: Estimate change summary
INR b
Revenue
Old
Actual/New
Change (%)
EBITDA
Old
Actual/New
Change (%)
EBITDA Margin (%)
Old
Actual/New
Change (bp)
Adj net profit
Old
Actual/New
Change (%)
EPS (INR)
Old
Actual/New
Change (%)
FY16E
24.3
24.3
0
2.9
2.9
1
12.0
12.1
10
1.6
1.8
8.1
7.2
7.7
8.1
FY17E
26.5
26.4
0
3.2
3.2
0
12.1
12.2
3
2.0
2.1
5.0
8.7
9.2
5.0
Source: Company, MOSL
16 July 2015
5

HT Media
Financials and valuations
Income Statement (Consolidated)
Y/E March
Net Sales
YoY (%)
EBITDA
EBITDA margin (%)
Depreciation
Interest
Other Income
PBT
Tax
Tax rate (%)
PAT
Minority Interest
Reported PAT
Change (%)
Adjustments
Adjusted PAT
(INR Million)
2011
17,861
24.2
3,357
18.8
842
236
291
2,571
713
27.7
1,858
49
1,809
33
0
1,809
0
2012
20,011
12.0
2,850
14.2
916
362
750
2,322
626
27.0
1,696
60
1,636
-10
0
1,636
0
2012
470
4,012
9,989
14,470
3,462
1,360
460
19,752
12,927
4,993
7,934
125
807
8,320
8,914
1,819
2,757
1,571
2,320
447
6,349
3,224
3,125
2,565
0
19,751
2013
470
4,012
11,478
15,960
3,826
1,438
357
21,581
13,369
5,907
7,462
1,000
388
9,731
9,863
1,631
2,712
1,519
3,097
904
6,863
3,323
3,540
3,000
0
21,581
2013
20,482
2.4
2,826
13.8
914
446
938
2,404
623
25.9
1,781
104
1,677
3
0
1,677
0
2014
461
3,543
13,449
17,453
4,168
1,590
489
23,700
14,462
6,766
7,697
150
0
12,866
10,924
2,257
2,867
1,186
3,517
1,096
7,937
3,937
4,000
2,987
0
23,700
2014
22,007
7.4
3,124
14.2
858
649
1,624
3,240
916
28.3
2,324
246
2,078
24
-374
1,704
0
2015
22,897
4.0
2,755
12.0
1,003
467
1,676
2,849
574
20.1
2,275
381
1,770
-15
-28
1,798
28
2015
461
3,543
15,020
19,024
3,441
1,923
363
24,751
15,190
7,918
7,272
150
0
13,887
12,612
1,527
3,120
1,916
4,122
1,927
9,169
4,844
4,326
3,442
0
24,751
2016E
24,325
6.2
2,939
12.1
933
507
1,565
3,064
827
27.0
2,236
454
1,783
1
0
1,783
0
2017E
26,419
8.6
3,214
12.2
979
431
1,800
3,604
973
27.0
2,631
521
2,110
18
0
2,110
Balance Sheet
Y/E March
Share Capital
Share Premium
Reserves
Net Worth
Loans
Minority Interest
Deffered Tax Liability
Capital Employed
Gross Fixed Assets
Less: Depreciation
Net Fixed Assets
Capital WIP
Deferred Tax Assets
Investments
Curr. Assets
Inventory
Debtors
Cash & Bank Balance
Loans & Advances
Other current assets
Current Liab. & Prov.
Creditors
Prov. and other liabilities
Net Current Assets
Miscellanous exp
Application of Funds
E: MOSL Estimates
2011
470
4,012
8,540
13,022
3,122
1,299
0
17,444
12,127
4,077
8,050
194
86
7,595
7,557
1,456
2,525
1,152
2,109
315
6,037
3,176
2,862
1,520
0
17,444
2016E
461
3,543
16,714
20,717
4,546
2,377
363
28,003
15,920
8,852
7,068
150
0
16,000
14,487
1,798
3,383
3,000
4,379
1,927
9,702
5,125
4,577
4,785
0
28,003
(INR Million)
2017E
461
3,543
18,718
22,722
1,769
2,897
363
27,752
16,712
9,831
6,882
150
0
16,000
15,247
1,916
3,648
3,000
4,756
1,927
10,527
5,561
4,966
4,720
0
27,752
16 July 2015
6

HT Media
Financials and valuations
Ratios
Y/E March
Adjusted EPS
Growth (%)
Cash EPS
Book Value
DPS
Payout (incl. Div. Tax.) (%)
Valuation
P/E
Cash P/E
EV/EBITDA*
EV/Sales
Price/Book Value
Dividend Yield (%)
* Proportionate
2011
7.7
26.1
11.3
60.9
0.4
5.5
11.3
7.7
5.2
1.0
1.4
0.4
2012
7.0
-9.5
10.9
67.4
0.4
6.6
2013
7.1
2.5
11.0
74.0
0.4
6.5
2014
7.4
3.6
12.7
82.6
0.4
4.4
11.8
6.8
4.4
0.5
1.1
0.5
2015
8.5
14.9
12.9
90.0
0.4
5.0
10.3
6.7
4.4
0.4
1.0
0.5
2016E
7.7
-9.0
11.8
100.2
0.3
4.3
11.3
7.4
3.7
0.3
0.9
0.4
2017E
9.2
18.4
13.4
111.1
0.4
4.3
9.5
6.5
2.5
0.2
0.8
0.4
Profitability Ratios (%)
RoE
RoCE
Turnover Ratios
Debtors (Days)
Inventory (Days)
Creditors. (Days)
Asset Turnover (x)
Leverage Ratio
Debt/Equity (x)
14.9
13.0
52
30
80
2.2
0.2
10.9
10.4
50
33
69
2.3
0.2
10.1
10.0
48
29
69
2.2
0.2
9.4
12.1
48
37
76
2.2
0.2
9.9
10.5
50
24
88
2.5
0.2
8.1
9.7
51
27
87
2.7
0.2
8.7
10.4
50
26
87
3.0
0.1
Cash Flow Statement
Y/E March
EBITDA
Other Income
Interest Paid
Direct Taxes Paid
(Inc)/Dec in Wkg. Cap.
CF from Op.Activity
(inc)/Dec in FA + CWIP
(Pur)/Sale of Investments
CF from Inv.Activity
Issue of Shares
Inc/(Dec) in Debt
Dividends Paid
Other Financing Activities
CF from Fin.Activity
Inc/(Dec) in Cash
Add: Opening Balance
Closing Balance
E: MOSL Estimates
2011
3,357
291
-236
-977
395
2,831
-679
-2,840
-3,519
0
-180
-99
1,032
753
65
1,087
1,152
2012
2,850
750
-362
-887
-705
1,645
-732
-725
-1,457
0
340
-109
1
232
420
1,152
1,572
2013
2,826
938
-446
-308
-564
2,447
-1,317
-1,411
-2,728
0
364
-110
-26
228
-52
1,571
1,519
2014
3,124
1,624
-649
-396
-321
3,382
-244
-3,135
-3,378
-478
342
-107
-93
-336
-333
1,519
1,186
2015
2,755
1,536
-467
-699
88
3,213
-578
-1,022
-1,599
0
-727
-109
-49
-884
729
1,186
1,915
2016E
2,939
1,565
-507
-827
-258
2,912
-730
-2,113
-2,843
0
1,105
-89
0
1,016
1,085
1,916
3,000
(INR Million)
2017E
3,214
1,800
-431
-973
65
3,674
-793
0
-793
0
-2,776
-106
0
-2,882
0
3,000
3,000
16 July 2015
7

HT Media
Corporate profile: HT Media
Company description
HT Media is a leading Indian print media company
with a readership base of ~16m and average daily
circulation of 4.1m. Hindustan Times (English daily)
and Hindustan (Hindi daily) are leading brands
ranked 2nd and 3rd respectively on a pan-India
basis in their respective genres. ‘Mint’ is the second
most read business daily in India. HT Media’s radio
business is concentrated in the four metros. The
company’s online portfolio is focused on news,
networking, jobs and education space and is likely
to continue incurring operating loss.
Exhibit 10: Sensex rebased
160
140
120
100
80
Jul-14
Oct-14
Jan-15
Apr-15
Jul-15
H T Media
Sensex - Rebased
Exhibit 11: Shareholding pattern (%)
Mar-15
Promoter
DII
FII
Others
69.5
8.6
14.2
7.7
Dec-14
69.5
8.5
14.1
7.9
Mar-14
69.5
7.5
9.7
13.3
Exhibit 12: Top holders
Holder Name
Government Pension Fund Global
Reliance Capita! Trustee Company Limited A/C
Stichting Pensioenfonds ABP
Bajaj Allianz Life Insurance Company Ltd.
DSP Blackrock Small And Mid Cap Fund
% Holding
5.4
4.6
1.8
1.7
1.3
Note: FII Includes depository receipts
Exhibit 13: Top management
Name
Rajiv Verma
Piyush Gupta
Designation
Chief Executive Officer
Chief Financial Officer
Exhibit 14: Directors
Name
Shobhana Bhartia
N K Singh*
K N Memani*
Ajay Relan*
Name
Priyavrat Bhartia
Rajiv Verma
Shamit Bhartia
Vikram Singh Mehta*
*Independent
Exhibit 15: Auditors
Name
S R Batliboi & Co LLP
Type
Statutory
Exhibit 16: MOSL forecast v/s consensus
EPS
(INR)
FY16
FY17
MOSL
forecast
7.7
9.2
Consensus
forecast
9.5
11.3
Variation
(%)
-18.7
-18.5
16 July 2015
8

HT Media
NOTES
16 July 2015
9

This document has been prepared by Motilal Oswal Securities Limited (hereinafter referred to as Most) to provide information about the company(ies) and/sector(s), if any, covered in the report and may be distributed
HT Media
by it and/or its affiliated company(ies). This report is for personal information of the selected recipient/s and does not construe to be any investment, legal or taxation advice to you. This research report does not
constitute an offer, invitation or inducement to invest in securities or other investments and Motilal Oswal Securities Limited (hereinafter referred as MOSt) is not soliciting any action based upon it. This report is not for
public distribution and has been furnished to you solely for your general information and should not be reproduced or redistributed to any other person in any form. This report does not constitute a personal
recommendation or take into account the particular investment objectives, financial situations, or needs of individual clients. Before acting on any advice or recommendation in this material, investors should consider
whether it is suitable for their particular circumstances and, if necessary, seek professional advice. The price and value of the investments referred to in this material and the income from them may go down as well as
up, and investors may realize losses on any investments. Past performance is not a guide for future performance, future returns are not guaranteed and a loss of original capital may occur.
MOSt and its affiliates are a full-service, integrated investment banking, investment management, brokerage and financing group. We and our affiliates have investment banking and other business relationships with a
some companies covered by our Research Department. Our research professionals may provide input into our investment banking and other business selection processes. Investors should assume that MOSt and/or
its affiliates are seeking or will seek investment banking or other business from the company or companies that are the subject of this material and that the research professionals who were involved in preparing this
material may educate investors on investments in such business. The research professionals responsible for the preparation of this document may interact with trading desk personnel, sales personnel and other
parties for the purpose of gathering, applying and interpreting information. Our research professionals are paid on the profitability of MOSt which may include earnings from investment banking and other business.
MOSt generally prohibits its analysts, persons reporting to analysts, and members of their households from maintaining a financial interest in the securities or derivatives of any companies that the analysts cover.
Additionally, MOSt generally prohibits its analysts and persons reporting to analysts from serving as an officer, director, or advisory board member of any companies that the analysts cover. Our salespeople, traders,
and other professionals or affiliates may provide oral or written market commentary or trading strategies to our clients that reflect opinions that are contrary to the opinions expressed herein, and our proprietary
trading and investing businesses may make investment decisions that are inconsistent with the recommendations expressed herein. In reviewing these materials, you should be aware that any or all of the foregoing
among other things, may give rise to real or potential conflicts of interest. MOSt and its affiliated company(ies), their directors and employees and their relatives may; (a) from time to time, have a long or short position
in, act as principal in, and buy or sell the securities or derivatives thereof of companies mentioned herein. (b) be engaged in any other transaction involving such securities and earn brokerage or other compensation
or act as a market maker in the financial instruments of the company(ies) discussed herein or act as an advisor or lender/borrower to such company(ies) or may have any other potential conflict of interests with
respect to any recommendation and other related information and opinions.; however the same shall have no bearing whatsoever on the specific recommendations made by the analyst(s), as the recommendations
made by the analyst(s) are completely independent of the views of the affiliates of MOSt even though there might exist an inherent conflict of interest in some of the stocks mentioned in the research report
Reports based on technical and derivative analysis center on studying charts company's price movement, outstanding positions and trading volume, as opposed to focusing on a company's fundamentals and, as
such, may not match with a report on a company's fundamental analysis. In addition MOST has different business segments / Divisions with independent research separated by Chinese walls catering to different set
of customers having various objectives, risk profiles, investment horizon, etc, and therefore may at times have different contrary views on stocks sectors and markets.
Unauthorized disclosure, use, dissemination or copying (either whole or partial) of this information, is prohibited. The person accessing this information specifically agrees to exempt MOSt or any of its affiliates or
employees from, any and all responsibility/liability arising from such misuse and agrees not to hold MOSt or any of its affiliates or employees responsible for any such misuse and further agrees to hold MOSt or any of
its affiliates or employees free and harmless from all losses, costs, damages, expenses that may be suffered by the person accessing this information due to any errors and delays. The information contained herein is
based on publicly available data or other sources believed to be reliable. Any statements contained in this report attributed to a third party represent MOSt’s interpretation of the data, information and/or opinions
provided by that third party either publicly or through a subscription service, and such use and interpretation have not been reviewed by the third party. This Report is not intended to be a complete statement or
summary of the securities, markets or developments referred to in the document. While we would endeavor to update the information herein on reasonable basis, MOSt and/or its affiliates are under no obligation to
update the information. Also there may be regulatory, compliance, or other reasons that may prevent MOSt and/or its affiliates from doing so. MOSt or any of its affiliates or employees shall not be in any way
responsible and liable for any loss or damage that may arise to any person from any inadvertent error in the information contained in this report. MOSt or any of its affiliates or employees do not provide, at any time,
any express or implied warranty of any kind, regarding any matter pertaining to this report, including without limitation the implied warranties of merchantability, fitness for a particular purpose, and non-infringement.
The recipients of this report should rely on their own investigations.
This report is intended for distribution to institutional investors. Recipients who are not institutional investors should seek advice of their independent financial advisor prior to taking any investment decision based on
this report or for any necessary explanation of its contents.
Most and it’s associates may have managed or co-managed public offering of securities, may have received compensation for investment banking or merchant banking or brokerage services, may have received any
compensation for products or services other than investment banking or merchant banking or brokerage services from the subject company in the past 12 months.
Most and it’s associates have not received any compensation or other benefits from the subject company or third party in connection with the research report.
Subject Company may have been a client of Most or its associates during twelve months preceding the date of distribution of the research report
MOSt and/or its affiliates and/or employees may have interests/positions, financial or otherwise of over 1 % at the end of the month immediately preceding the date of publication of the research in the securities
mentioned in this report. To enhance transparency, MOSt has incorporated a Disclosure of Interest Statement in this document. This should, however, not be treated as endorsement of the views expressed in the
report.
Motilal Oswal Securities Limited is registered as a Research Analyst under SEBI (Research Analyst) Regulations, 2014. SEBI Reg. No. INH000000412
There are no material disciplinary action that been taken by any regulatory authority impacting equity research analysis activities
Analyst Certification
The views expressed in this research report accurately reflect the personal views of the analyst(s) about the subject securities or issues, and no part of the compensation of the research analyst(s) was, is, or will be
directly or indirectly related to the specific recommendations and views expressed by research analyst(s) in this report. The research analysts, strategists, or research associates principally responsible for preparation
of MOSt research receive compensation based upon various factors, including quality of research, investor client feedback, stock picking, competitive factors and firm revenues
Disclosure of Interest Statement
§
Analyst ownership of the stock
§
Served as an officer, director or employee
HT MEDIA LTD
No
No
Disclosures
A graph of daily closing prices of securities is available at www.nseindia.com and http://economictimes.indiatimes.com/markets/stocks/stock-quotes
Regional Disclosures (outside India)
For U.S.
This report is not directed or intended for distribution to or use by any person or entity resident in a state, country or any jurisdiction, where such distribution, publication, availability or use would be contrary to law,
regulation or which would subject MOSt & its group companies to registration or licensing requirements within such jurisdictions.
Motilal Oswal Securities Limited (MOSL) is not a registered broker - dealer under the U.S. Securities Exchange Act of 1934, as amended (the"1934 act") and under applicable state laws in the United States. In
addition MOSL is not a registered investment adviser under the U.S. Investment Advisers Act of 1940, as amended (the "Advisers Act" and together with the 1934 Act, the "Acts), and under applicable state laws in the
United States. Accordingly, in the absence of specific exemption under the Acts, any brokerage and investment services provided by MOSL, including the products and services described herein are not available to or
intended for U.S. persons.
This report is intended for distribution only to "Major Institutional Investors" as defined by Rule 15a-6(b)(4) of the Exchange Act and interpretations thereof by SEC (henceforth referred to as "major institutional
investors"). This document must not be acted on or relied on by persons who are not major institutional investors. Any investment or investment activity to which this document relates is only available to major
institutional investors and will be engaged in only with major institutional investors. In reliance on the exemption from registration provided by Rule 15a-6 of the U.S. Securities Exchange Act of 1934, as amended (the
"Exchange Act") and interpretations thereof by the U.S. Securities and Exchange Commission ("SEC") in order to conduct business with Institutional Investors based in the U.S., MOSL has entered into a chaperoning
agreement with a U.S. registered broker-dealer, Motilal Oswal Securities International Private Limited. ("MOSIPL"). Any business interaction pursuant to this report will have to be executed within the provisions of this
chaperoning agreement.
The Research Analysts contributing to the report may not be registered /qualified as research analyst with FINRA. Such research analyst may not be associated persons of the U.S. registered broker-dealer, MOSIPL,
and therefore, may not be subject to NASD rule 2711 and NYSE Rule 472 restrictions on communication with a subject company, public appearances and trading securities held by a research analyst account.
Motilal Oswal Capital Markets Singapore Pte Limited is acting as an exempt financial advisor under section 23(1)(f) of the Financial Advisers Act(FAA) read with regulation 17(1)(d) of the Financial Advisors
Regulations and is a subsidiary of Motilal Oswal Securities Limited in India. This research is distributed in Singapore by Motilal Oswal Capital Markets Singapore Pte Limited and it is only directed in Singapore to
accredited investors, as defined in the Financial Advisers Regulations and the Securities and Futures Act (Chapter 289), as amended from time to time.
In respect of any matter arising from or in connection with the research you could contact the following representatives of Motilal Oswal Capital Markets Singapore Pte Limited:
Kadambari Balachandran
Email : kadambari.balachandran@motilaloswal.com
Contact : (+65) 68189233 / 65249115
Office Address : 21 (Suite 31),16 Collyer Quay,Singapore 04931
For Singapore
Motilal Oswal Securities Ltd
16 July 2015
Motilal Oswal Tower, Level 9, Sayani Road, Prabhadevi, Mumbai 400 025
Phone: +91 22 3982 5500 E-mail: reports@motilaloswal.com
10