22 July 2015
1QFY16 Results Update | Sector:
Consumer
TTK Prestige
BSE SENSEX
28,371
Bloomberg
Equity Shares (m)
M.Cap.(INR b)/(USD b)
52-Week Range (INR)
1, 6, 12 Rel. Per (%)
Avg Val INRm/Vol ‘000
Free float (%)
Financials & Valuation (INR B)
Y/E MAR
Net Sales
EBITDA
Adj PAT
EPS (INR)
Gr (%)
2015
13.9
1.5
0.9
77.8
-15.0
2016E 2017E
15.5
18.0
1.9
1.2
103.2
32.8
624.7
17.5
25.2
38.5
6.4
2.4
1.6
140.6
36.2
718.6
20.9
30.2
28.2
5.5
S&P CNX
8,590
TTKPT IN
11.7
43.8/0.7
4,830/2,989
3/7/-9
80/21
29.6
CMP: INR3,987
TP: INR4,500 (+13%)
Buy
Results below estimates; new launches to drive growth
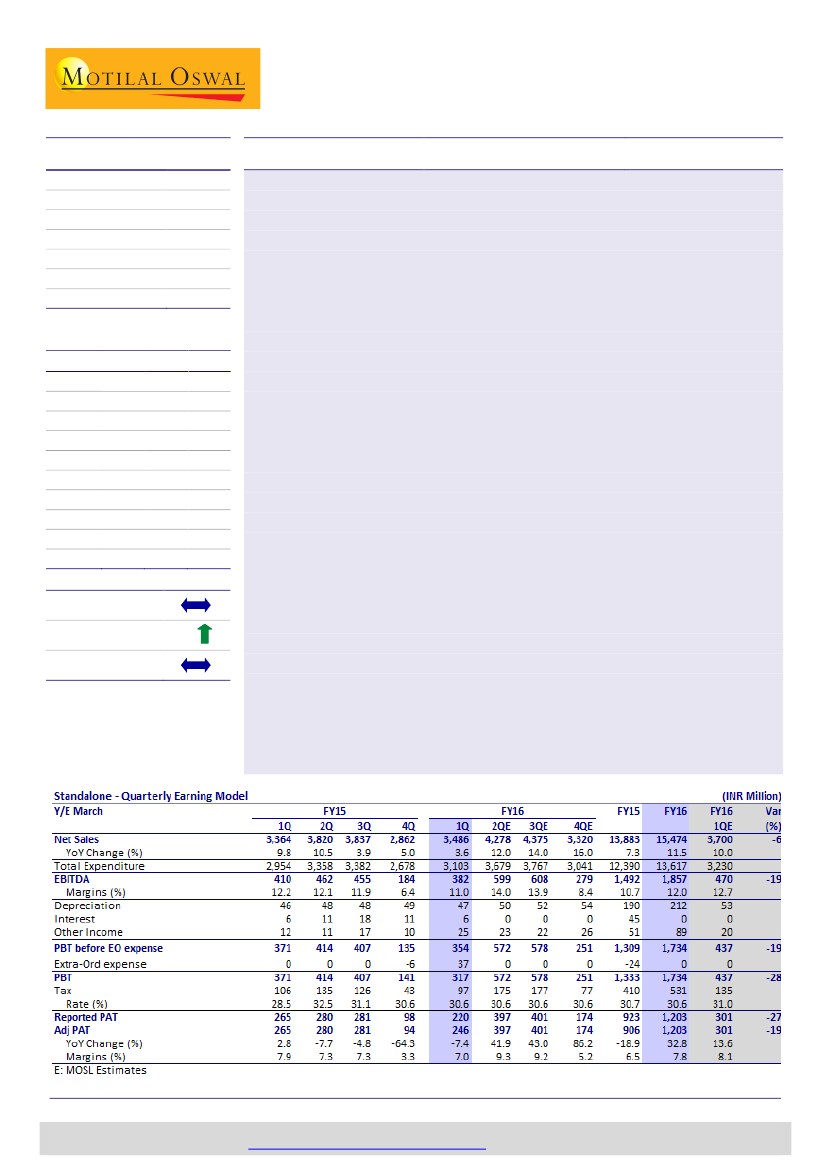
Results below estimates:
TTKPT reported overall revenue of INR3.5b (est. of
INR3.7b) as against INR3.4b in 1QFY15, marking a 3.6% YoY growth. Cookers
revenues de-grew 3% during 1QFY16 to INR1,310m, cookware revenues grew 14%
YoY to INR640m, and appliances revenues grew 6% YoY to INR1,490m. EBITDA
margins declined 120bps to 11% in 1QFY16 (est. of 12.7%). Adjusted PAT de-grew
7.4% YoY—from INR265m in 1QFY15 to INR246m in 1QFY16 (est. of INR301m).
Weak consumer sentiment resulted in muted growth; TTKPT gaining market
share over peers:
The management highlighted that weak consumer sentiment
has been responsible for sector’s slow growth; however, TTKPT has been
outperforming the market and witnessed market share gain of 200bp in pressure
cooker segment and 300bp in induction cooktop segment over the past one year.
Amongst channels, Prestige Smart Kitchen (PSK) has been outperforming other
channels and posted 10% growth for the quarter. The management is focusing on
driving higher footfalls and throughputs from the existing PSK stores and will add
new stores moderately.
Product innovation and direct tie-ups with e-commerce players to drive higher
growth:
New launches like “Signature” cookware, upcoming new product
launches in cookers and induction cooktops will act as a strong growth lever for
TTKPT. Post opening its first fulfillment center for e-commerce in Hosur, TTKPT
plans to extend this on a pan-India basis. Direct tie-ups with major e-commerce
players along with uniform pricing will prevent channel conflicts with traditional
retailers, complementing its already strong distribution structure.
Valuation and view:
With innovative product launches, e-commerce-led growth
and ramp-up of export opportunity, TTK will post 14% revenue CAGR over FY15-
17. We expect higher capacity utilization to drive significant operating leverage,
with margins expanding 280bps over FY15-17 (driving 34% PAT CAGR). Better
asset utilization and minimal reinvestment needs should drive strong free cash
flow generation (INR1.2b free cash flow) and improve return ratios (30% RoCE)
over FY15-17E. Maintain
Buy
(PT of INR4,500—32x FY17E EPS).
BV/Sh.INR 554.2
14.7
RoE (%)
RoCE (%)
P/E (x)
P/BV (X)
21.5
51.1
7.2
Estimate change
TP change
Rating change
5%
Niket Shah
(Niket.Shah@MotilalOswal.com); +91 22 3982 5426
Atul Mehra
(Atul.Mehra@MotilalOswal.com); +91 22 3982 5417
Investors are advised to refer through disclosures made at the end of the Research Report.
Motilal Oswal research is available on
www.motilaloswal.com/Institutional-Equities,
Bloomberg, Thomson Reuters, Factset and S&P Capital.

TTK Prestige
Results below estimates
TTKPT reported overall revenue of INR3.5b (est. INR3.7b) as against INR3.4b in
1QFY15 marking a YoY growth of 3.6%.
Domestic sales grew 6.4% to INR3.49b while exports sales dropped 45.7% to
INR77.8m, gross of excise duty. Domestic revenues thus contributed 97.8% to
total revenues during 1Q.
Sales in the non south part of India grew faster than south. However, the ratio
of Non South to South still remains 45:55. Management believes this to change
in future considering the pace of sales in north and west India.
EBITDA margins declined by 120bps (completely led by gross margins) from
12.2% in 1QFY15 to 11% in 1QFY16 (est. 12.7%).
EBITDA before CSR related expenses was seen down at INR414.8m against
INR422.5m in 1QFY15.
Consequently Adjusted PAT de-grew from INR265m in 1QFY15 to INR246m in
1QFY16 (est. INR301m) marking de-growth of 7.4% YoY.
Exhibit 2: EBITDA trend
Exhibit 1: Revenue trend
Revenues (INR m)
9.8
1.3
3.0
(15.5)
3,694
3,063 3,455
2,725 3,364 3,820 3,837 2,862 3,486
(3.8)
Growth (YoY, %)
10.5
5.0
3.9
EBITDA (INR m)
13.5
3.6
12.8
12.2
10.4
12.2
12.1
Margin (%)
11.9
6.4
11.0
414
444
450
283
410
462
455
184
382
Source: Company, MOSL
Exhibit 3: PAT trend
PAT (INR m)
0.1
-15.9
-33.1
-64.3
258
303
295
262
265
280
281
94
246
-6.5
2.8
Growth (YoY, %)
-7.7
-4.8
-7.4
Source: Company, MOSL
Cookware and appliances lead growth
Cooker revenues de-grew 3% during the quarter to INR1,310m, cookware
revenues grew 14% to INR640m, while appliances revenues grew 6% to
INR1,490m.
Management highlighted that the general de-growth was as a result of subdued
demand in the overall industry, and not because of competition.
2
22 July 2015

TTK Prestige
Price increase of 4% was undertaken in 4Q in cooker and cookware categories.
This started reflecting in 1QFY16 due to liquidation of older inventory at earlier
prices.
In terms of volumes, induction cook top, cookware, rice cookers and gas stoves
grew in double digits. Other cookers were largely flat or degrew.
For appliances, the top three products were gas stoves contributing ~INR470m,
mixers contributing ~INR270m and induction cooktop contributing ~INR350m.
New product and new models launched were received favorably by the market.
Exhibit 4: Revenues (INR m)
Segments
Cookers
Cookware
Appliances
Others
Total
1QFY14
1,190
480
1,380
90
3,140
2QFY14
1,380
560
1,500
90
3,530
3QFY14
1,330
710
1,630
110
3,780
4QFY14
1,040
520
1,130
90
2,780
1QFY15
1,350
560
1,400
130
3,440
2QFY15
1,480
740
1,550
140
3,910
3QFY15
1,390
780
1,590
160
3,920
4QFY15
1QFY16
1,060
1,310
550
640
1,190
1,490
130
130
2,930
3,570
Source: Company, MOSL
Exhibit 5: Revenues growth (YoY)
Segments
Cookers
Cookware
Appliances
Others
Total
1QFY14
-2%
-11%
13%
-25%
2%
2QFY14
4%
-8%
9%
-25%
3%
3QFY14
-16%
-5%
-18%
-15%
-15%
4QFY14
6%
-5%
-10%
-10%
-4%
1QFY15
13%
17%
1%
44%
14%
2QFY15
7%
32%
3%
56%
11%
3QFY15
5%
10%
-2%
45%
4%
4QFY15
1QFY16
2%
-3%
6%
14%
5%
6%
44%
0%
5%
4%
Source: Company, MOSL
Exhibit 6: Revenue mix (%)
Segments
Cookers
Cookware
Appliances
Others
Total
1QFY14
38%
15%
44%
3%
100%
2QFY14
39%
16%
42%
3%
100%
3QFY14
35%
19%
43%
3%
100%
4QFY14
37%
19%
41%
3%
100%
1QFY15
39%
16%
41%
4%
100%
2QFY15
38%
19%
40%
4%
100%
3QFY15
35%
20%
41%
4%
100%
4QFY15
1QFY16
36%
37%
19%
18%
41%
42%
4%
4%
100%
100%
Source: Company, MOSL
New launches seen to drive growth
Going forward, to put cookers category back on growth trajectory, TTKPT is
putting in efforts to overhaul the range with new shapes, colors and designs.
Focus is on bringing in new types of induction friendly cookers. Management
believes that considering the brand acceptability, these newer variants will drive
cooker growth.
The strong cookware growth was seen as a result of the launch of
“Signature” cookware which is a premium product. This has been heavily
advertised and is currently the most durable non-stick cookware available in
market today. TTKPY is witnessing a lot of traction already and considering that
this has just been launched, expects growth trend to continue.
Appliances segment saw launch of India’s first convertible gas stove and hobtob.
It is the first to be based on European technology as opposed to Chinese
technology.
22 July 2015
3

TTK Prestige
For induction cook tops a slew of new releases are planned to cater to various
price points and increase market share. A special premium product in terms of
an “automatic keto” is planned which will eliminate the requirement of
reheating.
Company is looking at kitchen woods as a segment where they plan to offer
Chimneys that are in excess of price point of INR35000.
Water purifiers as a segment is being researched upon and learnt from market.
Management is fully committed to this category and sees meaningful results to
show in later part of year.
Currently, capacity utilization is under 60% on an overall basis that provides
strong scope for ramp up. With a pickup in consumer demand and capacity
utilization, we believe TTPKT will be the biggest beneficiary in the segment.
Expanding new distribution avenues to drive growth
During FY15, TTKPT added 35 new Prestige Smart Kitchen (PSK) stores and the
count was 365 across 300 towns at the end of June 2015.
Company is exploring ways to increase footfalls at current stores rather than
opening new stores. The focus is to consolidate PSKs, improve SSGs and
throughputs.
New channels have been recently added like television shopping, online
presence and extensive use of large format outlets.
Last year, company started taking services of local organizations/NGOs to scale
up rural presence by selling through them.
A new fulfillment centre for ecommerce has been opened in Hosur and
management plans few more such centres pan India.
Exports on backburner, to show results from 3Q
Japan was the focus for microwave pressure cookers but the same did not scale
up as per expectations, hence de-growth was seen in exports.
TTKPT plans to expand footprints to other parts of the world like USA, Europe
but any kind of meaningful result will be seen only post 3Q.
TTKPT is also exploring brand acquisitions overseas without opening a
manufacturing space there to boost export revenues.
The exports from 100% EOU within Gujarat Complex are expected to commence
later part of the year.
Direct agreements with e-commerce players to avoid channel conflicts
Management highlighted that E-tailing has been active but not as disruptive as
was in FY15.
TTKPT opened its first fulfillment centre at Hosur to cater to growing
ecommerce needs. Company has plans to open more such centres on a pan
India basis to facilitate sales through online channels and lower logistics cost.
TTKPT has independently listed itself as a retailer on ecommerce sites working
as a marketplace player and believes it will be able to provide the whole gamut
of products without impacting prices since they will be similar to those at PSKs.
Accordingly, it has firmed up agreements or in the process of finalization with
most of the leading e-commerce platforms.
4
22 July 2015

TTK Prestige
TTKPT also has its independent website which will enable sale of its products
through the online platform.
During the quarter, online trade registered impressive growth.
Other conference call highlights
The market size last year for pressure cookers was estimated ~14.5m pieces
(both unorganized and organized). The company had ~28% share volume wise
and more than 30% share value wise.
Capacity utilizations stood at 60% in FY15 on an overall basis.
North and West India grew faster than South. In South, Tamil Nadu, Andhra
Pradesh, Karnataka did well while Kerala saw sluggish growth.
During the quarter, TTKPT undertook a VRS scheme in its Hosur Plant and about
15% of the workmen opted for the same which resulted in one-time exceptional
charge of INR37m. Management pointed out that to increase operational
efficiency, focus on ensuring optimum number of people; additional rounds of
VRS can be expected in 2Q and 3Q.
Guidance for FY16: Management refrained from providing guidance FY16 given
uncertain consumer sentiment and demand outlook. It believes whenever a
pickup in demand seen, TTKPT will be the biggest beneficiary considering its
brand value and marketing emphasis.
Lower commodity prices will have a positive impact on margins, however in case
prices decline further, there will pressure to decrease selling prices too.
Valuation and view
We value TTKPT at 32x FY17E EPS of INR140.6 (in line with its 5 year average PE
multiple) and arrive at a price target of INR4,500.
We believe our target multiple is justified, given the following:
Prestige is India’s brand leader in the kitchenware and appliances categories and
commands a ~37% market share in pressure cooker category, 31% market share
in the cookware category and ~10% market share in the appliances category.
Having expanded fixed assets by 8x over last 5 years, TTKPT has ample room to
improve capacity utilization (~60% currently). We believe substitution of imports
with own manufacturing, expected revival of domestic demand as well as
successful tapping of OEM exports strategy will drive utilization rate higher.
With an aim to overcome predatory pricing by e-commerce players and avoid
channel conflicts, TTKPT is in process of direct tie up with e-commerce players to
maintain price discipline. This will ensure channel conflicts are avoided.
We believe the de-growth phase is behind for the company, and with
discretionary spends revival as well as ramp-up of export opportunity, TTK will
post a robust 14% revenue CAGR over FY15-17.
We expect higher capacity utilization to drive significant operating leverage for
TTKPT with margins expanding 280bp over FY15-17, driving 34% PAT CAGR.
Better asset utilization and minimal reinvestment needs should drive strong free
cash flow generation and improved return ratios.
22 July 2015
5

TTK Prestige
Exhibit 7: Price to earnings (one year forward)
60
45
30
15
0
2.1
19.6
PE (x)
Peak(x)
Avg(x)
51.8
Min(x)
Exhibit 8: Price to book (one year forward)
PB (x)
12.0
10.0
35.4
8.0
6.0
4.0
2.0
0.0
0.8
4.6
6.5
Peak(x)
Avg(x)
10.7
Min(x)
Exhibit 9: Robust cash generation
Free Cash Flow (INR m)
1,206
482
49
145
1,214
Exhibit 10: Strong return ratios
RoCE (%)
59
47
27
25
30
22
-911
FY12
FY13
FY14
FY15
FY16E
FY17E
FY12
FY13
FY14
FY15
FY16E
FY17E
Source: MOSL, Company
22 July 2015
6

TTK Prestige
Story in charts: Rules India’s kitchen
Exhibit 11: Significant portfolio expansion
Pressure Cookers & Pans
Gas Stoves
NonStick Cookware
Kitchen Electrical Appliances
Exhibit 12: Strong marketing investments
Ad spend to revenues (%)
4.2%
6.2%
3.5%
9
10
15
59
13
11
15
56
14
10
16
55
17
10
15
53
20
12
17
47
25
10
20
41
31
10
20
36
33
9
18
37
30
13
17
37
27
12
19
38
27
12
20
38
28
11
20
37
Bajaj
Electricals
Source: MOSL, Company
Havells
Hawkins
2.6%
1.6%
V-Guard
TTK Prestige
Source: MOSL, Company
Exhibit 13: Higher penetration through Prestige Smart
Kitchens
Prestige Smart Kitchens (nos)
536 571
279
356
433
650
725
Exhibit 14: Significant capacity expansion
Net Fixed Assets (INR m)
3,396
3,366
3,404
3,421
228
180 173 196
80
1,507
419
FY11
Source: MOSL, Company
FY12
1,681
FY13
FY14
FY15
FY16E
FY17E
Source: MOSL, Company
Exhibit 15: Robust cash generation
Free Cash Flow (INR m)
1,206
482
49
145
1,214
Exhibit 16: Strong return ratios
59
47
27
30
RoCE (%)
22
25
-911
FY12
FY13
FY14
FY15
FY16E
FY17E
FY12
FY13
FY14
FY15
FY16E
FY17E
Source: MOSL, Company
22 July 2015
7

TTK Prestige
Assumption Sheet
Exhibit 17: Key assumptions
Assumptions
Pressure Cookers & Pans
NonStick Cookware
Gas Stoves
Kitchen Electrical Appliances
Total Revenues (INR m)
Pressure Cookers & Pans
NonStick Cookware
Gas Stoves
Kitchen Electrical Appliances
Total Revenue Growth (%)
Pressure Cookers & Pans
NonStick Cookware
Gas Stoves
Kitchen Electrical Appliances
Total Revenue Mix (%)
FY12
4,132
2,247
1,108
3,494
11,034
30%
46%
37%
81%
45%
37%
20%
10%
32%
100%
FY13
5,106
2,449
1,279
4,490
13,585
24%
9%
15%
28%
23%
38%
18%
9%
33%
100%
FY14
4,940
2,270
1,669
3,907
12,938
-3%
-7%
30%
-13%
-5%
38%
18%
13%
30%
100%
FY15
5,440
2,660
1,750
3,900
13,883
10%
17%
5%
0%
7%
39%
19%
13%
28%
100%
FY16E
5,940
3,098
1,925
4,341
15,474
9%
16%
10%
11%
11%
38%
20%
12%
28%
100%
FY17E
6,861
3,741
2,118
5,105
18,014
16%
21%
10%
18%
16%
38%
21%
12%
28%
100%
22 July 2015
8

TTK Prestige
Financials and valuations
Standalone - Income Statement
Y/E March
Net Sales
Change (%)
FY10
5,079
26.6
FY11
7,636
50.3
FY12
11,034
44.5
FY13
13,585
23.1
FY14
12,938
-4.8
FY15
13,883
7.3
(INR Million)
FY16E
15,474
11.5
FY17E
18,014
16.4
EBITDA
Margin (%)
Depreciation
EBIT
Int. and Finance Charges
Other Income - Rec.
PBT bef. EO Exp.
EO Expense/(Income)
PBT after EO Exp.
Current Tax
Deferred Tax
Tax Rate (%)
Reported PAT
PAT Adj for EO items
Change (%)
Margin (%)
774
15.2
36
738
35
11
714
-40
754
230
0
30.5
524
497
122.0
9.8
1,217
15.9
43
1,174
8
43
1,210
6
1,204
365
1
30.4
838
842
69.5
11.0
1,720
15.6
62
1,658
64
31
1,625
0
1,625
463
36
30.7
1,126
1,126
33.8
10.2
2,037
15.0
90
1,947
143
47
1,852
0
1,852
488
33
28.1
1,331
1,331
18.2
9.8
1,602
12.4
148
1,455
85
79
1,448
-70
1,518
295
104
26.3
1,118
1,067
-19.8
8.2
1,492
10.7
190
1,302
45
51
1,309
-24
1,333
351
59
30.7
923
906
-15.0
6.5
1,857
12.0
212
1,645
0
89
1,734
0
1,734
531
0
30.6
1,203
1,203
32.8
7.8
2,432
13.5
227
2,205
0
156
2,362
0
2,362
723
0
30.6
1,639
1,639
36.2
9.1
Standalone - Balance Sheet
Y/E March
Equity Share Capital
Total Reserves
Net Worth
Minority Interest
Deferred Liabilities
Total Loans
Capital Employed
Gross Block
Less: Accum. Deprn.
Net Fixed Assets
Capital WIP
Total Investments
Curr. Assets, Loans&Adv.
Inventory
Account Receivables
Cash and Bank Balance
Loans and Advances
Curr. Liability & Prov.
Account Payables
Provisions
Net Current Assets
Appl. of Funds
FY10
113
1,128
1,242
0
31
255
1,528
835
430
405
235
4
2,081
613
603
440
426
1,197
676
522
884
1,528
FY11
113
1,801
1,915
0
33
382
2,329
892
473
419
495
226
3,115
1,050
747
535
782
1,925
1,063
862
1,189
2,329
FY12
113
2,738
2,851
0
68
597
3,516
2,029
522
1,507
794
4
4,532
1,749
1,060
223
1,499
3,320
1,995
1,325
1,212
3,516
FY13
114
3,841
3,955
0
101
1,145
5,201
2,262
581
1,681
1,401
0
4,825
2,355
1,432
326
712
2,706
2,202
504
2,119
5,201
FY14
117
5,728
5,845
0
205
269
6,319
4,125
729
3,396
243
90
4,988
2,668
1,491
296
533
2,399
2,036
363
2,589
6,319
FY15
117
6,343
6,460
0
260
0
6,720
4,297
931
3,365
264
35
5,294
2,747
1,593
295
659
2,239
1,869
370
3,055
6,720
(INR Million)
FY16E
117
7,165
7,281
0
260
0
7,541
4,547
1,144
3,403
155
35
6,560
2,968
1,696
1,119
777
2,612
2,120
492
3,948
7,541
FY17E
117
8,258
8,375
0
260
0
8,635
4,797
1,370
3,427
180
35
8,136
3,455
1,974
1,788
919
3,144
2,468
676
4,993
8,635
22 July 2015
9

TTK Prestige
Financials and valuations
Ratios
Y/E March
Basic (INR) *
EPS
Cash EPS
BV/Share
DPS
Payout (%)
Valuation (x) *
P/E
Cash P/E
P/BV
EV/Sales
EV/EBITDA
Dividend Yield (%)
Return Ratios (%)
RoE
RoCE
Working Capital Ratios
Asset Turnover (x)
Inventory (Days)
Debtor (Days)
Leverage Ratio (x)
Current Ratio
Debt/Equity
FY10
43.8
47.0
109.6
10.0
25.2
FY11
74.3
78.0
168.9
12.5
19.6
FY12
99.4
104.9
251.6
17.5
20.6
FY13
117.2
125.1
348.3
17.5
17.5
FY14
91.5
104.2
501.5
20.6
24.4
43.4
38.1
7.9
3.7
29.8
0.5
47.6
54.8
3.3
44.0
43
1.7
0.2
53.3
64.2
3.3
50.2
35
1.6
0.2
47.3
58.8
3.1
57.9
34
1.4
0.2
39.1
46.7
2.6
63.3
38
1.8
0.3
21.8
27.3
2.0
75.3
41
2.1
0.0
FY15
77.8
94.1
554.2
22.6
33.4
51.1
42.2
7.2
3.4
31.8
0.6
14.7
21.5
2.1
72.2
41
2.4
0.0
FY16E
103.2
121.5
624.7
28.8
31.7
38.5
32.7
6.4
3.0
25.1
0.7
17.5
25.2
2.1
70.0
39
2.5
0.0
FY17E
140.6
160.1
718.6
41.1
33.3
28.2
24.8
5.5
2.6
18.9
1.0
20.9
30.2
2.1
70.0
39
2.6
0.0
Standalone - Cash Flow Statement
Y/E March
Net P/L Before Tax & EO Items
Depreciation
Interest & Finance Charges
Direct Taxes Paid
(Inc)/Dec in WC
CF from Operations
(inc)/dec in FA
(Pur)/Sale of Investments
CF from Investments
Issue of Shares
(Inc)/Dec in Debt
Interest Paid
Dividend Paid
CF from Fin. Activity
Inc/Dec of Cash
Add: Beginning Balance
Closing Balance
FY10
714
36
11
231
97
628
-40
0
-29
0
-179
-12
-66
-257
331
109
440
FY11
1,204
44
8
351
-123
781
-318
-222
-502
0
0
-13
-132
-145
96
440
535
FY12
1,632
64
56
468
-647
637
-1,523
222
-1,277
0
575
-57
-164
353
-312
535
223
FY13
1,852
90
147
324
-760
1,005
-924
0
-892
0
365
-148
-197
19
100
223
323
FY14
1,518
148
85
471
-367
912
-705
-90
-733
1,053
-881
-86
-232
-147
-30
326
296
FY15
1,333
190
45
373
-473
721
-193
55
-90
0
-250
-64
-272
-586
-1
296
295
(INR Million)
FY16E
1,734
212
0
531
-69
1,346
-141
0
-141
0
0
0
-382
-382
824
295
1,119
FY17E
2,362
227
0
723
-376
1,490
-275
0
-275
0
0
0
-545
-545
669
1,119
1,788
22 July 2015
10

TTK Prestige
Corporate profile: TTK Prestige
Company description
Prestige is India’s brand leader in the kitchenware
and appliances categories and commands a ~37%
market share in pressure cooker category, 31%
market share in the cookware category and ~10%
market share in the appliances category. It
commands 14% share in the INR90b kitchenware
industry. It derives 39% of sales coming pressure
cookers, 19% of the revenue from non-stick
cookware, 28% from kitchen electric appliances,
13% from gas stoves and the balance from other
products.
Exhibit 18: Sensex rebased
Exhibit 19: Shareholding pattern (%)
Jun-15
Promoter
DII
FII
Others
70.4
5.1
16.9
7.7
Mar-15
70.4
6.1
14.8
8.7
Jun-14
70.4
2.4
21.0
6.2
Exhibit 20: Top holders
Holder Name
Axis Mutual Fund Trustee Ltd A/c Axis Mutual Fund
Nalanda India Equity Fund Ltd
Copthall Mauritius Investment Ltd
T Rowe Price International Discovery Fund
Smaller Companes Portfolio of Genesis Emerging
% Holding
4.0
3.5
2.5
2.1
1.7
Note: FII Includes depository receipts
Exhibit 21: Top management
Name
T T Raghunathan
T T Jagannathan
Chandru Kalro
Designation
Vice Chairman
Executive Chairman
Managing Director
Exhibit 22: Directors
Name
Latha Jagannathan
R Srinivasan*
Vandana R Walvekar*
*Independent
Name
Arun K Thiagarajan*
Dileep Kumar Krishnaswamy*
Exhibit 23: Auditors
Name
S Viswanathan
Type
Statutory
Exhibit 24: MOSL forecast v/s consensus
EPS
(INR)
FY16
FY17
MOSL
forecast
103.2
140.6
Consensus
forecast
110.0
147.1
Variation
(%)
-6.2
-4.4
22 July 2015
11

This document has been prepared by Motilal Oswal Securities Limited (hereinafter referred to as Most) to provide information about the company(ies) and/sector(s), if any, covered in the report and may be distributed
TTK Prestige
by it and/or its affiliated company(ies). This report is for personal information of the selected recipient/s and does not construe to be any investment, legal or taxation advice to you. This research report does not
constitute an offer, invitation or inducement to invest in securities or other investments and Motilal Oswal Securities Limited (hereinafter referred as MOSt) is not soliciting any action based upon it. This report is not for
public distribution and has been furnished to you solely for your general information and should not be reproduced or redistributed to any other person in any form. This report does not constitute a personal
recommendation or take into account the particular investment objectives, financial situations, or needs of individual clients. Before acting on any advice or recommendation in this material, investors should consider
whether it is suitable for their particular circumstances and, if necessary, seek professional advice. The price and value of the investments referred to in this material and the income from them may go down as well as
up, and investors may realize losses on any investments. Past performance is not a guide for future performance, future returns are not guaranteed and a loss of original capital may occur.
MOSt and its affiliates are a full-service, integrated investment banking, investment management, brokerage and financing group. We and our affiliates have investment banking and other business relationships with a
some companies covered by our Research Department. Our research professionals may provide input into our investment banking and other business selection processes. Investors should assume that MOSt and/or
its affiliates are seeking or will seek investment banking or other business from the company or companies that are the subject of this material and that the research professionals who were involved in preparing this
material may educate investors on investments in such business. The research professionals responsible for the preparation of this document may interact with trading desk personnel, sales personnel and other
parties for the purpose of gathering, applying and interpreting information. Our research professionals are paid on the profitability of MOSt which may include earnings from investment banking and other business.
MOSt generally prohibits its analysts, persons reporting to analysts, and members of their households from maintaining a financial interest in the securities or derivatives of any companies that the analysts cover.
Additionally, MOSt generally prohibits its analysts and persons reporting to analysts from serving as an officer, director, or advisory board member of any companies that the analysts cover. Our salespeople, traders,
and other professionals or affiliates may provide oral or written market commentary or trading strategies to our clients that reflect opinions that are contrary to the opinions expressed herein, and our proprietary
trading and investing businesses may make investment decisions that are inconsistent with the recommendations expressed herein. In reviewing these materials, you should be aware that any or all of the foregoing
among other things, may give rise to real or potential conflicts of interest. MOSt and its affiliated company(ies), their directors and employees and their relatives may; (a) from time to time, have a long or short position
in, act as principal in, and buy or sell the securities or derivatives thereof of companies mentioned herein. (b) be engaged in any other transaction involving such securities and earn brokerage or other compensation
or act as a market maker in the financial instruments of the company(ies) discussed herein or act as an advisor or lender/borrower to such company(ies) or may have any other potential conflict of interests with
respect to any recommendation and other related information and opinions.; however the same shall have no bearing whatsoever on the specific recommendations made by the analyst(s), as the recommendations
made by the analyst(s) are completely independent of the views of the affiliates of MOSt even though there might exist an inherent conflict of interest in some of the stocks mentioned in the research report
Reports based on technical and derivative analysis center on studying charts company's price movement, outstanding positions and trading volume, as opposed to focusing on a company's fundamentals and, as
such, may not match with a report on a company's fundamental analysis. In addition MOST has different business segments / Divisions with independent research separated by Chinese walls catering to different set
of customers having various objectives, risk profiles, investment horizon, etc, and therefore may at times have different contrary views on stocks sectors and markets.
Unauthorized disclosure, use, dissemination or copying (either whole or partial) of this information, is prohibited. The person accessing this information specifically agrees to exempt MOSt or any of its affiliates or
employees from, any and all responsibility/liability arising from such misuse and agrees not to hold MOSt or any of its affiliates or employees responsible for any such misuse and further agrees to hold MOSt or any of
its affiliates or employees free and harmless from all losses, costs, damages, expenses that may be suffered by the person accessing this information due to any errors and delays. The information contained herein is
based on publicly available data or other sources believed to be reliable. Any statements contained in this report attributed to a third party represent MOSt’s interpretation of the data, information and/or opinions
provided by that third party either publicly or through a subscription service, and such use and interpretation have not been reviewed by the third party. This Report is not intended to be a complete statement or
summary of the securities, markets or developments referred to in the document. While we would endeavor to update the information herein on reasonable basis, MOSt and/or its affiliates are under no obligation to
update the information. Also there may be regulatory, compliance, or other reasons that may prevent MOSt and/or its affiliates from doing so. MOSt or any of its affiliates or employees shall not be in any way
responsible and liable for any loss or damage that may arise to any person from any inadvertent error in the information contained in this report. MOSt or any of its affiliates or employees do not provide, at any time,
any express or implied warranty of any kind, regarding any matter pertaining to this report, including without limitation the implied warranties of merchantability, fitness for a particular purpose, and non-infringement.
The recipients of this report should rely on their own investigations.
This report is intended for distribution to institutional investors. Recipients who are not institutional investors should seek advice of their independent financial advisor prior to taking any investment decision based on
this report or for any necessary explanation of its contents.
Most and it’s associates may have managed or co-managed public offering of securities, may have received compensation for investment banking or merchant banking or brokerage services, may have received any
compensation for products or services other than investment banking or merchant banking or brokerage services from the subject company in the past 12 months.
Most and it’s associates have not received any compensation or other benefits from the subject company or third party in connection with the research report.
Subject Company may have been a client of Most or its associates during twelve months preceding the date of distribution of the research report
MOSt and/or its affiliates and/or employees may have interests/positions, financial or otherwise of over 1 % at the end of the month immediately preceding the date of publication of the research in the securities
mentioned in this report. To enhance transparency, MOSt has incorporated a Disclosure of Interest Statement in this document. This should, however, not be treated as endorsement of the views expressed in the
report.
Motilal Oswal Securities Limited is registered as a Research Analyst under SEBI (Research Analyst) Regulations, 2014. SEBI Reg. No. INH000000412
There are no material disciplinary action that been taken by any regulatory authority impacting equity research analysis activities
Analyst Certification
The views expressed in this research report accurately reflect the personal views of the analyst(s) about the subject securities or issues, and no part of the compensation of the research analyst(s) was, is, or will be
directly or indirectly related to the specific recommendations and views expressed by research analyst(s) in this report. The research analysts, strategists, or research associates principally responsible for preparation
of MOSt research receive compensation based upon various factors, including quality of research, investor client feedback, stock picking, competitive factors and firm revenues
Disclosure of Interest Statement
Analyst ownership of the stock
Served as an officer, director or employee
TTK PRESTIGE
No
No
Disclosures
A graph of daily closing prices of securities is available at www.nseindia.com and http://economictimes.indiatimes.com/markets/stocks/stock-quotes
Regional Disclosures (outside India)
For U.S.
This report is not directed or intended for distribution to or use by any person or entity resident in a state, country or any jurisdiction, where such distribution, publication, availability or use would be contrary to law,
regulation or which would subject MOSt & its group companies to registration or licensing requirements within such jurisdictions.
Motilal Oswal Securities Limited (MOSL) is not a registered broker - dealer under the U.S. Securities Exchange Act of 1934, as amended (the"1934 act") and under applicable state laws in the United States. In
addition MOSL is not a registered investment adviser under the U.S. Investment Advisers Act of 1940, as amended (the "Advisers Act" and together with the 1934 Act, the "Acts), and under applicable state laws in the
United States. Accordingly, in the absence of specific exemption under the Acts, any brokerage and investment services provided by MOSL, including the products and services described herein are not available to or
intended for U.S. persons.
This report is intended for distribution only to "Major Institutional Investors" as defined by Rule 15a-6(b)(4) of the Exchange Act and interpretations thereof by SEC (henceforth referred to as "major institutional
investors"). This document must not be acted on or relied on by persons who are not major institutional investors. Any investment or investment activity to which this document relates is only available to major
institutional investors and will be engaged in only with major institutional investors. In reliance on the exemption from registration provided by Rule 15a-6 of the U.S. Securities Exchange Act of 1934, as amended (the
"Exchange Act") and interpretations thereof by the U.S. Securities and Exchange Commission ("SEC") in order to conduct business with Institutional Investors based in the U.S., MOSL has entered into a chaperoning
agreement with a U.S. registered broker-dealer, Motilal Oswal Securities International Private Limited. ("MOSIPL"). Any business interaction pursuant to this report will have to be executed within the provisions of this
chaperoning agreement.
The Research Analysts contributing to the report may not be registered /qualified as research analyst with FINRA. Such research analyst may not be associated persons of the U.S. registered broker-dealer, MOSIPL,
and therefore, may not be subject to NASD rule 2711 and NYSE Rule 472 restrictions on communication with a subject company, public appearances and trading securities held by a research analyst account.
Motilal Oswal Capital Markets Singapore Pte Limited is acting as an exempt financial advisor under section 23(1)(f) of the Financial Advisers Act(FAA) read with regulation 17(1)(d) of the Financial Advisors
Regulations and is a subsidiary of Motilal Oswal Securities Limited in India. This research is distributed in Singapore by Motilal Oswal Capital Markets Singapore Pte Limited and it is only directed in Singapore to
accredited investors, as defined in the Financial Advisers Regulations and the Securities and Futures Act (Chapter 289), as amended from time to time.
In respect of any matter arising from or in connection with the research you could contact the following representatives of Motilal Oswal Capital Markets Singapore Pte Limited:
Kadambari Balachandran
Email : kadambari.balachandran@motilaloswal.com
Contact : (+65) 68189233 / 65249115
Office Address : 21 (Suite 31),16 Collyer Quay,Singapore 04931
For Singapore
Motilal Oswal Securities Ltd
22 July 2015
Motilal Oswal Tower, Level 9, Sayani Road, Prabhadevi, Mumbai 400 025
Phone: +91 22 3982 5500 E-mail: reports@motilaloswal.com
12