28 July 2015
1QFY16 Results Update | Sector: Technology
Info Edge (India)
BSE SENSEX
27,561
Bloomberg
Equity Shares (m)
M.Cap. (INR b) / (USD b)
52-Week Range (INR)
1, 6, 12 Rel. Per (%)
Avg Val (INRm)/Vol ‘000
Free float (%)
S&P CNX
8,361
INFOE IN
120.2
97.3/1.6
1015 / 689
2/20/23
139/168
56.3
CMP: INR887
TP: INR1,050 (+19%)
Buy
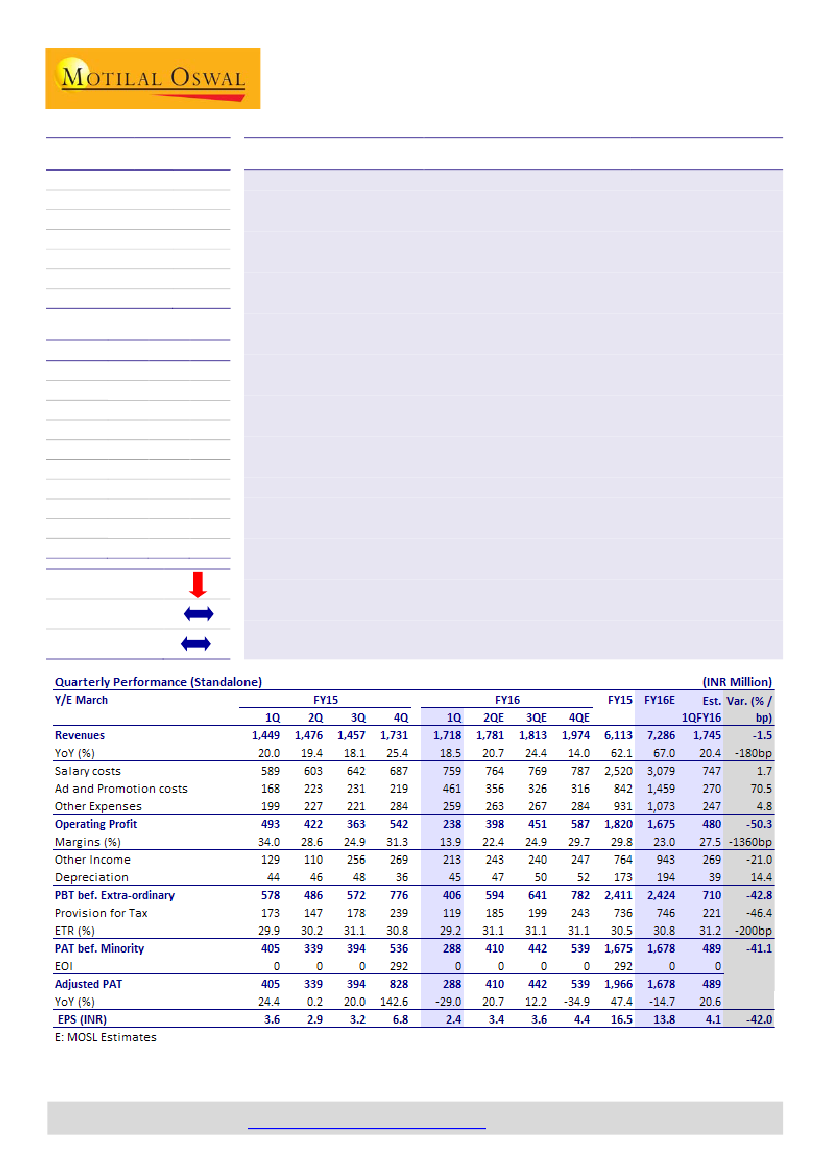
Burn in 99acres.com drives sharp miss in profitability
Competitive intensity in online real estate portals take toll:
INFOE’s advertising
expenses in 1QFY16 shot up to INR461m, or 27% of revenues (v/s estimate of
15.5%), compared to 13.8% in FY15, driving plummet in EBITDA margin to 14%,
compared to estimate of 27.6%. Consequently, standalone PAT came at
INR287.5m, drop of 28% YoY, sharply below our estimate of INR491m.
Real estate remains soft, momentum in other segments intact:
INFOE’s 1QFY16
revenue at INR1.72b grew 18.5% YoY, in line with our estimate of INR1.74b.
Revenues in recruitment segment (naukri.com) grew 20% YoY to INR1.25b,
marginally below our estimate of INR1.275b. 99acres.com posted revenues of
INR252.8m, +10% YoY, below our estimate of INR282.6m
Outlook on businesses:
Growth in
recruitment
portal may have been impacted
by higher collections in the previous quarter. That, and pick up in non-IT
segments could drive improvement in recruitment segment’s revenue growth.
99acres.com
revenues are impacted mainly in the Delhi/NCR region, while other
regions continue to grow. Ad spends will remain responsive to competitive
intensity. Intensity has been lower in June.
Zomato’s
early results from pilot in
food ordering are encouraging.
Valuation view:
We have cut our standalone earnings in FY16 by 16% on the
back of higher ad spends in 99acres.com. INFOE’s strategy of matching
aggression to sustain traffic and listings share is the imperative in our view. We
see Naukri.com, 99acres.com and Zomato.com as the key drivers of valuation at
INFO. Our SOTP price target of INR1050 implies 18% upside. Maintain
Buy.
Financials & valuation (INR b) SA
Y/E Mar
Sales
PAT
EPS (INR)
EPS Gr. (%)
BV/Sh.INR
RoE (%)
RoCE (%)
P/E (x)
EV/EBITDA
( )
EV/Sales (x)
2015 2016E 2017E
6.1
7.3
8.7
1.9
13.7
16.4
13.6
13.6
59.6
49.2
14.7
1.7
13.8
1.0
9.8
8.6
59.1
52.8
12.1
2.3
19.3
39.7
12.7
12.5
42.3
33.9
10.0
138.3 146.1 158.9
Estimate change (%)
16/4
TP change
Rating change
Ashish Chopra
(Ashish.Chopra@MotilalOswal.com); +91 22 3982 5424
Investors are advised to refer through disclosures made at the end of the Research Report.
Motilal Oswal research is available on
www.motilaloswal.com/Institutional-Equities,
Bloomberg, Thomson Reuters, Factset and S&P Capital.