28 July 2015
1QFY16 Results Update | Sector:
Capital Goods
Thermax
BSE SENSEX
27,459
Bloomberg
Equity Shares (m)
52-Week Range (INR)
1, 6, 12 Rel. Per (%)
Avg Val (INRm)/Vol ‘000
Free float (%)
S&P CNX
8,337
TMX IN
119.2
1,315/790
0/0/11
60/58
38.0
n
CMP: INR1,035
n
TP: INR1,275 (+23%)
Buy
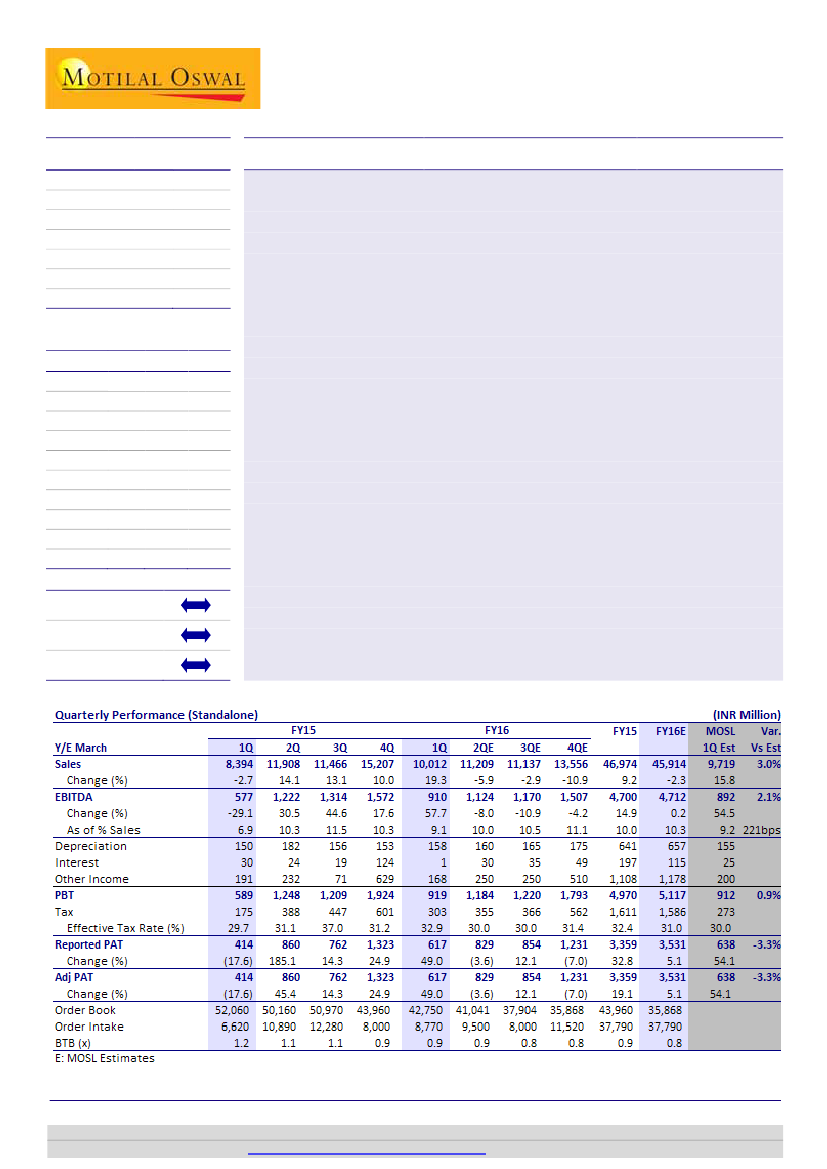
Operating performance in-line; intake remains constrained
TMX reported in-line operating performance for 1QFY16. Revenue grew 19% YoY
to INR10b, EBITDA margin expanded 221bp YoY to 9.1%, and net profit grew 49%
YoY to INR617m. Consolidated revenue grew 23.9% YoY to INR12.5b; net profit
grew 234% YoY to INR578m.
The Energy segment reported 25% YoY revenue growth, led by execution of the
Reliance order. The Environment business reported revenue decline of 1.8% YoY,
impacted by constrained intake in the Water segment. EBIT margin in the Energy
business expanded 440bp YoY to 11%. Environment segment EBIT margin
expanded 190bp YoY to 6.4%, largely supported by base effect. Energy segment
margins were impacted, as the Reliance project had not crossed the margin
recognition threshold; Environment segment margins were impacted by losses in
water projects in 1QFY15.
Subsidiary losses
narrowed to just INR39m, the lowest since 3QFY14. This
indicates that losses pertaining to European business have been curtailed and that
execution has possibly improved in Thermax-Babcock JV (received orders of
INR6b+ from Babcock & Wilcox overseas wins).
Standalone
order inflow
in 1QFY16 was just ~INR9b. Domestic intake has
remained constrained at just INR7b-8b in the last 6-7 quarters, reflecting that
activity on the ground is yet to pick up. The order book has shrunk 18% YoY.
M.Cap. (INR b) / (USD b) 123.3/1.9
Financials & Valuation (INR Billion)
Y/E Mar
Net Sales
EBITDA
Adj PAT
EPS (INR)
EPS Gr. (%)
RoE (%)
RoCE (%)
P/E (X)
P/BV (X)
2015 2016E 2017E
53.4
4.6
2.6
21.8
-6.0
12.1
16.3
44.1
5.4
59.7
5.2
3.3
28.1
29.2
194.1
14.5
18.0
36.8
5.3
67.6
6.6
4.4
37.3
32.8
214.6
17.4
21.5
27.7
4.8
n
n
BV/Sh.(INR) 179.3
Estimate change
TP change
Rating change
Valuation and outlook:
We maintain
Buy
with a target price of INR1,275 (30x FY17E
EPS plus INR141/share for subsidiaries).
Satyam Agarwal
(AgarwalS@MotilalOswal.com); +91 22 3982 5410
Amit Shah
(Amit.Shah@MotilalOswal.com); +91 22 3029 5126
Investors are advised to refer through disclosures made at the end of the Research Report.
Motilal Oswal research is available on
www.motilaloswal.com/Institutional-Equities,
Bloomberg, Thomson Reuters, Factset and S&P Capital.

Thermax
Operational performance below expectations
n
n
n
n
n
n
TMX 1QFY16 operating performance is in-line, with revenues at INR10b, up 19%
YoY (estimate of INR9.7b) and EBIDTA margins at 9.1%, up 221bps YoY (in-line
with estimates of 9.2%). Net profit at INR617m (up 49% YoY) is in-line with
estimates.
Energy segment reported strong revenue growth at 25%, led by execution of the
Reliance order; while Environment business reported revenue decline of 1.8%
YoY (impacted by constrained intake in water segment).
EBIT margins in energy business have increased to 11% (up 440bps YoY),
environment segment EBIT margins stood at 6.4% (up 190bps YoY). The margin
expansion has been a function of the base effect: Energy segment margins in
1QFY15 were impacted as Reliance order had not crossed the margin
recognition threshold; while Environment segment margins were impacted by
losses in water projects in 1QFY15. As these factors have normalized, the
reported margins have shown a sharp uptick.
Cost analysis for 1QFY16 indicates that RM costs stand at 63.4% (up 190bps
YoY); Other expenses at 16.4% are down 300 bps YoY.
Subsidiary losses have narrowed to just INR39m, and is the lowest run-rate since
3QFY14. These clearly indicate that losses pertaining to European business have
been curtailed; and also possibly improved execution in Thermax-Babcock JV
(received orders of INR6b+ from Babcock & Wilcox overseas wins).
Consolidated revenues stood at INR12.5b (up 23.9% YoY) and profits at
INR578m (up 234% YoY).
Exhibit 2: EBITDA margins at 9.1% are in-line, supported by
base effect
EBITDA (INR m)
EBITDA Margin (%)
Exhibit 1: Standalone Revenues up 19% YoY, led by
strong execution of Reliance order
Revenues (INR b)
Revenue Growth (%) RHS
Source: MOSL, Company
Exhibit 3: EBIT margins improvement supported by base effect
2QFY14 3QFY14 4QFY14 1QFY15 2QFY15 3QFY15 4QFY15 1QFY16
Revenues (INR m)
Energy
Environment
Total
EBIT Margin (%)
Energy
Environment
Total
7,851
2,684
10,535
7,671
2,538
10,209
10,968
2,978
13,946
6,446
2,148
8,594
9,562
2,646
12,208
9,208
2,641
11,849
12,518
3,300
15,819
8,039
2,108
10,148
11.7
9.0
11.0
10.9
2.3
8.7
11.2
2.6
9.4
6.5
4.6
6.1
12.2
7.5
11.1
11.5
11.2
11.0
7.3
8.3
6.4
10.5
10.6
10.0
Source: MOSL, Company
28 July 2015
2

Thermax
Exhibit 4: Cost composition
INR m
Raw Materials
Staff Costs
Other Expenses
Total
% of Revenues
Raw Materials
Staff Costs
Other Expenses
% YoY
Raw Materials
Staff Costs
Other Expenses
2QFY14
6,717
1,008
1,772
9,496
3QFY14
6,803
1,039
1,387
9,229
4QFY14
9,102
1,189
2,196
12,486
1QFY15
5,158
1,027
1,632
7,817
2QFY15 3QFY15 4QFY15 1QFY16
7,750
7,402 10,111
6,346
1,137
1,078
1,260
1,111
1,798
1,672
2,263
1,645
10,685 10,152 13,634
9,102
64.4
9.7
17.0
67.1
10.2
13.7
65.8
8.6
15.9
61.4
12.2
19.4
65.1
9.6
15.1
64.6
9.4
14.6
66.5
8.3
14.9
63.4
11.1
16.4
(18)
(5)
19
(3)
6
0
(9)
10
15
3
4
(9)
15
13
1
9
11
23
4
6
8
20
3
1
Source: MOSL, Company
Order intake remains constrained; standalone order book down 18% YoY
n
n
n
n
Standalone Order inflow in 1QFY16 stood at just ~INR9b, and is lower than the
average run-rate at INR10b over the last seven quarters. Order intake is being
supported by standard products in domestic market and project orders in
international market.
Domestic intake has remained constrained at run-rate of just ~INR7-8b in last 6-
7 quarters, reflecting that activity on the ground is yet to pick-up. During 2Q-
3QFY15, standalone intake averaged at INR11-12b/quarter supported by CPP
order wins from Africa of INR6.7b. As there were no large sized overseas project
wins in 1QFY16, intake was impacted.
In domestic market, we understand that barring standard products, there were
no major orders concluded in core segments like oil and gas, power, cement and
steel. Even for 2QFY16, domestic intake outlook from large projects remains
elusive; while demand scenario for mid to smaller sized projects remains stable.
For overseas projects, the supplies are against LCs. Margins in international
projects are similar to domestic margins. Middle East remains constrained given
the sharp decline in crude prices.
Exhibit 6: 1QFY16 order inflows constrained
Standalone order intake
1QFY14 incl
INR13.5b RIL order
Exhibit 5: Stand alone BTB ratio at 0.9x
Order Backlog (INR b)
BTB (x TTM)
Source: MOSL, Company
28 July 2015
3

Thermax
Subsidiary performance (adjusted) shows improvement
n
n
For 1QFY16, subsidiaries reported revenues of INR2.5b, up 46% YoY and PAT
loss of just INR395m, vs INR241m YoY.
Subsidiary losses have narrowed to just INR39m, and is the lowest run-rate since
3QFY14. These clearly indicate that losses pertaining to European business have
been curtailed; and also possibly improved execution in Thermax-Babcock JV
(received orders of INR6b+ from Babcock & Wilcox overseas wins).
Exhibit 7: Subsidiaries continue to report losses (INR M)
2QFY14
Consolidated
Total Income
Growth YoY %
PBT
PAT
Growth YoY %
12,331
(11.7)
946
353
(59.6)
3QFY14
12,175
(2.3)
884
623
(17.7)
4QFY14
15,976
(4.9)
1,313
955
(8.7)
1QFY15
10,101
(4.0)
203
173
(67.3)
2QFY15
13,696
11.1
643
369
4.5
3QFY15
13,101
7.6
873
577
(7.3)
4QFY15 1QFY16
17,058
6.8
1,471
979
2.5
12,518
23.9
757
578
233.7
Exhibit 8:
Subsidiaries
performance (Derived, INR m)
Total Income
Growth YoY %
PBT
PAT
2QFY14
1,898
(6.7)
93
51
3QFY14
2,037
2.3
(83)
(44)
4QFY14
2,151
1.6
(190)
(104)
1QFY15
1,706
(9.6)
(386)
(241)
2QFY15
1,788
(5.8)
(605)
(491)
3QFY15 4QFY15 1QFY16
1,635
1,852
2,506
(19.7)
(13.9)
46.9
(336)
(454)
(163)
(185)
(345)
(39)
Source: MOSL, Company
28 July 2015
4

Thermax
Maintain Buy; core portfolio holding
Strong commitment to the core ‘Strategy’ and the journey till date has improved the
investor perception about ‘sustainable superior performance’ and hence premium
valuations. Maintain
Buy
with a 12-month price target of INR1,275 (30x FY17E at
INR1,117/sh and INR141/sh for subsidiaries). Premium valuations are supported by:
i) Expectations of strong 43% earnings CAGR over the next five years, ii) robust FY15
RoCE at 16.3% (in a downcycle), iii) FY15 net working capital at just eight days
(reflecting the bargaining power of the business) and net cash at INR6.2b (up from
INR4.2b in FY14).
Well prepared to capitalize on domestic and global recovery
n
n
n
TMX has created capacities both in terms of manufacturing and manpower, and
is thus prepared to capitalize on the recovery in the investment climate. We
understand that the current capacity utilization in standalone business stands at
80%; excluding the increased levels of in-sourcing, it stands at 65% (as in an
upturn, parts of the manufacturing can be outsourced).
Key factories commissioned in the last few years include chemicals (FY12, at
Jhagadia), air pollution control (FY13, at Solapur) and TMX-Babcock (TBW)
supercritical boiler capacity (~3GW, at Shirwal). TMX has also set up ~0.25msf of
office space as ‘Energy House’ and ‘Environment House’ to house the various
businesses; these modern offices will strengthen the company’s positioning as a
knowledge-driven company. The company is currently working on a capex
program of ~INR4b, comprising manufacturing facility in Indonesia and
chemicals business in India.
Danstoker acquired a boiler manufacturing facility in Denmark on a slump sale
basis; the acquisition was financed by the retained earnings of Danstoker and
the facility is 150kms away from the existing manufacturing plant. In the existing
plant, the capacity utilization was running at optimum levels and land was an
important constraint. Fabrication work has already commenced at the new
facility.
Exhibit 10: Consolidated net cash at comfortable levels
(INR m)
Consolidated Net Cash/ (debt)
Exhibit 9: RoEs impacted, given the underutilization of fixed
assets
Gross Fixed Assets + CWIP (INR M)
33 38
14 17 16
22
29
28
ROE (%)
24
24
17
17 13
12 14
Source: MOSL, Company
28 July 2015
5

Thermax
Key operating metrics
Exhibit 11: Key operating metrics (INR m)
INR m
Standalone Order intake
Energy
- Power EPC
- Energy Ex Power EPC
Environment
Order intake (% YoY)
Energy
- Power EPC
- Energy Ex Power EPC
Environment
Standalone Revenues
Domestic (excl Power EPC)
Domestic (Power EPC)
Exports (Excl Deemed)
% YoY
Domestic (excl Power EPC)
Domestic (Power EPC)
Exports
EBIT Margin (%)
Energy
Environment
EPS Composition (INR/Sh)
Standalone
TMX-Babcock JV
Other Subsidiaries
Consolidated
Balance Sheet Details - Standalone
Core Net Working Capital (Days)
Net Working Capital (Days)
Net Cash / (Debt) INR M
RoE (%) Consolidated
FY11
53,180
41,736
15,300
26,436
11,444
-8.3%
-10.0%
-28.5%
5.8%
-1.2%
50,235
25,350
14,225
10,660
54.5%
25.9%
144.0%
62.5%
11.8
10.0
12.6
FY12
40,300
28,830
5,169
23,661
11,470
-24.2%
-30.9%
-66.2%
-10.5%
0.2%
54,360
29,073
13,857
11,430
8.2%
14.7%
-2.6%
7.2%
11.1
10.7
12.4
FY13
48,580
36,550
15,020
21,530
12,030
20.5%
26.8%
190.6%
-9.0%
4.9%
47,693
29,202
8,652
9,839
-12.3%
0.4%
-37.6%
-13.9%
11.0
10.4
10.5
FY14
53,940
46,010
2,800
43,210
7,930
11.0%
25.9%
-81.4%
100.7%
-34.1%
43,022
25,150
6,862
11,010
-9.8%
-13.9%
-20.7%
11.9%
9.7
11.3
5.8
FY15
39,510
29,560
6,720
22,840
9,950
-26.8%
-35.8%
140.0%
-47.1%
25.5%
46,974
32,141
3,913
10,920
9.2%
27.8%
-43.0%
-0.8%
10.1
10.7
8.3
FY16E
46,849
34,909
6,500
28,409
11,940
18.6%
18.1%
-3.3%
24.4%
20.0%
46,749
26,073
9,021
11,655
-0.5%
-18.9%
130.5%
6.7%
10.4
11.0
9.5
FY17E
60,784
47,338
10,000
37,338
13,446
29.7%
35.6%
53.8%
31.4%
12.6%
52,639
31,871
7,365
13,403
12.6%
22.2%
-18%
15.0%
11.1
11.5
10.5
32.1
0.0
-0.1
32.0
34.1
-0.8
0.5
33.9
29.4
-1.3
-1.2
26.9
23.7
-2.3
1.8
23.1
28.2
-5.3
-1.2
21.8
29.6
-3.8
2.2
28.1
37.2
-1.8
1.9
37.3
42.1
-11.9
6,910.2
28.4
27.8
6.6
6,050.3
24.2
31.8
18.5
6,205.7
16.8
57.8
12.8
7,642.7
13.3
40.5
12.0
9,735.5
12.1
41.1
35.6
9.3
-8.0
10,855.1
14,143.0
14.5
17.4
Source: Company, MOSL
28 July 2015
6

Thermax
Financials and valuations
Income Statement
Y/E March
Total Revenues
Change (%)
Raw Materials
Staff Cost
Other Expenses
EBITDA
% of Total Revenues
Depreciation
Other Income
Interest
PBT
Tax
Rate (%)
Adjusted PAT
EO Income (net)
Reported PAT
Change (%)
2011
52,472
60.3
34,803
4,547
8,266
5,669
10.8
541
652
45
5,736
1,965
34.3
3,818
0
3,818
169.0
2012
60,313
14.9
38,435
5,578
10,795
5,919
9.8
663
830
122
5,964
2,043
34.3
4,034
0
4,034
5.7
2013
54,331
-9.9
33,157
6,123
10,736
4,982
9.2
771
769
165
4,814
1,773
36.8
3,202
0
3,202
-20.6
2014
50,283
-7.4
28,616
7,019
10,991
4,381
8.7
922
716
274
3,901
1,696
43.5
2,758
0
2,468
-22.9
2015
53,396
6.2
31,377
7,057
10,886
4,635
8.7
1,341
1,209
820
3,683
1,711
46.5
2,592
-494
2,098
-15.0
2016E
59,714
11.8
32,575
7,637
14,851
5,214
8.7
1,287
1,268
615
4,580
1,661
36.3
3,350
0
3,350
59.7
(INR Million)
2017E
67,583
13.2
36,620
9,028
15,912
6,642
9.8
1,361
1,431
600
6,112
1,863
30.5
4,450
0
4,450
32.8
Balance Sheet
Y/E March
Share Capital
Reserves
Net Worth
Loans
Deferred Tax Liability
Capital Employed
Gross Fixed Assets
Less: Depreciation
Net Fixed Assets
Capital WIP
Investments
Curr. Assets
Inventory
Debtors
Cash & Bank Balance
Loans & Advances
Other Assets
Current Liab. & Prov.
Creditors
Other Liabilities
Provisions
Net Current Assets
Application of Funds
E: MOSL Estimates
2011
238
12,911
13,448
1,480
299
15,448
10,678
2,825
7,853
354
2,415
30,370
3,657
10,209
6,880
4,015
5,610
2012
238
16,055
16,671
2,704
378
20,491
11,929
3,488
8,441
2,466
2,395
33,427
3,666
13,707
6,983
3,560
5,512
2013
238
18,449
19,070
4,210
383
24,382
12,962
4,236
8,726
5,175
4,430
31,544
3,240
15,468
3,211
4,125
5,501
2014
238
20,145
20,701
7,387
318
29,484
20,441
5,183
15,258
537
7,079
36,540
4,158
14,685
4,508
4,270
8,919
2015
238
21,226
21,360
5,534
-104
27,675
20,510
6,198
14,312
429
8,217
35,221
3,413
16,730
3,494
4,820
6,764
2016E
238
22,998
23,133
5,442
-104
28,924
22,039
7,485
14,554
400
8,217
37,553
2,986
14,929
2,314
5,382
11,943
(INR Million)
2017E
238
25,440
25,575
5,442
-104
31,165
24,539
8,846
15,693
400
8,217
43,551
3,379
14,192
6,766
5,697
13,517
8,928
3,184
2,782
4,825
15,448
9,690
5,323
2,721
7,190
20,491
9,723
5,275
2,812
6,051
24,382
9,319
6,815
2,668
6,603
29,477
9,492
7,040
3,200
4,716
27,674
11,943
7,453
3,574
5,753
28,924
13,517
8,398
4,039
6,855
31,165
28 July 2015
7

Thermax
Financials and valuations
Ratios
Y/E March
Basic (INR)
EPS
Cash EPS
Book Value
DPS
Payout (incl. Div. Tax.)
Valuation (x)
P/E
Cash P/E
EV/EBITDA
EV/Sales
Price/Book Value
Dividend Yield (%)
Profitability Ratios (%)
RoE
RoCE
Turnover Ratios
Debtors (Days)
Inventory (Days)
Creditors. (Days)
Asset Turnover (x)
Leverage Ratio
Debt/Equity (x)
2011
32.0
36.6
112.9
9.0
32.6
2012
33.9
39.4
139.9
7.0
24.0
2013
26.9
33.3
160.0
7.0
30.5
2014
23.1
30.9
173.7
6.0
33.9
27.0
20.2
16.0
1.4
3.6
1.0
28.4
37.4
71
25
62
3.4
0.1
24.2
29.7
83
22
59
2.9
0.2
16.8
20.4
104
22
65
2.2
0.2
13.3
14.2
107
30
68
1.7
0.4
2015
21.8
33.0
179.3
7.0
47.9
44.1
29.1
23.3
2.0
5.4
0.7
12.1
16.3
114
23
65
1.9
0.3
2016E
28.1
38.9
194.1
11.0
47.1
36.8
26.6
22.7
2.0
5.3
1.1
14.5
18.0
91
18
73
2.1
0.2
2017E
37.3
48.8
214.6
14.0
45.1
27.7
21.2
17.1
1.7
4.8
1.4
17.4
21.5
77
18
73
2.2
0.2
Cash Flow Statement
Y/E March
PBT before EO Items
Add : Depreciation
Interest
Less : Direct Taxes Paid
(Inc)/Dec in WC
CF from Operations
EO Income
CF from Oper. Incl. EO Items
(Inc)/Dec in FA
Free Cash Flow
(Pur)/Sale of Investments
CF from Investments
(Inc)/Dec in Net Worth
(Inc)/Dec in Debt
Less : Interest Paid
Dividend Paid
CF from Fin. Activity
Inc/Dec of Cash
Add: Beginning Balance
Closing Balance
E: MOSL Estimates
2011
5,736
541
45
1,965
(3,329)
1,028
0
1,028
(3,265)
-2,237
1,289
-1,976
466
1,401
45
695
1,127
178
6,702
6,880
2012
5,964
663
122
2,043
(2,262)
2,442
0
2,442
(3,361)
-919
20
-3,342
1,145
1,224
122
1,246
1,001
102
6,880
6,982
2013
4,814
771
165
1,773
(2,633)
1,345
0
1,345
(3,765)
-2,420
(2,035)
-5,800
320
1,506
165
976
684
(3,771)
6,983
3,211
2014
3,901
922
274
1,696
745
4,146
0
4,146
(2,816)
1,330
(2,649)
-5,464
547
3,178
274
836
2,615
1,297
3,211
4,508
2015
3,683
1,341
820
1,711
873
5,006
-494
4,512
(436)
4,076
(1,138)
-1,426
12
-4,297
820
1,004
(6,108)
(3,022)
4,508
3,494
2016E
4,580
1,287
615
1,661
(2,217)
2,604
0
2,604
(1,663)
941
0
-1,500
0
-92
615
1,577
(2,284)
(1,180)
3,494
2,314
(INR Million)
2017E
6,112
1,361
600
1,863
3,350
9,560
0
9,560
(2,535)
7,025
0
-2,500
0
0
600
2,008
(2,608)
4,452
2,314
6,766
28 July 2015
8

Thermax
Corporate profile: Thermax
Company description
TMX is India's leading Energy and Environment
solutions provider. It is one of the few companies
globally that offers integrated innovative solutions
in the areas of heating, cooling, power, water and
waste management, air pollution control and
chemicals. Overseas business contributed ~32% of
the consolidated revenues in FY14, and the target
is to increase the contribution to 40% in the
medium term. Intent is that new products
launched in last five years should contribute 33% of
the revenues, and thus being repositioned as
innovation led company.
Exhibit 12: Sensex rebased
1,350
1,200
1,050
900
750
Jul-14
Oct-14
Jan-15
Apr-15
Jul-15
Thermax
Sensex - Rebased
Exhibit 13: Shareholding pattern (%)
Jun-15
Promoter
DII
FII
Others
62.0
7.5
15.8
14.8
Mar-15
62.0
7.7
15.7
14.7
Jun-14
62.0
7.6
15.4
15.0
Exhibit 14: Top holders
Holder Name
Matthews Pacific Tiger Fund
Arnavaz Rohinton Aga
LIC of India
Amansa Holding Pvt Ltd
Matthew India Fund
Goldman Sachs India Fund Ltd
% Holding
4.5
2.4
1.5
1.4
1.3
1.3
Note: FII Includes depository receipts
Exhibit 15: Top management
Name
Meher Pudumjee
M S Unnikrishnan
Amitabha Mukhohadhyay
Designation
Chairperson
Managing Director & CEO
EVP & CFO
Exhibit 16: Directors
Name
Meher Pudumjee
M S Unnikrishnan
Pheroz Pudumjee
Tapan Mitra*
Nawshir Mirza*
*Independent
Name
Valentin Von Massow*
Raghunath A Mashelkar*
Anu Aga
Jairam Varadaraj*
Exhibit 17: Auditors
Name
B K Khare & Co
Dhananjay V Joshi & Associates
Type
Statutory
Cost Auditor
Exhibit 18: MOSL forecast v/s consensus
EPS
(INR)
FY16
FY17
MOSL
forecast
28.1
37.3
Consensus
forecast
27.1
35.1
Variation
(%)
3.6
6.2
28 July 2015
9

This document has been prepared by Motilal Oswal Securities Limited (hereinafter referred to as Most) to provide information about the company(ies) and/sector(s), if any, covered in the report and may be distributed
Thermax
by it and/or its affiliated company(ies). This report is for personal information of the selected recipient/s and does not construe to be any investment, legal or taxation advice to you. This research report does not
constitute an offer, invitation or inducement to invest in securities or other investments and Motilal Oswal Securities Limited (hereinafter referred as MOSt) is not soliciting any action based upon it. This report is not for
public distribution and has been furnished to you solely for your general information and should not be reproduced or redistributed to any other person in any form. This report does not constitute a personal
recommendation or take into account the particular investment objectives, financial situations, or needs of individual clients. Before acting on any advice or recommendation in this material, investors should consider
whether it is suitable for their particular circumstances and, if necessary, seek professional advice. The price and value of the investments referred to in this material and the income from them may go down as well as
up, and investors may realize losses on any investments. Past performance is not a guide for future performance, future returns are not guaranteed and a loss of original capital may occur.
MOSt and its affiliates are a full-service, integrated investment banking, investment management, brokerage and financing group. We and our affiliates have investment banking and other business relationships with a
some companies covered by our Research Department. Our research professionals may provide input into our investment banking and other business selection processes. Investors should assume that MOSt and/or
its affiliates are seeking or will seek investment banking or other business from the company or companies that are the subject of this material and that the research professionals who were involved in preparing this
material may educate investors on investments in such business. The research professionals responsible for the preparation of this document may interact with trading desk personnel, sales personnel and other
parties for the purpose of gathering, applying and interpreting information. Our research professionals are paid on the profitability of MOSt which may include earnings from investment banking and other business.
MOSt generally prohibits its analysts, persons reporting to analysts, and members of their households from maintaining a financial interest in the securities or derivatives of any companies that the analysts cover.
Additionally, MOSt generally prohibits its analysts and persons reporting to analysts from serving as an officer, director, or advisory board member of any companies that the analysts cover. Our salespeople, traders,
and other professionals or affiliates may provide oral or written market commentary or trading strategies to our clients that reflect opinions that are contrary to the opinions expressed herein, and our proprietary
trading and investing businesses may make investment decisions that are inconsistent with the recommendations expressed herein. In reviewing these materials, you should be aware that any or all of the foregoing
among other things, may give rise to real or potential conflicts of interest. MOSt and its affiliated company(ies), their directors and employees and their relatives may; (a) from time to time, have a long or short position
in, act as principal in, and buy or sell the securities or derivatives thereof of companies mentioned herein. (b) be engaged in any other transaction involving such securities and earn brokerage or other compensation
or act as a market maker in the financial instruments of the company(ies) discussed herein or act as an advisor or lender/borrower to such company(ies) or may have any other potential conflict of interests with
respect to any recommendation and other related information and opinions.; however the same shall have no bearing whatsoever on the specific recommendations made by the analyst(s), as the recommendations
made by the analyst(s) are completely independent of the views of the affiliates of MOSt even though there might exist an inherent conflict of interest in some of the stocks mentioned in the research report
Reports based on technical and derivative analysis center on studying charts company's price movement, outstanding positions and trading volume, as opposed to focusing on a company's fundamentals and, as
such, may not match with a report on a company's fundamental analysis. In addition MOST has different business segments / Divisions with independent research separated by Chinese walls catering to different set
of customers having various objectives, risk profiles, investment horizon, etc, and therefore may at times have different contrary views on stocks sectors and markets.
Unauthorized disclosure, use, dissemination or copying (either whole or partial) of this information, is prohibited. The person accessing this information specifically agrees to exempt MOSt or any of its affiliates or
employees from, any and all responsibility/liability arising from such misuse and agrees not to hold MOSt or any of its affiliates or employees responsible for any such misuse and further agrees to hold MOSt or any of
its affiliates or employees free and harmless from all losses, costs, damages, expenses that may be suffered by the person accessing this information due to any errors and delays. The information contained herein is
based on publicly available data or other sources believed to be reliable. Any statements contained in this report attributed to a third party represent MOSt’s interpretation of the data, information and/or opinions
provided by that third party either publicly or through a subscription service, and such use and interpretation have not been reviewed by the third party. This Report is not intended to be a complete statement or
summary of the securities, markets or developments referred to in the document. While we would endeavor to update the information herein on reasonable basis, MOSt and/or its affiliates are under no obligation to
update the information. Also there may be regulatory, compliance, or other reasons that may prevent MOSt and/or its affiliates from doing so. MOSt or any of its affiliates or employees shall not be in any way
responsible and liable for any loss or damage that may arise to any person from any inadvertent error in the information contained in this report. MOSt or any of its affiliates or employees do not provide, at any time,
any express or implied warranty of any kind, regarding any matter pertaining to this report, including without limitation the implied warranties of merchantability, fitness for a particular purpose, and non-infringement.
The recipients of this report should rely on their own investigations.
This report is intended for distribution to institutional investors. Recipients who are not institutional investors should seek advice of their independent financial advisor prior to taking any investment decision based on
this report or for any necessary explanation of its contents.
Most and it’s associates may have managed or co-managed public offering of securities, may have received compensation for investment banking or merchant banking or brokerage services, may have received any
compensation for products or services other than investment banking or merchant banking or brokerage services from the subject company in the past 12 months.
Most and it’s associates have not received any compensation or other benefits from the subject company or third party in connection with the research report.
Subject Company may have been a client of Most or its associates during twelve months preceding the date of distribution of the research report
MOSt and/or its affiliates and/or employees may have interests/positions, financial or otherwise of over 1 % at the end of the month immediately preceding the date of publication of the research in the securities
mentioned in this report. To enhance transparency, MOSt has incorporated a Disclosure of Interest Statement in this document. This should, however, not be treated as endorsement of the views expressed in the
report.
Motilal Oswal Securities Limited is registered as a Research Analyst under SEBI (Research Analyst) Regulations, 2014. SEBI Reg. No. INH000000412
There are no material disciplinary action that been taken by any regulatory authority impacting equity research analysis activities
Analyst Certification
The views expressed in this research report accurately reflect the personal views of the analyst(s) about the subject securities or issues, and no part of the compensation of the research analyst(s) was, is, or will be
directly or indirectly related to the specific recommendations and views expressed by research analyst(s) in this report. The research analysts, strategists, or research associates principally responsible for preparation
of MOSt research receive compensation based upon various factors, including quality of research, investor client feedback, stock picking, competitive factors and firm revenues
Disclosure of Interest Statement
§
Analyst ownership of the stock
§
Served as an officer, director or employee
THERMAX
No
No
Disclosures
A graph of daily closing prices of securities is available at www.nseindia.com and http://economictimes.indiatimes.com/markets/stocks/stock-quotes
Regional Disclosures (outside India)
For U.S.
This report is not directed or intended for distribution to or use by any person or entity resident in a state, country or any jurisdiction, where such distribution, publication, availability or use would be contrary to law,
regulation or which would subject MOSt & its group companies to registration or licensing requirements within such jurisdictions.
Motilal Oswal Securities Limited (MOSL) is not a registered broker - dealer under the U.S. Securities Exchange Act of 1934, as amended (the"1934 act") and under applicable state laws in the United States. In
addition MOSL is not a registered investment adviser under the U.S. Investment Advisers Act of 1940, as amended (the "Advisers Act" and together with the 1934 Act, the "Acts), and under applicable state laws in the
United States. Accordingly, in the absence of specific exemption under the Acts, any brokerage and investment services provided by MOSL, including the products and services described herein are not available to or
intended for U.S. persons.
This report is intended for distribution only to "Major Institutional Investors" as defined by Rule 15a-6(b)(4) of the Exchange Act and interpretations thereof by SEC (henceforth referred to as "major institutional
investors"). This document must not be acted on or relied on by persons who are not major institutional investors. Any investment or investment activity to which this document relates is only available to major
institutional investors and will be engaged in only with major institutional investors. In reliance on the exemption from registration provided by Rule 15a-6 of the U.S. Securities Exchange Act of 1934, as amended (the
"Exchange Act") and interpretations thereof by the U.S. Securities and Exchange Commission ("SEC") in order to conduct business with Institutional Investors based in the U.S., MOSL has entered into a chaperoning
agreement with a U.S. registered broker-dealer, Motilal Oswal Securities International Private Limited. ("MOSIPL"). Any business interaction pursuant to this report will have to be executed within the provisions of this
chaperoning agreement.
The Research Analysts contributing to the report may not be registered /qualified as research analyst with FINRA. Such research analyst may not be associated persons of the U.S. registered broker-dealer, MOSIPL,
and therefore, may not be subject to NASD rule 2711 and NYSE Rule 472 restrictions on communication with a subject company, public appearances and trading securities held by a research analyst account.
Motilal Oswal Capital Markets Singapore Pte Limited is acting as an exempt financial advisor under section 23(1)(f) of the Financial Advisers Act(FAA) read with regulation 17(1)(d) of the Financial Advisors
Regulations and is a subsidiary of Motilal Oswal Securities Limited in India. This research is distributed in Singapore by Motilal Oswal Capital Markets Singapore Pte Limited and it is only directed in Singapore to
accredited investors, as defined in the Financial Advisers Regulations and the Securities and Futures Act (Chapter 289), as amended from time to time.
In respect of any matter arising from or in connection with the research you could contact the following representatives of Motilal Oswal Capital Markets Singapore Pte Limited:
Kadambari Balachandran
Email : kadambari.balachandran@motilaloswal.com
Contact : (+65) 68189233 / 65249115
Office Address : 21 (Suite 31),16 Collyer Quay,Singapore 04931
For Singapore
Motilal Oswal Securities Ltd
28 July 2015
Motilal Oswal Tower, Level 9, Sayani Road, Prabhadevi, Mumbai 400 025
Phone: +91 22 3982 5500 E-mail: reports@motilaloswal.com
10