3 August 2015
1QFY16 Results Update | Sector:
Retail
Shoppers Stop
BSE SENSEX
28,187
Bloomberg
Equity Shares (m)
M.Cap. (INR b) / (USD b)
52-Week Range (INR)
1, 6, 12 Rel. Per (%)
Avg Val (INRm)/Vol ‘000
Free float (%)
S&P CNX
8,543
SHOP IN
82.2
32.9/0.5
624 / 330
3/-10/-8
29/64
32.8
Financials & Valuation (INR Billion)
Y/E MAR
Sales
EBITDA
Adj. PAT
2015 2016E 2017E
30.4
1.9
0.4
35.0
2.2
0.5
6.4
31.6
97.0
6.7
9.3
62.3
4.1
41.3
2.7
0.8
9.3
44.8
104.2
9.1
11.3
43.0
3.8
CMP: INR401
TP: INR380 (-5%)
Neutral
Double-digit SSSG comes at the cost of margins
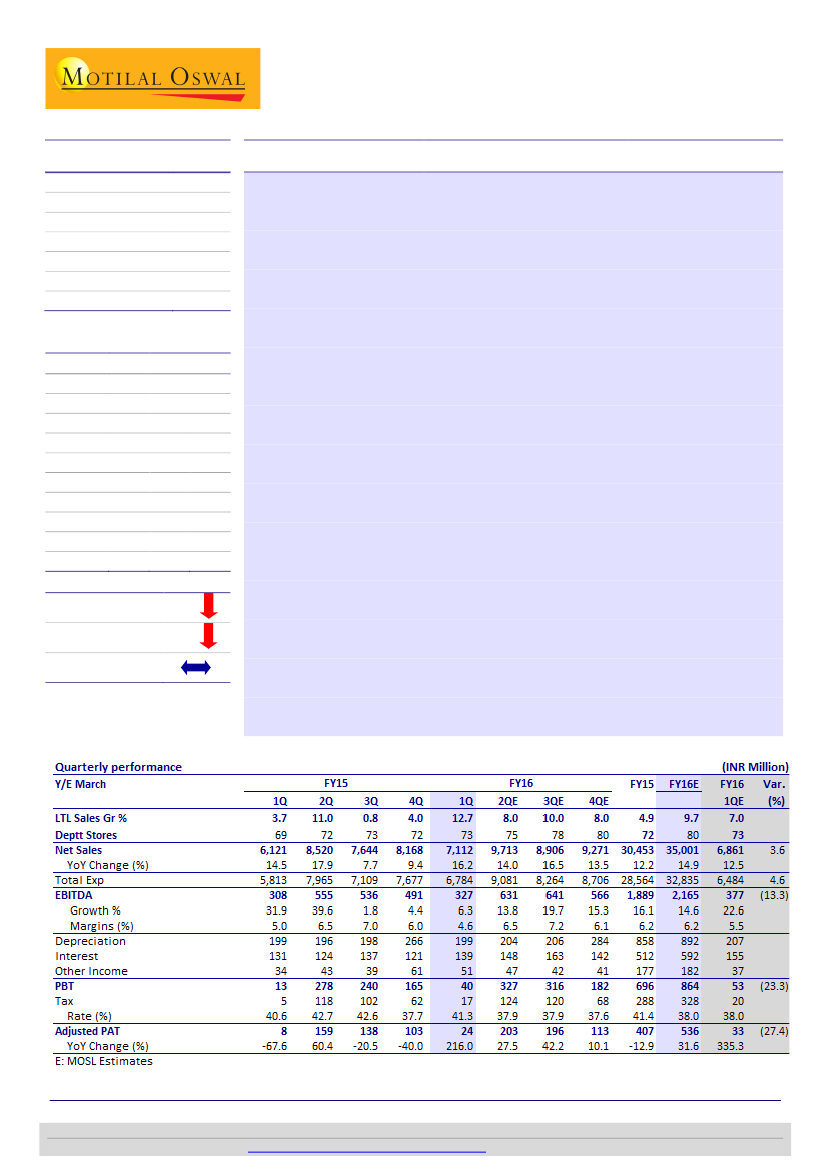
Standalone performance highlights:
In 1QFY16, standalone sales grew 16.2% to
INR7.1b (est. INR6.9b). LTL sales grew 12.7%, with LTL volumes up 10.6%. Gross
margin contracted 200bp to 39.2% while EBITDA margin contracted 40bp to 4.6%
(est. 5.5%). EBITDA was up a modest 6.3% YoY to INR327m and missed our
estimates by 13%. Recurring PAT tripled to INR24m on an extremely favorable
base and missed our estimates by 27% (1QFY15 PAT declined 67%).
HyperCITY—operating leverage plus cost control drive 60bp EBITDA margin
expansion at store level:
HyperCITY reported sales of INR2.5b, up 3.4%, with weak
underlying SSSG performance. LTL sales posted 1.9% YoY growth and LTL volume
declined 6%. Net margin expanded 30bp to 21.2%. Store operating expenses
stayed flattish. Store EBITDA margin expanded 60bp to 6%, with underlying store
EBITDA up 22% to INR95m. HyperCITY posted a loss of INR159m (10% YoY and
37% QoQ decline in losses). We note that HyperCITY continues to reel under the
impact of low SSSG, notwithstanding the sequential improvement in store-level
EBITDA. Consistent high single-digit and low double-digit SSSG is essential for
HyperCITY to turn profitable, in our view.
Concall highlights:
(a) SHOP has reduced the “SALE” period from eight to six
weeks; will close by August 16. (b) Guidance: 2Q16 will be muted; 2Q+3Q run-rate
will be around 8% LTL growth (2Q and 3Q combined last year was around 5-6% LTL
growth).c) Activations and certain base-related variations led to gross margin
decline. d) Investment of INR600m on online platform spread over three years;
plans to increase contribution to revenue to 10% from the current 1%.
Valuation and view:
While standalone performance represents the typical
“SSSG
v/s margin”
dilemma confronting traditional retailers, HyperCITY continues to
remain a drag on consolidated profitability. We cut our estimates 17-18% as we
bake in muted margin expansion guidance and maintain
Neutral,
with a revised
SOTP-based target price of INR380 (17x standalone EV/EBITDA; 0.5x P/sales for
HyperCITY).
Adj.EPS(INR) 4.9
EPS Gr. (%) 7.9
BV/Sh.(INR)
RoE (%)
RoCE (%)
P/E (x)
P/BV (x)
93.1
5.3
8.0
82.0
4.3
Estimate change
TP change
Rating change
-18%
-7%
Gautam Duggad
(Gautam.Duggad@MotilalOswal.com); +91 22 3982 5404
Manish Poddar
(Manish.Poddar@MotilalOswal.com); +91 22 3027 8029/
Vishal Punmiya
(Vishal.Punmiya@MotilalOswal.com)
Investors are advised to refer through disclosures made at the end of the Research Report.
Motilal Oswal research is available on
www.motilaloswal.com/Institutional-Equities,
Bloomberg, Thomson Reuters, Factset and S&P Capital.

Shoppers Stop
Key quarterly charts
Exhibit 1: Quarterly Snapshot
Key metrics (%)
Total Area (m sq ft)
Sales/sq ft - Shoppers Stop (INR)
Sales growth - ALL
Sales growth - dept
Same store sales growth - Dept
LTL Sales growth > 5 yr old store
LTL Sales growth < 5 yr old store
LTL Volume Growth (%)
Bought out
Consignment / SOR
Concession
4QFY13 1QFY14 2QFY14
3.3
2,120
15.0
15.0
10.0
4.0
19.0
1.0
41.5
55.0
3.6
3.7
1,707
18.0
17.0
12.0
7.0
20.0
3.3
44.2
52.8
3.1
3.7
2,262
23.0
23.0
15.5
13.0
19.7
9.0
41.4
55.6
3.0
3QFY14 4QFY14
3.9
2,070
16.0
14.0
5.5
2.5
10.0
(1.0)
41.8
55.3
2.9
3.9
2,168
18.7
17.0
8.4
3.8
15.0
6.5
39.4
57.9
2.7
1QFY15 2QFY15
4.0
1,703
12.9
11.1
3.7
(1.0)
15.4
5.4
43.7
53.8
2.6
4.2
2,354
18.0
16.4
11.0
7.0
20.0
7.2
40.8
56.9
2.3
3QFY15 4QFY15 1QFY16
4.2
4.2
4.2
1,985
2,176
1,858
7.1
9.0
15.7
5.8
8.5
15.5
0.8
4.0
12.7
(2.7)
3.3
13.3
7.9
5.3
11.6
(1.1)
(1.7)
10.6
42.0
39.9
44.2
55.5
58.0
53.9
2.5
2.0
1.9
Source: Company, MOSL
Exhibit 2: Shoppers Stop added 2 SHOP store (closed 1 store)
and 1 HyperCITY store in 1QFY16
Shoppers Stop
60 61
Hypercity
72 73 72 73
67 69
65
Exhibit 3: LTL sales grew 12.7% in 1QFY16
LTL Sales growth (%)
15.5
12.5 12.0
10.0
8.4
5.5
5.0
1.0
41 43
10 10
54 55 55
49 51 52
11.0
7.0
10.0
11.0
3.7
12.7
4.0
0.8
17
15 15 15 15 15 16
14
12 12 12 12 12 12 13
-1.3
Source: MOSL, Company
Exhibit 4: LTL volumes were
up 10.6%
LTL Volume growth (%)
9.0
4.0
1.0
1.0
1.0
3.3
10.6
6.5 5.4 7.2
Exhibit 5: EBITDA
margins
contracted 40bp YoY; EBITDA miss
of 13%
EBITDA Margin (%)
7.8 8.2
7.5
5.0
3.1
6.1
4.4
5.5
7.4
6.7
6.7
6.3
5.0
6.5 7.0 6.0
4.6
-1.0
-5.0
-9.0
-4.0-4.0
-1.1-1.7
Source: MOSL, Company
3 August 2015
2

Shoppers Stop
Exhibit 6: LTL Customer entry continued to decline even on a low base of -8.7%in 1Q15
3.0
5.0
LTL Customer Entry Growth (%)
5.0 5.0
1.0
-1.0
(6.0)
(11.0)
(10.0)
(8.7)
-1.0
(3.7)
(6.7) (6.6)
(0.5)
(4.1) (4.1)
Source: MOSL, Company
Shoppers Stop: LTL sales up 12.7%; LTL volumes grew 10.6%
SHOP’s S/L sales for 1QFY16 grew 16.2% YoY to INR7.1b (est. INR6.9b). LTL sales
grew at 12.7% (est. 7%) with LTL volumes growth of 10.6%. For stores less than
5 years old LTL sales stood at 11.6% while for stores older than 5 years, LTL sales
grew 13.3%.
Gross margin contracted 200bp YoY to 39.2% while lower administrative
expenses (down 50bp YoY to 16.1%), lease rent (down 50bp to 10.3%) and staff
cost (down 50bp to 8.1%) restricted EBITDA margin contraction by 40bp YoY to
4.6% (est. 5.5%). EBITDA posted 6.3% YoY growth, albeit on a higher base
(EBITDA grew 31.9% in 1Q15), to INR327m (est. INR377m).
Higher other income (up 51.3% to INR51m) led PAT growth of 216% YoY to
INR24m (est. INR33m).
During the quarter, SHOP opened two new stores (Royal Meenakshi Mall,
Bengaluru and at Mangalore Airport, Mangalore) and closed one at Delhi
Airport. The total store count now stands at 73. Total retail space stood at
4.19msf.
Exhibit 7: HyperCITY Quarterly snapshot
INR m
Net Sales
Gross Profit
Gross Margin (%)
Store EBITDA
% to sales
Company EBITDA
% to sales
PAT
% to sales
LTL sales growth (%)
Stores
LTL volume Growth (%)
LTL Ticket Size Growth (%)
4QFY13
1,757
369
21.0
7
0.4
-85
-4.9
-219
-12.4
11
12
3
4
1QFY14
2,113
449
21.3
28
1.3
-93
-4.4
-247
-11.7
14
13
4
6
2QFY14
2,170
470
21.7
13
0.6
-126
-5.8
-258
-11.9
9
14
1
6
3QFY14
2,289
492
21.5
18
0.8
-111
-4.9
-251
-10.9
1
15
-6
3
4QFY14
1,890
407
21.5
20
1.0
-140
-7.4
-343
-18.1
-7
15
-8
-1
1QFY15
2,289
509
22.2
78
3.4
-16
-0.7
-177
-7.7
-5
15
-7
-1
2QFY15
2,304
516
22.4
91
3.9
2
0.1
-164
-7.1
1
15
-5
6
3QFY15 4QFY15 1QFY16
2,435
2,012
2,368
552
458
536
22.7
22.7
22.6
93
54
95
3.8
2.7
4.0
2
-65
1.1
0.1
-3.2
0.0
-159
-252
-159
-6.5
-12.5
-6.7
7
6
2
15
16
17
-2
-1
-6
9
7
8
Source: Company, MOSL
3 August 2015
3

Shoppers Stop
HyperCITY: LTL volumes de-grew 6%; Store level EBITDA grew 22% YoY
HyperCITY Retail (51% stake) reported sales of INR2.4b (INR 2.3b in 1QFY15). LTL
sales grew 2% and LTL volumes declined 6% (base quarter had 7% volume
decline).
Net margin expanded 30bp to 21.2%. Lower store operating expenses (down
50bp to 20%) drove Store EBITDA margin expansion of 60bp to 4% with
underlying 22% growth in store EBITDA to INR95m.
Company level EBITDA stood at INR1m (vs INR16m loss in 1QFY15)
Higher interest costs (up 12.5% YoY) and lower depreciation expenses (down
15.6% YoY) resulted in recurring loss of INR159m at PBT/reported PAT level.
Concall Highlights
LTL sales growth
12.7% LTL sales growth: ~10.6% contributed by volume and 2% from ASP.
Volume growth has come across stores; also benefitted from renovations of the
top 4 stores which were done last year.
Adjusted for the 4 renovated stores LTL sales growth to be around 9.7%.
2Q will be muted; 2Q+3Q run-rate will be around 8% (2Q and 3Q combined last
year was around 5-6%), same for whole year.
Margins
Activations during the quarter led to gross margin decline and also because of
one-off gain last year due to better negotiation with vendors; adjusted for one –
off, gross margins would have contracted 50bp YoY.
Gross margins will pan out better over the next 3 quarters due to increasing
share of private and exclusive brands.
In FY16, SHOP shall see 20-30bp gross margin expansion.
Segments
Bought out higher due to higher quantum of private and exclusive brands.
Women western wear and Denim did well in Apparel category.
Jewelry continued to decline.
Omni-Channel
Phase 1- would be live and active by Diwali.
Phase 2- Multichannel will be active by 1QFY17.
Phase 3- Omni Channel will be active by 4QFY17.
Investment in Online platform and brands
Investment of INR 600m on online platform spread over 3 years; plans to
increase contribution to revenues to 10% from current 1%.
Will see lot of action on private and exclusive brands (WROGN , Desigual and
Rocky star) in 3Q & 4Q; Have rationalized private labels from 11 to 7 labels and
will focus on building these 7 brands + focus on 6 exclusive brands.
3 August 2015
GST
Likely GST rate: 20%
It will be industry neutral if GST is implemented.
4

Shoppers Stop
HyperCITY
Underlying demand should pick up due to festive season.
LTL double digit sales per sq ft growth can drive EBIT breakeven.
Objective is to take fashion share to 19% by FY16 and 22% by FY17.
Noodles contribute around 0.4% of overall sales but the issue has disrupted
overall industry in terms of new launches and customer sentiment towards the
category.
Working with Zopnow (FMCG and Staples) to provide back end sourcing;
growing at 100%+ for HyperCITY. Currently operational in Bangalore,
Hyderabad, Mumbai and Pune.
1 HyperCITY store opened, will be adding 2 more stores (~40,000 sq ft)
Others
Full –priced sales deliver 10% higher margins vs. discounted sales.
Ansal Plaza in Delhi is likely to shut down; expect 1-2 malls in which SHOP
operates to shut down.
Eyestop: At present 5 stores and will expand to Pan-India in next 24 months.
SHOP has reduced the “SALE” period from 8 weeks to 6 weeks which will end by
16th August.
Loyalty programme: Increased from 3.6m to 3.8m; two main initiatives: Magical
bonus points in accounts of first citizen and extension of First Citizen Fiesta.
Due to renovation – Stores greater than 5 years did well. 4 stores were
renovated.
Geographical demand: East, North and West saw double digit growth; slowdown
in Hyderabad and Bangalore due to re-organization of Telangana and AP.
Guidance
Planning to add 7-8 stores in FY16 (1 already opened in 2Q; 2 in 1Q), earlier
guidance 6 stores.
20-30bp margin expansion at gross margin level every year (mix and
assortment).
Exhibit 8: Change in estimates (by 17-18%) is driven by margin miss
New
Sales
EBITDA
PAT
FY16E
35,001
2,165
536
FY17E
41,250
2,655
776
FY16E
35,001
2,363
654
Old
FY17E
41,250
2,934
944
Change (%)
FY16E
FY17E
0.0
0.0
-8.4
-9.5
-18.0
-17.8
Source: Company, MOSL
Valuation and view
While stand-alone performance represents the typical
“SSSG vs. margins”
dilemma
confronting the traditional retailers, HyperCITY continues to remain a drag on
consolidated profitability. We cut our estimates 17-18% as we bake in muted margin
expansion guidance and maintain Neutral, with a revised SOTP-based target price of
INR380 (17x standalone EV/EBITDA; 0.5x P/sales for HyperCITY).
3 August 2015
5

Shoppers Stop
Exhibit 9:
Valuation
Matrix of coverage universe
Company
Consumer
Asian Paints
Britannia
Colgate
Dabur*
Emami*
Godrej Consumer
GSK Consumer
Hind. Unilever
ITC
Jyothy Labs
Marico*
Nestle
Pidilite Inds.
Radico Khaitan
United Spirits
Retail
Jubilant Foodworks
Shopper's Stop
Titan Company
Reco
Price
(INR)
877
3,135
1,986
291
1,326
1,379
6,259
910
331
299
432
6,337
553
93
3,598
1,876
401
317
Mkt Cap
(USD M)
13,137
5,848
4,216
7,967
4,698
7,329
4,110
30,731
41,145
845
4,354
9,541
4,429
193
8,165
1,916
514
4,399
EPS Growth YoY (%)
P/E (x)
EV/EBITDA (x)
ROE (%) Div. (%)
FY15
32.4
56.4
81.6
35.5
45.3
21.4
29.6
108.1
33.7
16.8
33.5
48.2
23.1
8.6
-21.7
18.8
5.4
26.6
FY15
0.8
0.5
1.3
0.8
0.6
0.5
0.9
1.6
1.9
1.3
0.6
1.0
0.6
0.9
0.0
0.1
0.2
0.9
FY15 FY16E FY17E FY15 FY16E FY17E FY15 FY16E FY17E
15.8 31.4
45.1 37.8
13.9 11.7
15.7 22.2
21.7 25.1
22.0 30.6
-13.5 23.2
6.4
15.3
8.5
13.3
48.7 -7.5
18.1 21.2
6.8 -13.1
9.9
32.3
-10.4 8.6
Loss -165.6
4.5
7.9
11.1
64.3
31.6
-3.4
23.4
18.1
27.8
17.1
22.0
25.6
20.5
19.1
10.4
26.1
24.4
21.3
16.6
21.8
82.2
42.5
44.8
21.7
59.1 45.0
65.5 47.5
48.3 43.2
47.9 39.2
61.4 49.1
51.7 39.6
45.1 36.6
52.0 45.1
27.6 24.4
42.6 46.0
48.6 40.1
48.7 56.0
54.4 41.1
16.3 15.0
-76.3 116.3
99.3
82.0
34.2
60.4
62.3
35.4
36.5
40.2
33.8
33.5
40.2
31.5
30.4
37.9
22.1
36.5
32.2
46.1
35.2
12.3
63.8
42.4
43.0
29.1
40.2
47.4
32.2
38.5
54.4
36.9
33.4
37.4
18.5
36.0
32.0
29.0
36.0
11.7
73.1
46.5
18.0
24.3
30.4
32.7
28.0
31.2
42.4
29.1
26.1
31.3
16.4
27.2
25.9
32.3
26.1
9.9
54.3
29.6
15.8
25.4
24.4
27.3
22.0
26.4
34.4
23.8
21.4
26.4
14.8
21.3
20.7
27.4
22.2
8.3
37.4
21.5
13.0
20.6
Buy
Buy
Neutral
Neutral
Buy
Neutral
Neutral
Neutral
Neutral
Buy
Neutral
Neutral
Neutral
Buy
Buy
Buy
Neutral
Neutral
Note: For Nestle FY15E means CY14
Source: Company, MOSL
3 August 2015
6

Shoppers Stop
Financials and valuations
Income Statement
Y/E March
Net Revenues
Change (%)
Total Expenditure
EBITDA
Change (%)
Margin (%)
Depreciation
Int. and Fin. Charges
Profit before Taxes
Change (%)
Margin (%)
Tax
Tax Rate (%)
Profit after Taxes
Change (%)
Margin (%)
Exceptionals
Reported PAT
2010
14,009
10.7
12,946
1,064
145.0
7.6
310
224
572
-244.8
4.1
154
27.0
418
-207.5
3.0
85
502
2011
17,120
22.2
15,599
1,521
43.0
8.9
310
145
1,138
98.9
6.6
387
34.0
751
79.9
4.4
1
752
2012
19,297
12.7
17,878
1,419
-6.7
7.4
377
250
978
-14.0
5.1
335
34.3
643
-14.5
3.3
0
643
2013
22,542
16.8
21,278
1,264
-10.9
5.6
507
319
610
-37.6
2.7
211
34.6
399
-37.9
1.8
-7
392
2014
27,136
20.4
25,599
1,537
21.6
5.7
618
419
634
3.9
2.3
257
40.6
377
-5.6
1.4
-7
370
2015
30,420
12.1
28,531
1,889
23.0
6.2
858
512
696
9.8
2.3
288
41.4
407
8.1
1.3
0
407
(INR Million)
2016E
35,001
15.1
32,835
2,165
14.6
6.2
892
592
864
24.3
2.5
328
38.0
536
31.6
1.5
0
536
2017E
41,250
17.9
38,596
2,655
22.6
6.4
988
640
1,251
44.8
3.0
476
38.0
776
44.8
1.9
0
776
Balance Sheet
Y/E March
Share Capital
Reserves
Net Worth
Loans
Deferred Tax
Capital Employed
Gross Block
Less: Accum. Depn.
Net Fixed Assets
Capital WIP
Property Lease Deposit & Other long term assets
Investments
Curr. Assets, L&A
Inventory
Account Receivables
Cash and Bank Balance
Loans and Advances
Others
Curr. Liab. and Prov.
Account Payables
Other Liabilities
Provisions
Net Current Assets
Application of Funds
E: MOSL Estimates
2010
656
2,433
3,089
1,993
-46
5,037
4,577
1,867
2,710
277
1,033
1,197
2,516
1,499
109
30
878
0
2,696
2,529
106
61
-180
5,037
2011
411
5,570
5,981
1,487
-33
7,436
5,056
1,935
3,121
446
1,068
2,372
3,428
1,511
160
26
1,718
13
3,000
2,771
159
70
428
7,436
2012
413
6,172
6,585
2,591
2
9,178
6,440
2,272
4,168
298
2,503
2,842
2,844
2,120
192
71
389
71
3,477
2,361
1,023
93
-633
9,178
2013
415
6,523
6,938
3,293
63
10,294
7,212
2,653
4,559
274
2,833
3,309
3,374
2,438
204
117
470
145
4,056
2,817
1,136
103
-682
10,294
2014
416
6,871
7,287
4,513
100
11,899
8,467
2,976
5,490
319
3,012
3,876
3,892
2,955
260
87
440
149
4,689
3,097
1,519
73
-798
11,899
2015
417
7,236
7,653
5,184
96
12,932
9,684
3,721
5,963
142
3,423
4,065
4,310
3,296
223
49
626
116
4,971
3,314
1,582
75
-661
12,932
(INR Million)
2016E
417
7,550
7,967
5,571
96
13,633
11,050
3,978
7,072
150
3,221
4,265
4,666
3,475
254
108
714
116
5,741
3,844
1,771
125
-1,075
13,633
2017E
417
8,144
8,561
6,069
96
14,726
12,474
4,491
7,983
150
3,668
4,365
5,348
4,052
295
78
808
116
6,789
4,529
2,079
182
-1,441
14,726
3 August 2015
7

Shoppers Stop
Financials and valuations
Ratios
Y/E March
Basic (INR)
EPS
Cash EPS
BV/Share
DPS
Payout %
Valuation (x)
P/E
Cash P/E
EV/Sales
EV/EBITDA
P/BV
Dividend Yield (%)
Return Ratios (%)
RoE
RoCE
RoCE Adjusted for Inv
Working Capital Ratios
Debtor (Days)
Asset Turnover (x)
Leverage Ratio
Debt/Equity (x)
Cash Flow Statement
Y/E March
Profit before tax
Add : Depreciation
Interest
Direct Taxes Paid
Incr in WC
Ch In DFA
Extra-ordinary Income
CF from Operations
Incr in FA
Free Cash Flow
Investments
CF from Invest.
Increase in networth
Increase In debt
Interest Paid
Dividend Paid
Others
CF from Fin. Activity
Incr/Decr of Cash
Add: Opening Balance
Closing Balance
E: MOSL Estimates
2010
4.2
8.9
37.6
0.8
18.0
2011
9.1
12.9
72.8
0.8
8.2
2012
7.8
12.4
80.1
0.8
9.6
2013
4.8
11.0
84.4
0.8
15.6
2014
4.5
12.1
88.7
0.8
16.6
2015
4.9
15.4
93.1
0.7
15.3
2016E
6.4
17.4
97.0
1.3
20.0
2017E
9.3
21.5
104.2
1.9
20.0
51.5
32.3
1.7
23.0
5.0
0.2
83.3
36.3
1.5
25.9
4.7
0.2
88.5
33.1
1.2
21.8
4.5
0.2
82.0
26.0
1.1
18.0
4.3
0.2
62.3
23.1
1.0
15.8
4.1
0.3
43.0
18.7
0.8
13.0
3.8
0.5
13.5
15.0
19.6
12.6
16.3
23.9
9.8
11.3
16.4
5.8
7.4
10.8
5.2
7.7
11.5
5.3
8.0
11.6
6.7
9.3
13.6
9.1
11.3
16.1
3
2.8
3
2.3
4
2.1
3
2.2
3
2.3
3
2.4
3
2.6
3
2.8
0.6
0.2
0.4
0.5
0.6
0.7
0.7
0.7
(INR Million)
2017E
1,251
513
640
476
-337
0
0
2,266
1,424
841
100
1,524
0
498
640
182
-447
-771
-29
107
78
2010
572
187
224
154
155
-46
85
713
587
127
222
809
317
-84
224
61
21
-32
-127
157
30
2011
1,138
68
145
387
613
13
1
366
650
-284
1,175
1,825
2,210
-506
145
70
-34
1,455
-4
30
26
2012
978
337
250
335
-1,107
35
0
2,301
1,235
1,067
470
1,705
33
1,103
250
72
-1,366
-552
45
26
71
2013
610
381
319
211
-95
60
-7
1,126
749
377
467
1,216
34
703
319
73
-210
135
46
71
117
2014
634
324
419
257
-86
37
-7
1,161
1,299
-138
567
1,866
51
1,220
419
73
-105
674
-30
117
87
2015
696
744
512
288
175
-4
0
1,493
1,041
452
189
1,230
34
671
512
75
-419
-302
-38
87
49
2016E
864
257
592
328
-472
0
0
1,857
1,373
483
200
1,573
-97
387
592
125
201
-225
58
49
107
3 August 2015
8

Shoppers Stop
Corporate profile: Shoppers Stop
Company description
Shoppers Stop (SHOP) is one of the largest
department store chains in India, with 73 stores
and retail space of 4.2msf. The company is
promoted by CL Raheja Group, one of the largest
real estate groups in the country. SHOP has also
entered specialty retail formats like Home
Furnishing (Home Stop) and Beauty (Estee Lauder
and M.A.C.). It also has presence in the high
potential Hypermarket space through its 51%
subsidiary, HyperCITY.
Exhibit 10: Sensex rebased
Exhibit 11: Shareholding pattern (%)
Jun-15
Promoter
DII
FII
Others
67.2
13.4
4.1
15.3
Mar-15
67.2
13.9
3.8
15.1
Jun-14
67.3
14.9
2.9
15.0
Exhibit 12: Top holders
Holder Name
Reliance Capital Trustee Co. Ltd A/C Reliance Equity
Miraj Marketing Company Llp
Zodiac Clothing Company Limited
Lo Funds - Emerging Consumer
Reliance Capital Trustee Co. Ltd. - A/C Reliance Tax
% Holding
6.6
2.2
2.1
1.8
1.6
Note: FII Includes depository receipts
Exhibit 13: Top management
Name
Chandru L Raheja
B S Nagesh
Govind Shrikhande
Designation
Chairman
Vice Chairman
Managing Director
Exhibit 14: Directors
Name
Chandru L Raheja
B S Nagesh
Govind Shrikhande
Ravi C Raheja
Neel C Raheja
Avnish Bajaj*
Name
Nirvik Singh*
Nitin Sanghavi*
Deepak Ghaisas*
Gareth Thomas*
Manish Chokhani*
Abanti Sankaranarayanan*
*Independent
Exhibit 15: Auditors
Name
Deloitte Haskins & Sells LLP
KPMG
Type
Statutory
Internal
Exhibit 16: MOSL forecast v/s consensus
EPS
(INR)
FY16
FY17
MOSL
forecast
6.4
9.3
Consensus
forecast
7.1
12.5
Variation
(%)
-9.6
-25.5
3 August 2015
9

This document has been prepared by Motilal Oswal Securities Limited (hereinafter referred to as Most) to provide information about the company(ies) and/sector(s), if any, covered in the report and may be distributed
Shoppers Stop
by it and/or its affiliated company(ies). This report is for personal information of the selected recipient/s and does not construe to be any investment, legal or taxation advice to you. This research report does not
constitute an offer, invitation or inducement to invest in securities or other investments and Motilal Oswal Securities Limited (hereinafter referred as MOSt) is not soliciting any action based upon it. This report is not for
public distribution and has been furnished to you solely for your general information and should not be reproduced or redistributed to any other person in any form. This report does not constitute a personal
recommendation or take into account the particular investment objectives, financial situations, or needs of individual clients. Before acting on any advice or recommendation in this material, investors should consider
whether it is suitable for their particular circumstances and, if necessary, seek professional advice. The price and value of the investments referred to in this material and the income from them may go down as well as
up, and investors may realize losses on any investments. Past performance is not a guide for future performance, future returns are not guaranteed and a loss of original capital may occur.
MOSt and its affiliates are a full-service, integrated investment banking, investment management, brokerage and financing group. We and our affiliates have investment banking and other business relationships with a
some companies covered by our Research Department. Our research professionals may provide input into our investment banking and other business selection processes. Investors should assume that MOSt and/or
its affiliates are seeking or will seek investment banking or other business from the company or companies that are the subject of this material and that the research professionals who were involved in preparing this
material may educate investors on investments in such business. The research professionals responsible for the preparation of this document may interact with trading desk personnel, sales personnel and other
parties for the purpose of gathering, applying and interpreting information. Our research professionals are paid on the profitability of MOSt which may include earnings from investment banking and other business.
MOSt generally prohibits its analysts, persons reporting to analysts, and members of their households from maintaining a financial interest in the securities or derivatives of any companies that the analysts cover.
Additionally, MOSt generally prohibits its analysts and persons reporting to analysts from serving as an officer, director, or advisory board member of any companies that the analysts cover. Our salespeople, traders,
and other professionals or affiliates may provide oral or written market commentary or trading strategies to our clients that reflect opinions that are contrary to the opinions expressed herein, and our proprietary
trading and investing businesses may make investment decisions that are inconsistent with the recommendations expressed herein. In reviewing these materials, you should be aware that any or all of the foregoing
among other things, may give rise to real or potential conflicts of interest. MOSt and its affiliated company(ies), their directors and employees and their relatives may; (a) from time to time, have a long or short position
in, act as principal in, and buy or sell the securities or derivatives thereof of companies mentioned herein. (b) be engaged in any other transaction involving such securities and earn brokerage or other compensation
or act as a market maker in the financial instruments of the company(ies) discussed herein or act as an advisor or lender/borrower to such company(ies) or may have any other potential conflict of interests with
respect to any recommendation and other related information and opinions.; however the same shall have no bearing whatsoever on the specific recommendations made by the analyst(s), as the recommendations
made by the analyst(s) are completely independent of the views of the affiliates of MOSt even though there might exist an inherent conflict of interest in some of the stocks mentioned in the research report
Reports based on technical and derivative analysis center on studying charts company's price movement, outstanding positions and trading volume, as opposed to focusing on a company's fundamentals and, as
such, may not match with a report on a company's fundamental analysis. In addition MOST has different business segments / Divisions with independent research separated by Chinese walls catering to different set
of customers having various objectives, risk profiles, investment horizon, etc, and therefore may at times have different contrary views on stocks sectors and markets.
Unauthorized disclosure, use, dissemination or copying (either whole or partial) of this information, is prohibited. The person accessing this information specifically agrees to exempt MOSt or any of its affiliates or
employees from, any and all responsibility/liability arising from such misuse and agrees not to hold MOSt or any of its affiliates or employees responsible for any such misuse and further agrees to hold MOSt or any of
its affiliates or employees free and harmless from all losses, costs, damages, expenses that may be suffered by the person accessing this information due to any errors and delays. The information contained herein is
based on publicly available data or other sources believed to be reliable. Any statements contained in this report attributed to a third party represent MOSt’s interpretation of the data, information and/or opinions
provided by that third party either publicly or through a subscription service, and such use and interpretation have not been reviewed by the third party. This Report is not intended to be a complete statement or
summary of the securities, markets or developments referred to in the document. While we would endeavor to update the information herein on reasonable basis, MOSt and/or its affiliates are under no obligation to
update the information. Also there may be regulatory, compliance, or other reasons that may prevent MOSt and/or its affiliates from doing so. MOSt or any of its affiliates or employees shall not be in any way
responsible and liable for any loss or damage that may arise to any person from any inadvertent error in the information contained in this report. MOSt or any of its affiliates or employees do not provide, at any time,
any express or implied warranty of any kind, regarding any matter pertaining to this report, including without limitation the implied warranties of merchantability, fitness for a particular purpose, and non-infringement.
The recipients of this report should rely on their own investigations.
This report is intended for distribution to institutional investors. Recipients who are not institutional investors should seek advice of their independent financial advisor prior to taking any investment decision based on
this report or for any necessary explanation of its contents.
Most and it’s associates may have managed or co-managed public offering of securities, may have received compensation for investment banking or merchant banking or brokerage services, may have received any
compensation for products or services other than investment banking or merchant banking or brokerage services from the subject company in the past 12 months.
Most and it’s associates have not received any compensation or other benefits from the subject company or third party in connection with the research report.
Subject Company may have been a client of Most or its associates during twelve months preceding the date of distribution of the research report
MOSt and/or its affiliates and/or employees may have interests/positions, financial or otherwise of over 1 % at the end of the month immediately preceding the date of publication of the research in the securities
mentioned in this report. To enhance transparency, MOSt has incorporated a Disclosure of Interest Statement in this document. This should, however, not be treated as endorsement of the views expressed in the
report.
Motilal Oswal Securities Limited is registered as a Research Analyst under SEBI (Research Analyst) Regulations, 2014. SEBI Reg. No. INH000000412
There are no material disciplinary action that been taken by any regulatory authority impacting equity research analysis activities
Analyst Certification
The views expressed in this research report accurately reflect the personal views of the analyst(s) about the subject securities or issues, and no part of the compensation of the research analyst(s) was, is, or will be
directly or indirectly related to the specific recommendations and views expressed by research analyst(s) in this report. The research analysts, strategists, or research associates principally responsible for preparation
of MOSt research receive compensation based upon various factors, including quality of research, investor client feedback, stock picking, competitive factors and firm revenues
Disclosure of Interest Statement
Analyst ownership of the stock
Served as an officer, director or employee
SHOPPERS STOP LTD
No
No
Disclosures
A graph of daily closing prices of securities is available at www.nseindia.com and http://economictimes.indiatimes.com/markets/stocks/stock-quotes
Regional Disclosures (outside India)
For U.S.
This report is not directed or intended for distribution to or use by any person or entity resident in a state, country or any jurisdiction, where such distribution, publication, availability or use would be contrary to law,
regulation or which would subject MOSt & its group companies to registration or licensing requirements within such jurisdictions.
Motilal Oswal Securities Limited (MOSL) is not a registered broker - dealer under the U.S. Securities Exchange Act of 1934, as amended (the"1934 act") and under applicable state laws in the United States. In
addition MOSL is not a registered investment adviser under the U.S. Investment Advisers Act of 1940, as amended (the "Advisers Act" and together with the 1934 Act, the "Acts), and under applicable state laws in the
United States. Accordingly, in the absence of specific exemption under the Acts, any brokerage and investment services provided by MOSL, including the products and services described herein are not available to or
intended for U.S. persons.
This report is intended for distribution only to "Major Institutional Investors" as defined by Rule 15a-6(b)(4) of the Exchange Act and interpretations thereof by SEC (henceforth referred to as "major institutional
investors"). This document must not be acted on or relied on by persons who are not major institutional investors. Any investment or investment activity to which this document relates is only available to major
institutional investors and will be engaged in only with major institutional investors. In reliance on the exemption from registration provided by Rule 15a-6 of the U.S. Securities Exchange Act of 1934, as amended (the
"Exchange Act") and interpretations thereof by the U.S. Securities and Exchange Commission ("SEC") in order to conduct business with Institutional Investors based in the U.S., MOSL has entered into a chaperoning
agreement with a U.S. registered broker-dealer, Motilal Oswal Securities International Private Limited. ("MOSIPL"). Any business interaction pursuant to this report will have to be executed within the provisions of this
chaperoning agreement.
The Research Analysts contributing to the report may not be registered /qualified as research analyst with FINRA. Such research analyst may not be associated persons of the U.S. registered broker-dealer, MOSIPL,
and therefore, may not be subject to NASD rule 2711 and NYSE Rule 472 restrictions on communication with a subject company, public appearances and trading securities held by a research analyst account.
Motilal Oswal Capital Markets Singapore Pte Limited is acting as an exempt financial advisor under section 23(1)(f) of the Financial Advisers Act(FAA) read with regulation 17(1)(d) of the Financial Advisors
Regulations and is a subsidiary of Motilal Oswal Securities Limited in India. This research is distributed in Singapore by Motilal Oswal Capital Markets Singapore Pte Limited and it is only directed in Singapore to
accredited investors, as defined in the Financial Advisers Regulations and the Securities and Futures Act (Chapter 289), as amended from time to time.
In respect of any matter arising from or in connection with the research you could contact the following representatives of Motilal Oswal Capital Markets Singapore Pte Limited:
Kadambari Balachandran
Email : kadambari.balachandran@motilaloswal.com
Contact : (+65) 68189233 / 65249115
Office Address : 21 (Suite 31),16 Collyer Quay,Singapore 04931
For Singapore
Motilal Oswal Securities Ltd
3 August 2015
Motilal Oswal Tower, Level 9, Sayani Road, Prabhadevi, Mumbai 400 025
Phone: +91 22 3982 5500 E-mail: reports@motilaloswal.com
10