8 August 2015
1QFY16 Results Update | Sector:
Automobiles
BSE SENSEX
28,236
Bloomberg
Equity Shares (m)
M.Cap. (INR b) / (USD b)
52-Week Range (INR)
1, 6, 12 Rel. Per (%)
Avg Val,INRm/Vol‘000
Free float (%)
S&P CNX
8,565
MM IN
598.6
820.7/12.9
1441 / 1106
5/17/1
1343/1064
74.4
CMP: INR1,388
Mahindra & Mahindra
TP: INR1,408 (+2%)
Neutral
Above-est. EBITDA margins at 14.3% (v/s est. 12.2%) on the back of lower
commodity cost
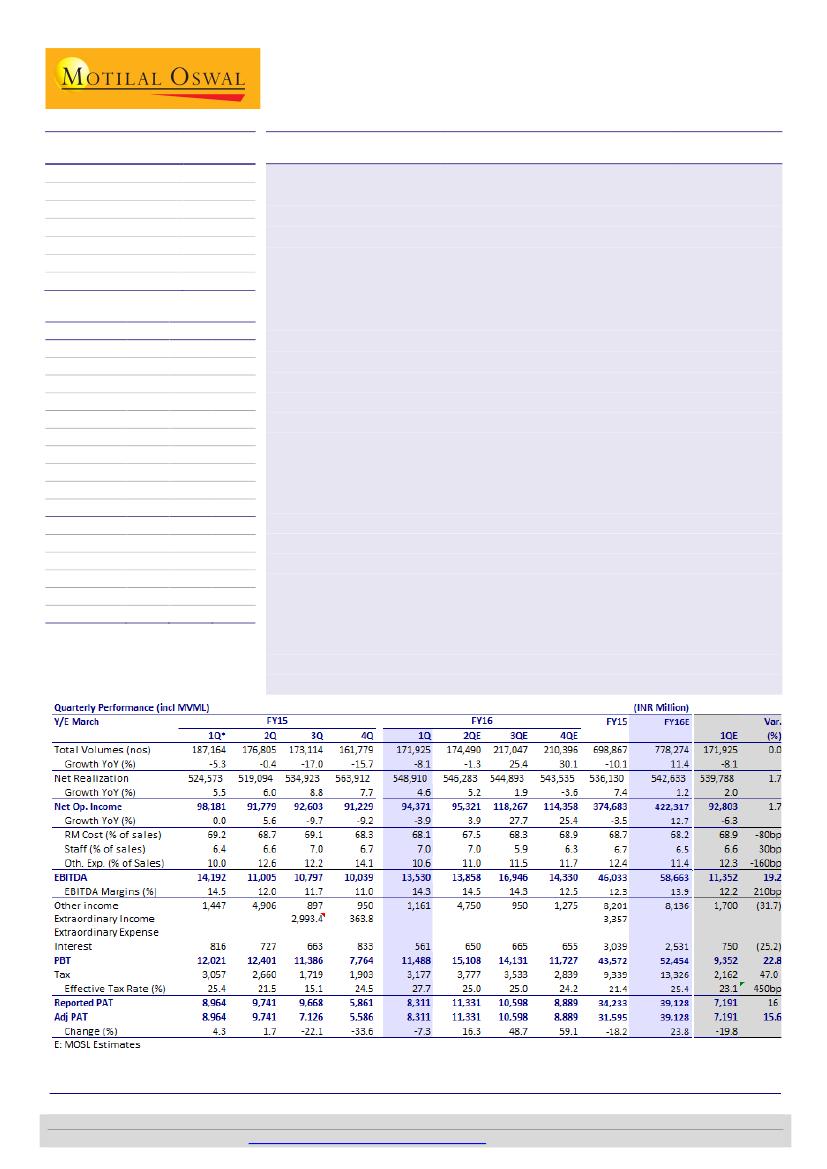
Volumes declined 8% YoY (up 6.3% QoQ), while realizations grew 4.6% YoY (down
2.7% QoQ) to ~INR549k (v/s est. ~INR540k)—driven by mix improvement. Net
revenue declined 3.9% YoY (up 3.4% QoQ) to INR94.3b (v/s est. INR92.8b). EBITDA
margin was up 330bp QoQ (down 20bp YoY) to 14.3% (v/s est. 12.2%), driven by
lower commodity cost and lower other expense. Auto segment PBIT margin
declined ~20bp YoY (up 150bp QoQ) to 10.3%. Tractor business PBIT margin was
up 60bp YoY (650bp QoQ) to 17.7%, highest since 3QFY11. Lower other income
and higher tax rate restricted adj. PAT to INR8.3b, down 7% YoY (up 49% QoQ).
Management commentary:
(a) It expects 5% growth in tractors for FY16, with
pressure continuing in 2QFY16 and 2HFY16 seeing volumes similar to 2HFY14
levels (implying ~35% growth in 2HFY16); b) in the automotive segment, inventory
has gone higher by one week compared with end of June (but has reduced by two
day days in July and the target is to reduce further by two days in August); c) TUV-
3OO would be launched in mid-September, and the company plans to launch S101
(crossover) in 2HFY16; d) in 1QFY16, there was a 1.8% YoY improvement in gross
margins (due to favorable mix and material cost benefit); e) recently launched SCV
Jeeto is targeted to do ~2,500 units/month; f) maintained guidance for capex of
~INR75b and investments of INR25b over three years.
Valuation and view:
We raise our standalone EPS estimates by 2.5%/2.7% for
FY16/FY17 on better-than-estimated margins, despite volume cut of 3.4% in FY16.
However, consolidated EPS of FY16/17 is cut by 4%/2%, impacted by estimate cut
for subsidiaries—particularly for Ssangong. The stock trades at 19.3x FY16E and
14.2x FY17E consolidated EPS. Valuations reflect structural challenges in both
businesses. Maintain
Neutral,
with FY17E-based SOTP target price of ~INR1,408.
Financials & Valuation (INR b)
y/e MAR
2015 2016E 2017E
Sales
389.5 440.0 532.1
EBITDA
41.7
53.1
66.5
NP (incl.MVML) 31.6
39.1
49.2
Adj. EPS (INR) * 52.8
65.4
82.2
EPS Gr. (%)
(18.2) 23.8
25.7
Cons.EPS (INR) 47.8
71.9
97.7
BV/Sh (INR)
326
374
438
RoE (%)
15.9
16.9
18.0
RoCE (%)
16.3
18.7
20.2
Payout (%)
25.5
27.6
22.1
Valuations
P/E (x)
26.3
21.2
16.9
Cons. P/E (x)
29.0
19.3
14.2
P/BV (x)
4.3
3.7
3.2
EV/EBITDA (x)
19.7
15.3
12.0
Div. Yield (%)
0.9
1.1
1.1
* Incl MVML
Jinesh Gandhi
(Jinesh@MotilalOswal.com); +91 22 3982 5416
Jay Shah
(Jay.Shah@MotilalOswal.com); +91 22 3078 4701
Investors are advised to refer through disclosures made at the end of the Research Report.
Motilal Oswal research is available on
www.motilaloswal.com/Institutional-Equities,
Bloomberg, Thomson Reuters, Factset and S&P Capital.