11 August 2015
1QFY16 Results Update | Sector: Oil & Gas
HPCL
BSE SENSEX
27,866
Bloomberg
Equity Shares (m)
M.Cap. (INR b) / (USD b)
52-Week Range (INR)
1, 6, 12 Rel. Per (%)
Avg Val (INRm)/Vol ‘000
Free float (%)
Financials & Valuation (INR b)
Y/E MAR
Sales
EBITDA
Adj. PAT
Adj. EPS (INR)
EPS Gr. (%)
BV/Sh.(INR)
RoE (%)
RoCE (%)
Payout (%)
Valuations
P/E (x)
P/BV (x)
EV/EBITDA (x)
Div. Yield (%)
Estimate change
TP change (%)
Rating change
n
11.8
2.0
7.8
2.6
9.7
1.8
6.0
3.1
9.4
1.6
5.6
3.2
n
n
2015 2016E 2017E
2,064 1,836 1,762
54.2
27.3
80.6
57.6
473
17.6
11.0
35.6
67.0
33.3
98.3
21.9
543
19.3
14.5
35.6
68.2
34.5
101.8
3.6
609
17.7
13.6
35.1
n
S&P CNX
8,462
HPCL IN
323/5.0
991/391
18/66/124
1174/1932
48.9
CMP: INR953
TP: INR1,190 (+25%)
Buy
Significant beat; subsidy fully compensated; expect re-rating with profit
339
normalization and sustained high RoEs
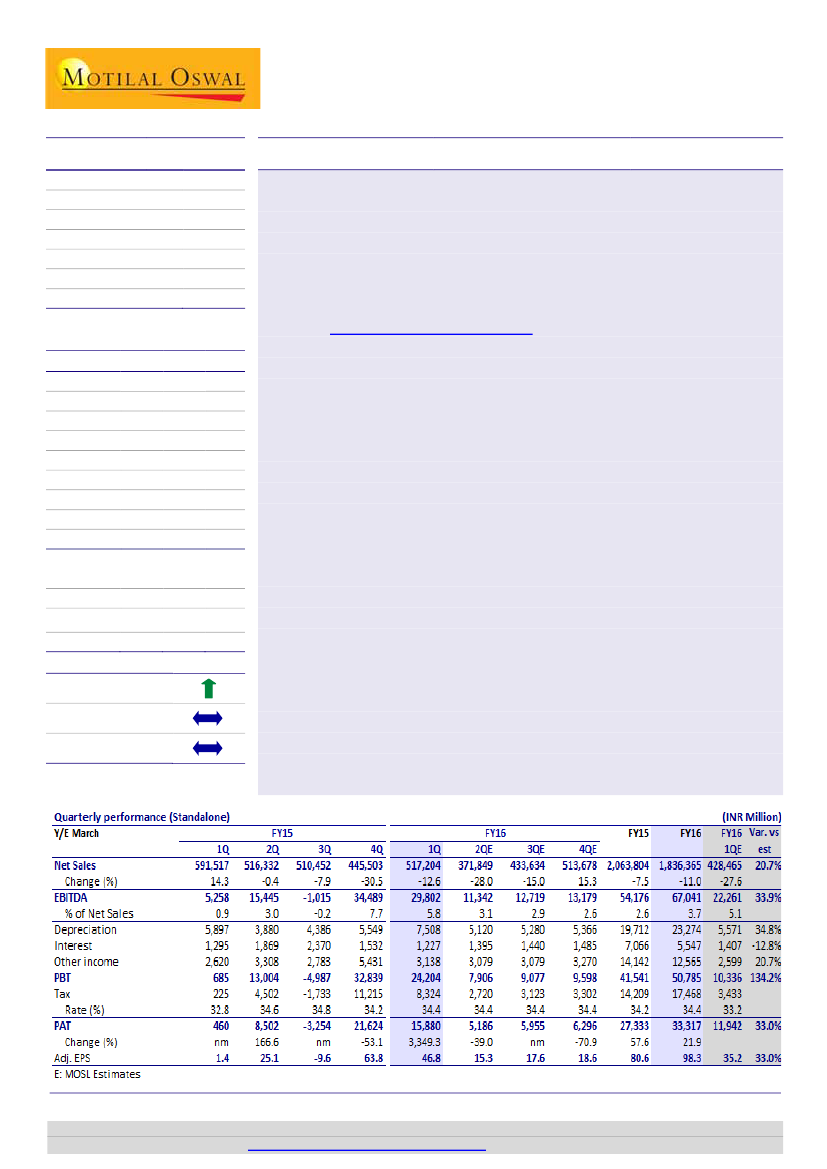
HPCL reported 1QFY16 EBITDA of INR29.8b (est. 22.3), led by GRM at USD8.6/bbl (est. 6.5)
and product inventory gain of INR5.8b. PAT stood at INR15.9b (est. 12b), implying EPS of
INR47/sh. While 2QFY16 could be moderate due to GRM/inventory fluctuations, we
believe HPCL is now a structural investment play—led by (a) higher earnings predictability
and (b) increase in profitability leading to higher RoEs. Commensurate re-rating is pending,
in our view (Refer
our report - OMCs in new era).
Maintain Buy.
n
Above estimates:
HPCL reported 1QFY16 EBITDA of INR29.8b, led by superior
(a) GRM at USD8.6/bbl (v/s USD2/bbl in 1QFY15 and USD7.47/bbl in 4QFY15),
(b) fully compensated subsidy and (c) product inventory gain of INR5.8b. We
estimate gross auto fuel (petrol/diesel) marketing margin of ~INR1.5/ltr in
1QFY16 (v/s INR3/ltr in 4QFY15). Impact of higher-than-estimated depreciation
(led by one-time charge of INR1.5b) was partly compensated by higher other
income, leading to a PAT of INR15.9b (EPS of INR47/sh).
OMCs received full subsidy for 1QFY16:
HPCL’s 1QFY16 gross under-recovery
stood at INR6.7b, of which upstream shared INR2.2b and government INR4.5b.
Similar to previous years, quarterly subsidy sharing is ad-hoc. In line with the
announced FY16 subsidy, we now model OMCs’ sharing at nil in FY16/FY17.
Mumbai shutdown impacts throughput; debt flat QoQ:
While, the marketing
sales stood at 8.6mmt (+3% YoY, +5% QoQ), refiney throughput at 3.8mmt
(+14.3% YoY, -15.7% QoQ) was impacted QoQ by shutdown in Mumbai. HPCL’s
gross debt as of 1QFY16 stands at INR180b (largely flat QoQ).
Of the three OMCs, HPCL’s earnings are more sensitive to a change in the
marketing margin—given its higher ratio of marketing-to-refining volume.
Hence, it would be the largest beneficiary of higher auto fuel margins.
Valuation and view:
We are increasing our FY16 earnings, led by actual 1QFY16
performance, by ~15%. We value HPCL at 5.5x for refining and 8x for marketing
to arrive at a fair value of INR1,190 implying a 25% upside. The stock trades at
9.4x FY17E EPS of INR102 and 1.6x FY17E BV. Maintain
Buy.
Harshad Borawake
(HarshadBorawake@MotilalOswal.com); +91 22 3982 5432
Investors are advised to refer through disclosures made at the end of the Research Report.
Motilal Oswal research is available on
www.motilaloswal.com/Institutional-Equities,
Bloomberg, Thomson Reuters, Factset and S&P Capital.

HPCL
Exhibit 1: HPCL Quarterly earnings snapshot (INRm)
1QFY15
Key Operating Metrics
Brent (USD/bbl)
Fx rate (INR/USD)
Marketing volume (mmt)
GRM (USD/bbl)
Reuters Singapore GRM (USD/bbl)
Refinery thr' put (mmt)
Financial Summary (INRm)
Net Sales
Adj. EBITDA
Refining (post USD1.8/bbl opex)
Marketing & others
EBITDA Margin (%)
Adventitious gain/(loss)
Net subsidy gain/(loss)
Forex gain/(loss)
Reported EBITDA
EBITDA Margin (%)
Depreciation
EBIT
Interest
Other Income
PBT b/f exceptionals
Exceptionals
PBT
Income Tax
Tax rate (%)
PAT
PAT margin (%)
EPS
109.7
59.8
8.3
2.0
5.8
3.3
2QFY15
102.0
60.5
7.4
2.1
4.8
4.5
3QFY15
77.0
61.9
8.1
(1.0)
6.3
4.0
4QFY15
55.2
62.2
8.2
7.5
8.6
4.5
1QFY16
61.9
63.7
8.6
8.6
8.0
3.8
YoY (%)
-44%
7%
3%
320%
39%
14%
QoQ (%)
12%
2%
5%
15%
-7%
-16%
591,517
15,517
347
15,170
2.6%
(8,310)
(4,949)
3,000
5,258
0.9%
(5,897)
(639)
(1,295)
2,620
685
685
(225)
32.8%
460
0.1%
1.4
516,332
10,256
654
9,602
2.0%
6,410
(81)
(1,140)
15,445
3.0%
(3,880)
11,565
(1,869)
3,308
13,004
13,004
(4,502)
34.6%
8,502
1.6%
25.1
510,452
17,225
(5,091)
22,316
3.4%
(18,000)
30
(270)
(1,015)
-0.2%
(4,386)
(5,401)
(2,370)
2,783
(4,987)
(4,987)
1,733
34.8%
(3,254)
-0.6%
(9.6)
445,503
33,339
11,566
21,772
7.5%
(430)
40
1,540
34,489
7.7%
(5,549)
28,940
(1,532)
5,431
32,839
32,839
(11,215)
34.2%
21,624
4.9%
63.8
517,204
24,499
11,901
12,598
4.7%
5,830
3
(530)
29,802
5.8%
(7,508)
22,294
(1,227)
3,138
24,204
24,204
(8,324)
34.4%
15,880
3.1%
46.8
-13%
58%
3332%
-17%
16%
-27%
3%
-42%
n.a.
n.a.
n.a.
467%
n.a.
-94%
n.a.
-14%
n.a.
n.a.
n.a.
20%
3432%
3432%
n.a.
3349%
n.a.
-23%
n.a.
-42%
-26%
-26%
n.a.
-27%
3349%
-27%
Source: Company, MOSL
Exhibit 2: Ad-hoc subsidy sharing resulting in volatile quarterly profits (INRb)
PAT
Net (under)/over recovery
Source: Company, MOSL
11 August 2015
2

HPCL
Exhibit 3: HPCL Marketing volume trend – up 3% YoY and 5% QoQ (mmt)
7.3
7.5
7.7
7.7
7.7
7.8
7.9
7.8
8.0
8.3
7.4
8.1
8.2
8.6
6.9
7.2
7.2
1Q
2Q
FY12
3Q
4Q
1Q
2Q
FY13
3Q
4Q
1Q
2Q
FY14
3Q
4Q
1Q
2Q
FY15
3Q
4Q
1Q
FY16
Source: Company, MOSL
Exhibit 4: HPCL GRM trend – 1QFY16 GRM at USD8.6/bbl (USD/bbl)
8.5
9.1
7.6
4.8
3.7
1.9
1.1
(2.1)
1.9
7.5
6.7
9.1
4.4
HPCL GRM
6.6
6.3 8.7
3.7
3.9
2.6
2.3
Singapore GRM
5.4
6.2
4.3
4.7
2.0
2.1
(1.0)
5.8
6.3
4.8
7.5
8.6
8.0
8.6
(In USD/bbl)
Source: Company, MOSL
Exhibit 5: HPCL refinery-wise throughput trend; up 14% YoY, down 16% QoQ (mmt)
Refinery thr'put (mmt)
4.0
2.2
4.2
4.1
4.0
1.9
3.6
2.0
1.6
1Q
3.7
1.5
2.2
2.4
1.7
2.0
1.7
1Q
Mumbai
4.2
4.4
3.4
Visakh
3.9
1.9
Total
3.8
1.9
4.4
3.3
2.3
1.9
2.0
4Q
1.4
1Q
2.0
1.9
3Q
FY15
2.0
2.5
2.0
2.4
4.5
4.0
4.5
3.8
2.1
2.3
2.2
1.8
1Q
1.9
2Q
1.8
3Q
FY12
2.1
2.1
2.0
2.0
2.0
3Q
FY14
1.6
1Q
FY16
4Q
2Q
FY13
3Q
4Q
2Q
2Q
4Q
Source: Company, MOSL
11 August 2015
3

HPCL
Exhibit 6: HPCL under recovery quarterly trend (INRb)
150
120
90
60
30
-
(30)
(60)
Upstream Sharing
95
47
71
91
107
Oil Bonds/Cash
83
87
Net Under/(over) recovery
85
58
82
92
92
66
52
36
11
7
Gross Under recovery
1Q
2Q
FY12
3Q
4Q
1Q
2Q
FY13
3Q
4Q
1Q
2Q
FY14
3Q
4Q
1Q
2Q
FY15
3Q
4Q
1Q
FY16
Source: Company, MOSL
Exhibit 7: Industry level gross under recoveries have come down sharply; LPG shifted to DBTL (INRb)
Gross under recoveries
HPCL + BPCL + IOCL (INRb)
436
70
66
299
-
1Q
325
215
63
60
92
-
2Q
FY12
65
73
187
-
3Q
406
87
78
241
-
4Q
478
115
73
290
-
1Q
378
70
71
236
-
2Q
FY13
393
110
77
207
-
3Q
362
105
75
182
-
4Q
254
85
64
105
-
1Q
Petrol
354
93
75
186
-
2Q
FY14
Diesel
398
127
85
185
-
3Q
393
159
82
152
-
4Q
287
121
75
90
-
1Q
224
125
73
26
-
2Q
FY15
PDS Kerosene
Domestic LPG
Total
159
103
64
-
(7)
3Q
53
17
36
-
4Q
39
-
39
-
1Q
FY16
Source: PPAC, Industry, MoPNG
Exhibit 8: HPCL reported nil under recoveries sharing led by full compensation from upstream companies
Source: Company, MOSL
Model OMC subsidy sharing at nil
n
n
n
We are revising our subsidy sharing assumption to model nil subsidy sharing by
OMC’s, govt. sharing of INR256/vyl in LPG and INR12/ltr in kerosene and the rest
to be borne by the upstream.
Government recently clarified that LPG DBTL subsidy will be borne by the
government to the extent of INR18/kg (~INR256/cylinder) and the rest will be
borne by the upstream companies. .
For Kerosene, government will give a subsidy of INR12/ltr and the rest will be
borne by the upstream companies.
11 August 2015
4

HPCL
Exhibit 9: Government has increased auto fuel excise duty sharply in last few quarters
Petrol excise duty (INR/ltr)
14.8 13.8 13.8 13.8 14.8 14.8 14.8
9.5
4.7
3.7
3.7
3.7
4.7
2.1
2.1
3.6
9.5
3.6
9.5
3.6
11.0
5.1
Diesel excise duty (INR/ltr)
13.3
6.1
15.4
8.2
17.5 17.5 17.5
10.3 10.3 10.3
*Ad-valorem duty in nil since Jan-08
Source: PPAC, MoPNG, MOSL
Exhibit 10: Auto Fuel Retail Price trend in India – Despite excise duty hikes, auto fuel prices
still below their peak levels
80
70
60
50
40
30
20
Aug-08
Aug-09
Aug-10
Aug-11
Aug-12
Aug-13
Aug-14
Aug-15
Diesel monthly
price hikes begin
Diesel
de-regulated
Gasoline price (INR/ltr)
Diesel price (INR/ltr)
Petrol
de-regulated
Source: PPAC, MoPNG, MOSL
11 August 2015
5

HPCL
Valuation and view
n
n
n
n
n
Widening Moat:
OMCs’ economic moat is widening, led by (1) scope for
meaningful increase in marketing margins and profitability, (2) slower ramp-up
by private marketers, (3) high volume growth, aided by expected GDP boost,
and (4) improving balance sheet with increasing cash flow.
OMCs profit normalization was delayed for a decade:
OMC’s deregulation and
in turn their profit normalization had been derailed for a decade after an earlier
brief de-regulation period in 2004-06. However, this time around we believe
government will stay put with its deregulation decision given the hard lessons of
financial stress of last decade. Increased excise duties offer some flexibility to
moderate prices in event of spike in oil prices, but huge and growing India
consumption volumes will make it practically impossible to again revisit the
price control model.
Marketing division to drive profitability:
Post de-regulation, we expect
marketing division profitability to grow rapidly, hence should also command a
higher valuation. An INR0.5/ltr increase in diesel marketing margin increases
HPCL’s FY16E EPS by 32%. We model gross per liter diesel margin of INR1.6/2.0
in FY16/FY17 (v/s earlier INR1.9/2.0).
Pure play marketing companies trade at higher valuations:
o
Pure play petroleum marketing companies - US based CST Brands (CST US;
M Cap: USD3b) and New Zealand based Z Energy (ZEL NZ; M Cap: USD1.5b)
trade (1 year forward basis) at 11x EV/EBITDA and 22x P/E on one year
forward basis.
o
These valuations (in-line with the underlying business dynamics) are more
similar to consumer business than refining or oil & gas businesses.
We are increasing our FY16 earnings led by actual 1QFY16 performance by
~15%. We value HPCL at 5.5x for refining and 8x for marketing to arrive at a fair
value of INR1,190 implying 25% upside. The stock trades at 9.4x FY17E EPS of
INR102 and 1.6x FY17E BV. Maintain
Buy.
Exhibit 11: HPCL – Key Assumptions
Exchange Rate (INR/USD)
Brent Crude (USD/bbl)
Market Sales (MMT)
GRM (USD/bbl)
HPCL Blended GRM
Reuters Singapore GRM
Prem/(disc)
Refinery throughput (mmt)
Total Refinery throughput (MMT)
YoY (%)
Refining capacity utilization (%)
Under recoveries Sharing (INRb)
Gross under recoveries
Net sharing
Net sharing (%)
FY09
45.8
84.8
25.4
5.17
5.75
(0.58)
16.5
-1.5%
118%
213
(0.0)
0%
FY10
47.5
69.6
26.3
2.97
3.55
(0.58)
16.3
-1.5%
116%
100
12.3
12%
FY11
45.7
86.5
27.0
4.47
5.18
(0.70)
15.8
-3.1%
106%
171
15.1
9%
FY12
47.9
114.5
29.5
5.20
8.17
(2.96)
16.1
1.9%
99%
304
0.1
0%
FY13
54.5
110.6
30.3
2.08
7.70
(5.62)
15.8
-1.4%
98%
362
2.3
1%
FY14
60.6
107.8
31.0
3.43
5.62
(2.19)
15.4
-2.6%
95%
325
4.8
1%
FY15E
61.1
86.0
31.9
2.84
6.36
(3.52)
16.4
6.3%
101%
164
5.0
3%
FY16E
64.0
60.0
32.8
5.50
6.69
(1.19)
15.7
-4.1%
97%
FY17E
65.0
65.0
33.8
5.00
7.00
(2.00)
16.3
3.7%
101%
FY18E
65.0
70.0
34.8
5.25
7.00
(1.75)
16.5
1.2%
102%
33
34
35
-
-
-
0%
0%
0%
Source: Company, MOSL
11 August 2015
6

HPCL
Story in charts
Exhibit 12: HPCL’s GRMs have underperformed Singapore
GRM (USD/bbl)
Prem/(Disc) to Singapore
Singapore GRM
5.8
5.2
(0.6)
3.6
3.0
(0.6)
5.2
4.5
(0.7)
5.2
2.1
(3.0)
(5.6)
FY09
FY10
FY11
FY12
FY13
8.2
7.7
HPCL Blended GRM
5.6
3.4
(2.2)
6.4
6.7
5.5
(1.2)
7.0
5.0
(2.0)
25
26
27
Exhibit 13: While refining capacity has been largely flat,
marketing sales have shown steady increase
Marketing Sales (mmt)
29
30
Refinery Throughput (mmt)
34
33
32
31
2.8
(3.5)
17
16
16
16
16
15
16
16
16
FY14 FY15E FY16E FY17E
Source: Company, MOSL
FY09
FY11
FY13
FY15E
FY17E
Source: Company, MOSL
Exhibit 14: HPCL FY14 EBITDA and PAT boosted by product
inventory gains and lower interest cost
EBIDA (INRb)
PAT (INRb)
67
52
29
25
33
34
9
6
FY09
13
15
FY11
39
27
17
9
FY13
FY15E
FY17E
54
33
35
68
Exhibit 15: Expect D/E ratio to decline with increasing
profitability (x)
D/E Ratio
2.1
1.8
2.0
2.3
2.4
2.1
1.1
1.0
0.9
FY09
FY11
FY13
FY15E
FY17E
Source: Company, MOSL
Exhibit 16: Diesel deregulation to reduce working capital
leading to lower interest costs
21
Total Debt (INRb)
17
18
15
Interest Cost (INRb)
Exhibit 17: HPCL: 1 Year Forward P/E Chart
30
23
16
P/E (x)
5 Yrs Avg(x)
15 Yrs Avg(x)
10 Yrs Avg(x)
9
9
7
298
FY12
325
FY13
319
171
6
180
5
180
9
2
9.3
8.4
9.5
10.2
228
FY09
213
FY10
250
FY11
FY14 FY15E FY16E FY17E
Source: Company, MOSL
11 August 2015
7

HPCL
Financials and valuations
Income Statement
Y/E March
Net Sales
Finished Goods
Raw Materials Cons
Employee cost
Other Exp
EBITDA
% of Net Sales
Depreciation
Interest
Other Income
Extraordinary Items (net)
PBT
Tax
Total Rate (%)
PAT
Adjusted PAT
% of Net Sales
Change (%)
2010
2011
2012
2013
2014
2015
2016E
2017E
1,092,084 1,309,342 1,781,392 2,065,293 2,231,454 2,063,804 1,836,365 1,762,244
642,488
843,135 1,093,707 1,281,786 1,451,380 1,292,784 1,179,131 1,053,425
344,776
366,443
561,189
639,921
613,881
599,079
502,035
570,022
16,173
20,172
15,831
25,256
20,303
24,147
27,769
31,934
63,215
46,505
76,583
78,907
93,809
93,618
60,390
38,647
25,432
33,088
34,082
39,424
52,081
54,176
67,041
68,216
2.3
2.5
1.9
1.9
2.3
2.6
3.7
3.9
11,644
14,070
17,129
19,315
21,884
19,712
23,274
25,809
9,038
8,840
16,977
18,377
15,046
7,066
5,547
5,400
16,462
13,435
12,222
12,300
11,004
14,142
12,565
14,655
38
-152
-5
714
0
0
0
0
21,250
23,461
12,192
14,746
26,155
41,541
50,785
51,662
8,237
8,071
3,077
5,699
8,817
14,209
17,468
17,161
38.8
34.4
25.2
38.6
33.7
34.2
34.4
33.2
13,014
15,390
9,115
9,047
17,338
27,333
33,317
34,501
13,014
15,390
9,115
9,047
17,338
27,333
33,317
34,501
1.2
1.2
0.5
0.4
0.8
1.3
1.8
2.0
198.8
18.3
-40.8
-0.7
91.6
57.6
21.9
3.6
(INR Million)
2018E
1,887,519
1,116,288
616,537
34,169
41,419
79,105
4.2
27,853
5,400
15,088
60,939
20,242
33.2
40,696
40,696
2.2
18.0
(INR Million)
2018E
3,390
229,632
233,022
180,000
52,296
465,318
607,624
267,188
340,436
8,000
112,415
320,586
124,507
43,403
80,811
67,434
4,432
318,641
284,154
34,487
1,946
462,796
Balance Sheet
Y/E March
Share Capital
Reserves
Net Worth
Loans
Deferred Tax
Capital Employed
Gross Fixed Assets
Less: Depreciation
Net Fixed Assets
Capital WIP
Investments
Curr. Assets, L & Adv.
Inventory
Debtors
Cash & Bank Balance
Loans & Advances
Other Current Assets
Current Liab. & Prov.
Liabilities
Provisions
Net Current Assets
Application of Funds
2010
3,390
112,190
115,580
213,024
18,080
346,683
249,884
96,817
153,067
38,876
113,873
206,419
125,792
24,373
2,431
52,585
1,237
165,552
144,499
21,053
40,867
346,683
2011
3,390
122,068
125,458
250,212
31,956
407,626
296,484
110,039
186,445
37,987
113,350
265,910
166,223
26,544
800
71,358
985
196,066
178,018
18,048
69,844
407,626
2012
3,390
127,835
131,225
298,312
30,853
460,390
334,590
126,094
208,496
44,445
103,705
354,427
194,545
35,652
2,264
116,484
5,483
250,683
230,847
19,836
103,744
460,390
2013
3,390
133,874
137,264
324,583
35,984
497,830
370,062
144,575
225,487
51,729
106,269
378,962
164,387
49,350
1,471
160,008
3,745
264,617
241,622
22,995
114,345
497,830
2014
3,390
146,732
150,122
319,301
39,084
508,506
424,668
165,545
259,122
45,856
108,598
362,204
187,754
54,660
347
114,693
4,750
267,275
243,978
23,296
94,930
508,506
2015
3,390
156,831
160,221
170,556
41,036
371,813
469,769
190,252
279,517
45,856
112,415
237,719
129,723
36,031
171
67,364
4,432
303,693
273,903
29,790
-65,974
371,813
2016E
3,390
180,810
184,200
180,000
41,036
405,236
520,624
213,526
307,098
30,000
112,415
264,673
120,529
42,226
30,052
67,434
4,432
311,471
280,191
31,279
-46,798
402,715
2017E
3,390
203,214
206,604
180,000
46,202
432,806
577,624
239,335
338,289
8,000
112,415
282,000
117,400
40,522
52,213
67,434
4,432
310,420
277,575
32,844
-28,419
430,285
11 August 2015
8

HPCL
Financials and valuations
Ratios
Y/E March
Basic (INR)
EPS
Cash EPS
Book Value
DPS
Payout (incl. Div. Tax.)
Valuation (x)
P/E
Cash P/E
EV / EBITDA
EV / Sales
Price / Book Value
Dividend Yield (%)
Profitability Ratios (%)
RoE
RoCE
Turnover Ratios
Debtors (No. of Days)
Asset Turnover (x)
Leverage Ratio
Debt / Equity (x)
2010
38.4
113.4
340.9
12.0
36.1
2011
45.4
143.0
370.1
14.0
36.1
2012
26.9
127.4
387.1
8.5
37.0
2013
26.7
143.0
404.9
8.5
37.3
2014
51.1
204.8
442.8
15.5
35.5
2015
80.6
240.4
472.6
24.5
35.6
2016E
98.3
296.0
543.3
29.9
35.6
2017E
101.8
303.0
609.4
30.5
35.1
2018E
120.0
353.4
687.4
36.0
35.1
35.4
7.5
16.0
0.3
2.5
0.9
18.6
4.7
11.0
0.3
2.2
1.6
11.8
4.0
7.8
0.2
2.0
2.6
9.7
3.2
6.0
0.2
1.8
3.1
9.4
3.1
5.6
0.2
1.6
3.2
7.9
2.7
4.6
0.2
1.4
3.8
11.7
8.7
12.8
8.6
7.1
6.7
6.7
6.8
12.1
8.2
17.6
11.0
19.3
14.5
17.7
13.6
18.5
14.8
7.8
4.8
7.1
4.8
6.4
5.6
7.5
5.9
8.5
5.6
8.0
4.6
7.8
3.7
8.6
3.2
8.1
3.2
1.8
2.0
2.3
2.4
2.1
1.1
1.0
0.9
0.8
Cash Flow Statement
Y/E March
OP/(Loss) before Tax
Depreciation
Other op
Interest Paid
Direct Taxes Paid
(Inc)/Dec in Wkg. Capital
CF from Op. Activity
(Inc)/Dec in FA & CWIP
Free Cash Flow
(Pur)/Sale of Investments
Inc from Invst
CF from Inv. Activity
Inc / (Dec) in Debt
Interest paid & other Inv
Dividends Paid
CF from Fin. Activity
Inc / ( Dec) in Cash
Add: Op. Balance
Bank Balance Adj.
Closing Balance
E:MOSL Estimates
2010
21,250
11,679
-5,715
16,075
-3,946
-6,530
32,814
-36,180
-3,366
16,601
8,037
-11,542
-9,781
-11,224
-2,093
-23,097
-1,825
6,083
-1,826
2,431
2011
23,461
14,082
-2,456
6,457
-5,645
-25,876
10,024
-46,101
-36,077
5,371
6,919
-33,810
30,408
-8,933
-4,731
16,744
-7,042
2,431
5,410
800
2012
12,192
17,129
-5,407
21,392
-2,715
-27,301
15,291
-41,359
-26,068
6,378
6,345
-28,636
37,919
-14,836
-5,509
17,574
4,229
800
-2,766
2,264
2013
14,746
19,344
-10,771
20,193
-1,072
-30,945
11,496
-36,807
-25,312
-2,404
5,505
-33,706
37,072
-22,187
-3,344
11,540
-10,670
2,264
9,877
1,471
2014
26,155
21,884
-1,556
13,364
-3,668
21,121
77,301
-41,358
35,943
-1,297
4,906
-37,748
2015
41,541
19,712
17,178
7,066
-14,209
137,207
208,495
-45,101
163,394
-3,816
5,774
-43,144
2016E
50,785
23,274
-6,564
5,547
-17,468
10,705
66,279
-35,000
31,279
0
6,564
-28,436
9,444
-5,547
-11,859
-7,962
29,881
171
0
30,052
2017E
51,662
25,809
-8,603
5,400
-11,995
3,782
66,055
-35,000
31,055
0
8,603
-26,397
0
-5,400
-12,097
-17,497
22,161
30,052
0
52,213
(INR Million)
2018E
60,939
27,853
-10,480
5,400
-14,148
-1,767
67,796
-30,000
37,796
0
10,480
-19,520
0
-5,400
-14,278
-19,678
28,598
52,213
0
80,811
-25,648 -148,744
-17,045
-7,066
-3,367
-9,717
-46,060 -165,527
-6,507
1,471
5,383
347
-176
347
0
171
11 August 2015
9

HPCL
Corporate profile: HPCL
Company description
Fortune-500 company, HPCL is a refining and
marketing company in India and also has interests
in upstream. It owns 14.8mmt of refining capacity,
split across Mumbai (6.5mmt) and Vishakapatnam
(8.3mmt). It has a crude and product pipeline
network of ~2,400km and sells ~30mmt of
petroleum products. HPCL also holds a 16.9% stake
in MRPL and 49% stake in 9mmt Bhatinda refinery.
HPCL is a state-owned company, with 51.1%
Government of India (GoI) stake.
Exhibit 18: Sensex rebased
1,100
900
700
500
300
Aug-14
Nov-14
Feb-15
May-15
Aug-15
HPCL
Sensex - Rebased
Exhibit 19: Shareholding pattern (%)
Jun-15
Promoter
DII
FII
Others
51.1
15.5
18.9
14.6
Mar-15
51.1
16.4
18.5
14.0
Jun-14
51.1
20.6
12.5
15.8
Exhibit 20: Top holders
Holder Name
Life Insurance Corporation India Affiliates
HDFC Standard Life Insurance Company Ltd
National Westminster Bank PLC as Trustee
Government Pension Fund Global
% Holding
4.0
1.6
1.3
1.2
Note: FII Includes depository receipts
Exhibit 21: Top management
Name
Nishi Vasudeva
Designation
Chairman & Managing Director
Exhibit 22: Directors
Name
Nishi Vasudeva
Sandeep Poundrik
K V Rao
Nishi Vasudeva
*Independent
Name
Y K Gawali
B K Namdeo
Gitesh K Shah*
Exhibit 23: Auditors
Name
B K Khare & Co
CVK & Associates
G M Kapadia & Co
CMA Rohit J Vora
R Nanabhoy & Co
Sriramamurthy & Co
Type
Statutory
Statutory
Statutory
Cost Auditor
Cost Auditor
Branch
Exhibit 24: MOSL forecast v/s consensus
EPS
(INR)
FY16
FY17
MOSL
forecast
98.3
101.8
Consensus
forecast
63.9
74.1
Variation
(%)
53.9
37.4
11 August 2015
10

HPCL
NOTES
11 August 2015
11

HPCL
This document has been prepared by Motilal Oswal Securities Limited (hereinafter referred to as Most) to provide information about the company(ies) and/sector(s), if any, covered in the report and may be distributed
by it and/or its affiliated company(ies). This report is for personal information of the selected recipient/s and does not construe to be any investment, legal or taxation advice to you. This research report does not
constitute an offer, invitation or inducement to invest in securities or other investments and Motilal Oswal Securities Limited (hereinafter referred as MOSt) is not soliciting any action based upon it. This report is not for
public distribution and has been furnished to you solely for your general information and should not be reproduced or redistributed to any other person in any form. This report does not constitute a personal
recommendation or take into account the particular investment objectives, financial situations, or needs of individual clients. Before acting on any advice or recommendation in this material, investors should consider
whether it is suitable for their particular circumstances and, if necessary, seek professional advice. The price and value of the investments referred to in this material and the income from them may go down as well as
up, and investors may realize losses on any investments. Past performance is not a guide for future performance, future returns are not guaranteed and a loss of original capital may occur.
MOSt and its affiliates are a full-service, integrated investment banking, investment management, brokerage and financing group. We and our affiliates have investment banking and other business relationships with a
some companies covered by our Research Department. Our research professionals may provide input into our investment banking and other business selection processes. Investors should assume that MOSt and/or
its affiliates are seeking or will seek investment banking or other business from the company or companies that are the subject of this material and that the research professionals who were involved in preparing this
material may educate investors on investments in such business. The research professionals responsible for the preparation of this document may interact with trading desk personnel, sales personnel and other
parties for the purpose of gathering, applying and interpreting information. Our research professionals are paid on the profitability of MOSt which may include earnings from investment banking and other business.
MOSt generally prohibits its analysts, persons reporting to analysts, and members of their households from maintaining a financial interest in the securities or derivatives of any companies that the analysts cover.
Additionally, MOSt generally prohibits its analysts and persons reporting to analysts from serving as an officer, director, or advisory board member of any companies that the analysts cover. Our salespeople, traders,
and other professionals or affiliates may provide oral or written market commentary or trading strategies to our clients that reflect opinions that are contrary to the opinions expressed herein, and our proprietary
trading and investing businesses may make investment decisions that are inconsistent with the recommendations expressed herein. In reviewing these materials, you should be aware that any or all of the foregoing
among other things, may give rise to real or potential conflicts of interest. MOSt and its affiliated company(ies), their directors and employees and their relatives may; (a) from time to time, have a long or short position
in, act as principal in, and buy or sell the securities or derivatives thereof of companies mentioned herein. (b) be engaged in any other transaction involving such securities and earn brokerage or other compensation
or act as a market maker in the financial instruments of the company(ies) discussed herein or act as an advisor or lender/borrower to such company(ies) or may have any other potential conflict of interests with
respect to any recommendation and other related information and opinions.; however the same shall have no bearing whatsoever on the specific recommendations made by the analyst(s), as the recommendations
made by the analyst(s) are completely independent of the views of the affiliates of MOSt even though there might exist an inherent conflict of interest in some of the stocks mentioned in the research report
Reports based on technical and derivative analysis center on studying charts company's price movement, outstanding positions and trading volume, as opposed to focusing on a company's fundamentals and, as
such, may not match with a report on a company's fundamental analysis. In addition MOST has different business segments / Divisions with independent research separated by Chinese walls catering to different set
of customers having various objectives, risk profiles, investment horizon, etc, and therefore may at times have different contrary views on stocks sectors and markets.
Unauthorized disclosure, use, dissemination or copying (either whole or partial) of this information, is prohibited. The person accessing this information specifically agrees to exempt MOSt or any of its affiliates or
employees from, any and all responsibility/liability arising from such misuse and agrees not to hold MOSt or any of its affiliates or employees responsible for any such misuse and further agrees to hold MOSt or any of
its affiliates or employees free and harmless from all losses, costs, damages, expenses that may be suffered by the person accessing this information due to any errors and delays. The information contained herein is
based on publicly available data or other sources believed to be reliable. Any statements contained in this report attributed to a third party represent MOSt’s interpretation of the data, information and/or opinions
provided by that third party either publicly or through a subscription service, and such use and interpretation have not been reviewed by the third party. This Report is not intended to be a complete statement or
summary of the securities, markets or developments referred to in the document. While we would endeavor to update the information herein on reasonable basis, MOSt and/or its affiliates are under no obligation to
update the information. Also there may be regulatory, compliance, or other reasons that may prevent MOSt and/or its affiliates from doing so. MOSt or any of its affiliates or employees shall not be in any way
responsible and liable for any loss or damage that may arise to any person from any inadvertent error in the information contained in this report. MOSt or any of its affiliates or employees do not provide, at any time,
any express or implied warranty of any kind, regarding any matter pertaining to this report, including without limitation the implied warranties of merchantability, fitness for a particular purpose, and non-infringement.
The recipients of this report should rely on their own investigations.
This report is intended for distribution to institutional investors. Recipients who are not institutional investors should seek advice of their independent financial advisor prior to taking any investment decision based on
this report or for any necessary explanation of its contents.
Most and it’s associates may have managed or co-managed public offering of securities, may have received compensation for investment banking or merchant banking or brokerage services, may have received any
compensation for products or services other than investment banking or merchant banking or brokerage services from the subject company in the past 12 months.
Most and it’s associates have not received any compensation or other benefits from the subject company or third party in connection with the research report.
Subject Company may have been a client of Most or its associates during twelve months preceding the date of distribution of the research report
MOSt and/or its affiliates and/or employees may have interests/positions, financial or otherwise of over 1 % at the end of the month immediately preceding the date of publication of the research in the securities
mentioned in this report. To enhance transparency, MOSt has incorporated a Disclosure of Interest Statement in this document. This should, however, not be treated as endorsement of the views expressed in the
report.
Motilal Oswal Securities Limited is registered as a Research Analyst under SEBI (Research Analyst) Regulations, 2014. SEBI Reg. No. INH000000412
There are no material disciplinary action that been taken by any regulatory authority impacting equity research analysis activities
Analyst Certification
The views expressed in this research report accurately reflect the personal views of the analyst(s) about the subject securities or issues, and no part of the compensation of the research analyst(s) was, is, or will be
directly or indirectly related to the specific recommendations and views expressed by research analyst(s) in this report. The research analysts, strategists, or research associates principally responsible for preparation
of MOSt research receive compensation based upon various factors, including quality of research, investor client feedback, stock picking, competitive factors and firm revenues
Disclosure of Interest Statement
§
Analyst ownership of the stock
§
Served as an officer, director or employee
HPCL
No
No
Disclosures
A graph of daily closing prices of securities is available at www.nseindia.com and http://economictimes.indiatimes.com/markets/stocks/stock-quotes
Regional Disclosures (outside India)
For U.S.
This report is not directed or intended for distribution to or use by any person or entity resident in a state, country or any jurisdiction, where such distribution, publication, availability or use would be contrary to law,
regulation or which would subject MOSt & its group companies to registration or licensing requirements within such jurisdictions.
Motilal Oswal Securities Limited (MOSL) is not a registered broker - dealer under the U.S. Securities Exchange Act of 1934, as amended (the"1934 act") and under applicable state laws in the United States. In
addition MOSL is not a registered investment adviser under the U.S. Investment Advisers Act of 1940, as amended (the "Advisers Act" and together with the 1934 Act, the "Acts), and under applicable state laws in the
United States. Accordingly, in the absence of specific exemption under the Acts, any brokerage and investment services provided by MOSL, including the products and services described herein are not available to or
intended for U.S. persons.
This report is intended for distribution only to "Major Institutional Investors" as defined by Rule 15a-6(b)(4) of the Exchange Act and interpretations thereof by SEC (henceforth referred to as "major institutional
investors"). This document must not be acted on or relied on by persons who are not major institutional investors. Any investment or investment activity to which this document relates is only available to major
institutional investors and will be engaged in only with major institutional investors. In reliance on the exemption from registration provided by Rule 15a-6 of the U.S. Securities Exchange Act of 1934, as amended (the
"Exchange Act") and interpretations thereof by the U.S. Securities and Exchange Commission ("SEC") in order to conduct business with Institutional Investors based in the U.S., MOSL has entered into a chaperoning
agreement with a U.S. registered broker-dealer, Motilal Oswal Securities International Private Limited. ("MOSIPL"). Any business interaction pursuant to this report will have to be executed within the provisions of this
chaperoning agreement.
The Research Analysts contributing to the report may not be registered /qualified as research analyst with FINRA. Such research analyst may not be associated persons of the U.S. registered broker-dealer, MOSIPL,
and therefore, may not be subject to NASD rule 2711 and NYSE Rule 472 restrictions on communication with a subject company, public appearances and trading securities held by a research analyst account.
Motilal Oswal Capital Markets Singapore Pte Limited is acting as an exempt financial advisor under section 23(1)(f) of the Financial Advisers Act(FAA) read with regulation 17(1)(d) of the Financial Advisors
Regulations and is a subsidiary of Motilal Oswal Securities Limited in India. This research is distributed in Singapore by Motilal Oswal Capital Markets Singapore Pte Limited and it is only directed in Singapore to
accredited investors, as defined in the Financial Advisers Regulations and the Securities and Futures Act (Chapter 289), as amended from time to time.
In respect of any matter arising from or in connection with the research you could contact the following representatives of Motilal Oswal Capital Markets Singapore Pte Limited:
Kadambari Balachandran
Email : kadambari.balachandran@motilaloswal.com
Contact : (+65) 68189233 / 65249115
Office Address : 21 (Suite 31),16 Collyer Quay,Singapore 04931
For Singapore
11 August 2015
Motilal Oswal Securities Ltd
Motilal Oswal Tower, Level 9, Sayani Road, Prabhadevi, Mumbai 400 025
Phone: +91 22 3982 5500 E-mail: reports@motilaloswal.com
12