11 August 2015
1QFY16 Results Update | Sector:
Media
Hathway Cable & Datacom
BSE SENSEX
27,866
Bloomberg
Equity Shares (m)
M.Cap. (INR b) / (USD b)
52-Week Range (INR)
1, 6, 12 Rel. Per (%)
Avg Val (INRm)/Vol ‘000
Free float (%)
S&P CNX
8,462
HATH IN
830.5
40.1/0.6
77/46
0/-20/-25
37/281
56.5
CMP: INR48
n
TP: INR70 (+46%)
Buy
EBITDA in line; subscription miss offset by placement/broadband
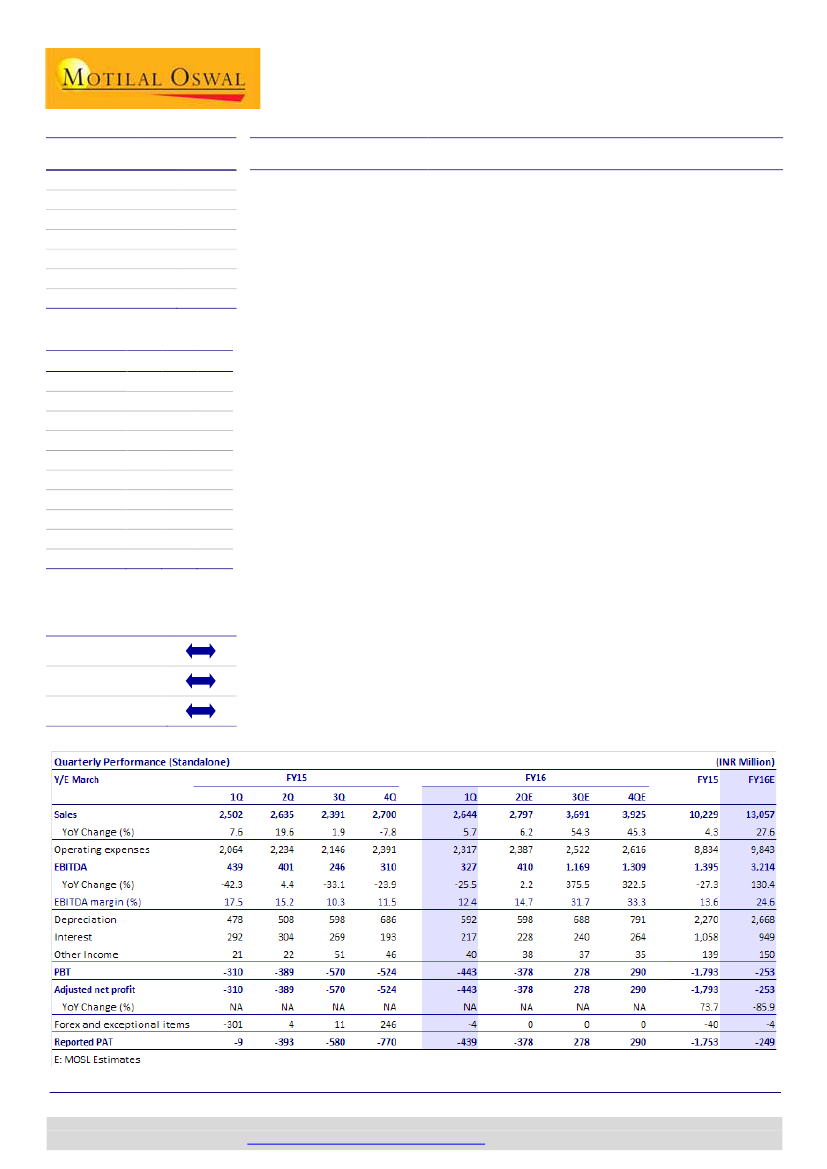
1QFY16 EBITDA in line:
Hathway’s 1QFY16 standalone EBITDA grew 6% QoQ to
INR327m (v/s estimate of INR331m). Adjusted for activation revenue, EBITDA
grew 9% QoQ to INR273m (v/s estimate of INR271m). Standalone revenue
declined 2% QoQ to INR2.64b, broadly in line. Cable subscription revenue
remained flat QoQ (net of feed income) at INR1.05b (v/s estimate of INR1.09b).
Placement/broadband revenue increased 8%/13% QoQ and was 7%/3% above
estimates. The management estimates consolidated EBITDA at ~INR410m.
Margin in line despite impact of lower other revenue and license fee provision:
EBITDA margin (ex-activation) stood at 10.3%, broadly in line, despiteINR38m
decline in ‘other revenue’ and INR52m provision toward license fee for
broadband business (8% of revenue). Reported content cost grew 9% YoY but
declined 13% QoQ to INR933m (v/s our estimate of INR971m). However,
adjusted for the feed income in 4QFY15, content cost was flat QoQ.
STB seeding remains muted; standalone net debt at INR10.4b:
Set-top box (STB)
seeding remained muted, with additions of 0.1m. Since March 2014, HATH has
cumulatively seeded ~0.6m STBs, largely on a voluntary basis. Standalone gross
debt stands at INR11.37b while net debt stands at INR10.41b. HATH currently
has an inventory of 0.5m STBs and has tied up financing for the phase III rollout.
Continued strong revenue growth in Broadband (BB):
Broadband revenue grew
56% YoY and 13% QoQ to INR651m (v/s our estimate of INR635m). Broadband
revenue growth continues to be largely led by ARPU increase. Of the 0.46m BB
subscribers, 0.17m are now on the DOCSIS 3.0 platform.
Valuation and view:
We expect digital subscriber base to increase from 8.5m in
FY15 to 14.6m in FY18, driving 31% CAGR in net ARPU (from INR55 to INR124)
and 100%+ CAGR in recurring EBITDA/subscriber (from INR6 to INR52). We
maintain our estimates and DCF-based target price of INR70. HATH trades at
proportionate EV/recurring EBITDA of 27.2x/12.6x FY16E/FY17E. Maintain
Buy.
Financials & Valuation (INR Billion)
Y/E MAR
Net Sales
EBITDA
EBITDA #
Adj. NP
Adj. EPS (INR)
Adj. EPS Gr. (%)
P/E (x)
EV/EBITDA (x)*
EV/EBITDA(x)*#
2015 2016E 2017E
18.3
2.6
1.7
-2.3
-2.9
NA
25.2
38.6
21.7
4.9
2.5
-0.5
-0.6
28.5
8.6
5.5
1.8
2.1
22.8
8.0
12.6
n
n
NA -460.5
14.0
27.2
-16.7 -82.2
EV/Sub (INR)* 5,527 5,013 4,847
* Based on attributable EBITDA and
subs post minority stake
# (ex-activation)
Estimate change
TP change
Rating change
n
n
Shobhit Khare
(Shobhit.Khare@MotilalOswal.com); +91 22 3982 5428
Jay Gandhi
(Jay.Gandhi@MotilalOswal.com); +91 22 3089 6693
Investors are advised to refer through disclosures made at the end of the Research Report.
Motilal Oswal research is available on
www.motilaloswal.com/Institutional-Equities,
Bloomberg, Thomson Reuters, Factset and S&P Capital.

Hathway Cable & Datacom
Exhibit 1: Hathway: Standalone quarterly performance vs estimates (INR m)
Revenue
-Cable subscription
-Carriage and Placement
-Activation
-Broadband
-Others
Operating costs
-Pay channel cost
-Employee cost
-Other costs
EBITDA
EBITDA margin (%)
EBITDA ex-activation
EBITDA margin ex-activation (%)
Depreciation and amortization
Other income
Finance cost
Forex loss (gain)
Exceptional items
Prior period adjustments
PBT
PAT
Subscriber metrics
Cable universe (m)
Digital subs (m)
Broadband subs (m)
1QFY15
2,502
1,110
782
89
416
105
2,064
858
146
1,060
439
17.5
350
14.0
478
21
292
-16
-289
4
-9
-9
11.7
8.2
0.4
4QFY15
2,700
1,207
775
58
577
83
2,391
1,073
170
1,147
310
11.5
252
9.3
686
46
193
-6
250
1
-770
-770
11.8
8.5
0.5
1QFY16
2,644
1,055
838
55
651
45
2,317
933
172
1,212
327
12.4
273
10.3
592
40
217
-1
0
-3
-439
-439
11.8
8.6
0.5
YoY (%)
6
-5
7
-38
56
-57
12
9
18
14
-25
-515bps
-22
-364bps
24
94
-25
NA
NA
-168
4673
4673
0.9
5.5
9.5
QoQ (%)
-2
-13
8
-5
13
-46
-3
-13
1
6
6
91bps
9
101bps
-14
-13
12
-78
NA
-330
-43
-43
0.0
1.2
2.2
Source: Company, MOSL
1QFY16E
2,676
1,088
783
60
635
110
2,345
971
169
1,205
331
12.4
271
10.1
556
16
298
0
0
0
-507
-507
vs est (%)
-1
-3
7
-8
3
-59
-1
-4
2
1
-1
1bps
1
21bps
7
150
-27
NA
NA
NA
-13
-13
Exhibit 2: Summary of estimate change (INR b)
FY16E
Cable subscription revenue
Old
New
Change (%)
Revenue
Old
New
Change (%)
EBITDA
Old
New
Change (%)
EBITDA (ex-activation)
Old
New
Change (%)
Adjusted PAT
Old
New
Change (%)
-0.5
-0.5
0.0
1.8
1.8
0.0
4.2
4.2
0.0
2.5
2.5
0.0
5.5
5.5
0.0
10.9
10.9
0.0
4.9
4.9
0.0
8.6
8.6
0.0
12.1
12.1
0.0
21.7
21.7
0.0
28.5
28.5
0.0
35.0
35.0
0.0
9.6
9.6
0.0
14.1
14.1
0.0
21.5
21.5
0.0
FY17E
FY18E
Source: Company, MOSL
11 August 2015
2

Hathway Cable & Datacom
Story in charts
Exhibit 3: Platform-wise industry ARPU (FY15E-18E)
Exhibit 4: India Pay TV subscription revenue split (INR b)
Analogue Cable
Digital Cable
DTH
Other Digital
Total Subscription Revenue
529
346
23
123
67
132
FY15E
Source: MOSL
389
24
151
86
128
FY16E
447
24
198
124
102
FY17E
24
259
180
66
FY18E
Source: MOSL
Exhibit 5: India: TV and C&S households (m)
300
250
200
150
100
50
0
FY11 FY12 FY13 FY14 FY15 FY16E FY17E FY18E
Source: MOSL
105
236
142
238
148
241
153
130
243
161
139
245
169
149
247
177
158
249
185
166
251
193
174
Exhibit 6: C&S connections mix: Analog v/s Digital (%)
Analogue Cable (%)
DTH (%)
8
27
5
62
7
26
5
62
7
26
15
53
6
27
18
49
FY14
7
27
19
47
Digital Cable (%)
Other Digital HH (%)
6
30
25
38
5
36
33
26
5
41
41
13
119
FY11
FY12
FY13
FY15 FY16E FY17E FY18E
Source: MOSL
Exhibit 7: Phase wise subscribers (FY15-18E)
Exhibit 8: 24% digital subscriber CAGR from 79m to 151m
47
25
79
151
72m net
susbcriber
adds
Market growth Analog phase-
off
FY18E Digital
Source: MOSL
FY15E Digital
Source: MOSL
11 August 2015
3

Hathway Cable & Datacom
Story in charts
Exhibit 9: HATH: FY15 revenue break-up
Others
4.1
23%
Exhibit 10: HATH: FY18 revenue break-up
Others
6.4
18%
Carriage
5.9
17%
Susbcrip-
tion
22.9
63%
Susbcrip-
tion
5.6
36%
Carriage
5.7
31%
Activation
0.8
4%
Source: Company, MOSL
Activation
1.1
3%
Source: Company, MOSL
Exhibit 11: HATH: Net subscription revenue (INR b)
21.5
14.1
7.7
9.6
Exhibit 12: HATH: EBITDA ex-activation/one-offs (INR b)
10.9
5.5
2.5
1.7
FY15
FY16E
FY17E
FY18E
FY15
FY16E
FY17E
FY18E
Source: Company, MOSL
Exhibit 13: HATH: Capex and Capex/sales (INR b, %)
Capex
30
Capex/Sales (%)
26
18
12
Exhibit 14: HATH: FCFF (INR b)
6.8
6.8
7.8
0.0
-1.3
FY15
3.3
FY15
6.6
FY16E
7.4
FY17E
4.0
FY18E
Source: Company, MOSL
-2.1
FY16E
FY17E
FY18E
FY19E
FY20E
Source: Company, MOSL
11 August 2015
4

Hathway Cable & Datacom
Exhibit 15: Key operating metrics assumptions
FY14
FY15
2.6
4.5
1.5
8.5
3.3
11.8
FY16E
2.7
4.7
3.8
11.1
2.5
13.6
FY17E
2.7
4.8
6.5
14.1
0.2
14.3
FY18E
2.8
5.0
6.8
14.6
0.0
14.6
Phase wise subscriber base (m)
Phase I
Phase II
Phase III/IV
Digital
Analog
Total Universe
2.5
4.3
1.2
8.0
3.5
11.5
Phase wise gross ARPU (INR)
Phase I
Phase II
Phase III/IV
Analog
Total Universe
YoY (%)
205
175
160
150
176
233
193
176
161
190
8
78
51
13
12
40
103
72
14
12
55
37
50
43
7
18
176
136
40
7
30
37
3
53
41
12
22
190
135
55
12
36
49
6
245
202
185
172
200
5
115
86
28
12
63
15
56
38
18
28
200
137
63
18
36
54
262
216
198
184
215
7
136
103
59
12
84
34
61
36
25
30
215
131
84
25
35
60
285
236
216
197
236
10
157
130
108
12
124
47
71
34
37
30
236
112
124
37
35
72
Phase wise net ARPU (INR)
Phase I
Phase II
Phase III/IV
Analog
Total Universe
YoY (%)
Per subscriber carriage and content cost (INR)
Content cost/subscriber/month
C& P revenue/sub/month
Net content cost/sub/month
Net content cost/net ARPU
Per subscriber monthly metrics
Gross revenue
LCO share
Net revenue
Net content cost
Other cost
Total operating cost
EBITDA
9
24
52
Source: Company, MOSL
11 August 2015
5

Hathway Cable & Datacom
Exhibit 16: Key financial metrics assumptions
FY14
FY15
18.3
16
2.6
-16
14.2
1.7
79
9.3
3.3
18
0.9
0.5
1,655
26.6
7.7
7.7
0.8
5.7
4.1
18.3
FY16E
21.7
19
4.9
87
22.3
2.5
48
11.5
6.6
30
2.9
2.6
1,400
30.6
9.6
9.6
2.3
5.8
4.0
21.7
FY17E
28.5
31
8.6
77
30.2
5.5
119
19.3
7.4
26
3.5
3.0
1,400
36.0
14.1
14.1
3.1
6.0
5.2
28.5
FY18E
35.0
23
12.1
40
34.5
10.9
98
31.2
4.0
12
1.1
0.6
1,350
40.9
21.5
21.5
1.1
5.9
6.4
35.0
Key Financials
Revenue
YoY (%)
EBITDA
YoY (%)
EBITDA margin (%)
EBITDA ex activation/one-offs
YoY (%)
EBITDA margin ex activation (%)
15.8
40
3.1
12
19.5
0.9
17
6.0
6.8
43
2.9
2.9
1,821
23.2
5.3
5.6
1.6
5.7
2.8
15.8
Capex analysis (INR b)
Capex
Capex/Sales (%)
Gross STB adds (m)
Net STB adds (m)
STB Capex/gross add (INR)
Revenue break-up (INR b)
Gross subscription revenue (incl LCO share)
Net subscription revenue (excl LCO share)
Reported subscription revenue (post gross billing)
Activation revenue
Carriage and placement revenue
Other revenue (incl broadband)
Total revenue
Source: Company, MOSL
11 August 2015
6

Hathway Cable & Datacom
Financials and valuations
Income Statement
Y/E March
Revenues
Change (%)
Total Expenses
EBITDA
% of Revenue
Change (%)
Depn. & Amortization
EBIT
Net finance cost
Other Income
Exceptional items
PBT
Tax
Rate (%)
Reported PAT
Minority interest
Reported Net profit
Adjusted Net profit
Change (%)
2013
11,325
11.9
8,587
2,738
24.2
63.3
1,661
1,078
602
157
78
555
179
32.3
376
219
157
235
NA
2014
15,811
39.6
12,735
3,077
19.5
12.4
2,993
84
1,345
21
26
-1,266
162
-12.8
-1,428
-296
-1,132
-1,107
NA
2015
18,315
15.8
15,717
2,599
14.2
-15.5
3,279
-681
1,535
271
-478
-1,466
280
-19.1
-1,746
59
-1,805
-2,283
NA
2016E
21,747
18.7
16,889
4,857
22.3
86.9
3,816
1,041
1,567
210
0
-316
294
-92.9
-610
-122
-488
-488
NA
2017E
28,496
31.0
19,886
8,610
30.2
77.3
4,605
4,005
1,665
166
0
2,506
308
12.3
2,198
440
1,758
1,758
-460.5
(INR Million)
2018E
34,960
22.7
22,908
12,052
34.5
40.0
5,246
6,806
1,429
166
0
5,543
324
5.8
5,219
1,044
4,175
4,175
137.4
(INR Million)
2018E
1,661
18,830
-2,942
17,549
3,781
11,161
486
578
33,555
52,384
26,133
330
26,580
149
20,184
10,160
1,056
8,968
13,358
6,657
6,701
6,826
33,555
Balance Sheet
Y/E March
Share Capital
Add. Paid up Capital
Reserves
Net Worth
Minority Interest
Loans
Other Liabilities
Deferred Tax Liability
Capital Employed
Gross Block
Less : Depreciation
CWIP
Fixed Assets
Investments
Curr. Assets
Debtors
Cash & Bank Balance
Other Current Assets
Curr. Liab. & Prov.
Creditors
Other Current Liabilities
Net Curr. Assets
Appl. of Funds
E: MOSL Estimates
2013
1,432
12,049
-5,256
8,224
2,112
9,463
113
207
20,120
23,704
7,274
2,132
18,562
84
7,609
3,702
545
3,362
6,135
1,849
4,286
1,474
20,120
2014
1,520
14,459
-6,386
9,593
2,251
15,130
211
229
27,413
30,541
9,175
2,500
23,865
87
10,227
5,469
440
4,317
6,767
2,483
4,284
3,460
27,413
2015
1,661
18,830
-8,388
12,103
2,419
14,829
255
303
29,909
34,392
12,467
2,475
24,400
1,040
11,467
5,712
1,056
4,698
6,998
3,488
3,511
4,468
29,909
2016E
1,661
18,830
-8,875
11,615
2,297
15,764
302
359
30,339
41,003
16,283
825
25,545
149
12,955
6,320
1,056
5,578
8,310
4,141
4,168
4,645
30,339
2017E
1,661
18,830
-7,117
13,374
2,737
16,727
396
471
33,704
48,354
20,888
330
27,797
149
16,647
8,281
1,056
7,310
10,889
5,426
5,462
5,759
33,704
11 August 2015
7

Hathway Cable & Datacom
Financials and valuations
Ratios
Y/E March
Basic (INR)
EPS
Cash EPS
Book Value
DPS
Payout %(Incl.Div.Taxes)
Valuation (x)
P/E
Cash P/E
EV/EBITDA*
EV/EBITDA ex-activation *
EV/Sales*
EV/sales ex-activation*
Price/Book Value
EV/Sub (INR)*
Profitability Ratios (%)
RoE
RoCE
Turnover Ratios
Debtors (Days)
Asset Turnover (x)
Leverage Ratio
Net Debt/Equity (x)
2013
0.3
2.7
14.5
0.0
0.0
2014
-1.5
2.6
16.0
0.0
0.0
-32.2
18.9
22.2
72.0
4.3
4.8
3.0
5,928
2.3
5.0
119
0.72
0.9
-10.0
-2.9
126
0.70
1.2
2015
-2.9
1.3
18.3
0.0
0.0
-16.7
38.5
25.2
38.6
3.6
3.7
2.6
5,527
-17.4
-3.4
114
0.69
0.9
2016E
-0.6
4.0
16.8
0.0
0.0
-82.2
12.1
14.0
27.2
3.1
3.5
2.9
5,013
-3.4
1.7
106
0.79
1.1
2017E
2.1
7.7
19.4
0.0
0.0
22.8
6.3
8.0
12.6
2.4
2.7
2.5
4,847
11.7
12.8
106
0.96
1.0
2018E
5.0
11.3
25.7
0.0
0.0
9.6
4.3
5.3
5.8
1.8
1.9
1.9
4,346
22.3
22.6
106
1.13
0.5
(INR Million)
2018E
12,052
166
-1,429
-238
-956
9,595
-4,030
0
0
-4,030
0
-5,565
0
-5,565
0
1,056
1,056
* Based on attributable numbers after deducting minority interest
Cash Flow Statement
Y/E March
Op.Profit/(Loss) bef Tax
Other Income/except. items
Interest Paid
Direct Taxes Paid
(Inc)/Dec in Wkg. Cap.
CF from Op.Activity
(inc)/Dec in FA + CWIP
(Pur)/Sale of Investments
Other investing activity/adj
CF from Inv.Activity
Issue of Shares
Inc/(Dec) in Debt
Dividends Paid
Others
CF from Fin.Activity
Inc/(Dec) in Cash
Add: Opening Balance
Closing Balance
E: MOSL Estimates
2013
2,738
79
-602
-115
-193
1,907
-8,057
73
-12
-7,996
52
5,523
91
5,665
-423
968
546
2014
3,077
-5
-1,345
-157
-1,977
-407
-8,297
-3
3
-8,297
2,498
5,666
435
8,600
-105
545
441
2015
2,599
749
-1,535
-208
-346
1,259
-3,826
-953
-185
-4,964
4,512
-300
110
4,321
616
440
1,056
2016E
4,857
210
-1,567
-248
-118
3,134
-4,961
891
0
-4,069
0
935
0
935
0
1,056
1,056
2017E
8,610
166
-1,665
-218
-998
5,895
-6,857
0
0
-6,857
0
962
0
962
0
1,056
1,056
11 August 2015
8

Hathway Cable & Datacom
Corporate profile: Hathway Cable & Datacom
Company description
Hathway is a leading cable television services
provider in India, as well as one of the leading cable
broadband services providers. The company offers
cable television services across 160 cities and
towns and high-speed cable broadband services
across 20 cities. Hathway has established 23 digital
head-ends in the country. The company holds a
pan India ISP license and is currently India’s largest
cable broadband services provider, with
approximately 2 million two-way broadband
enabled homes passes.
Exhibit 15: Sensex rebased
80
70
60
50
40
Aug-14
Nov-14
Feb-15
May-15
Aug-15
Hathway Cable
Sensex - Rebased
Exhibit 19: Shareholding pattern (%)
Jun-15
Promoter
DII
FII
Others
43.5
38.5
14.6
3.4
Mar-15
43.5
13.2
39.9
3.5
Jun-14
47.5
14.5
33.1
4.9
Exhibit 20: Top holders
Holder Name
Macquarie Bank Ltd
P6 Mauritius India Holding Ltd
Reliance Capital Trustee Co Ltd A/c Reliance Equity
Smallcap World Fund Inc
Clsa Global Markets Pte Ltd
% Holding
9.4
8.5
5.2
4.2
4.0
Note: FII Includes depository receipts
Exhibit 21: Top management
Name
Brahmal Vasudevan
Jagdish Kumar G Pillai
Designation
Chairman
Managing Director & CEO
Exhibit 22: Directors
Name
Brahmal Vasudevan*
Jagdish Kumar G Pillai
Rajan Raheja
Viren Raheja
Akshay Raheja
Name
Sridhar Gorthi*
Vinayak Aggarwal
Devandra Shrotri*
Sasha Mirchandani*
Biswajit A Subramanian
*Independent
Exhibit 23: Auditors
Name
G M Kapadia & Co
Ashok Kumar Aggarwal & Co
Type
Statutory
Cost Auditor
Exhibit 24: MOSL forecast v/s consensus
EPS
(INR)
FY16
FY17
FY18
MOSL
forecast
-0.6
2.1
5.0
Consensus
forecast
-
-
-
Variation
(%)
-
-
-
11 August 2015
9

Hathway Cable
and may be distributed
This document has been prepared by Motilal Oswal Securities Limited (hereinafter referred to as Most) to provide information about the company(ies) and/sector(s), if any, covered in the report
& Datacom
by it and/or its affiliated company(ies). This report is for personal information of the selected recipient/s and does not construe to be any investment, legal or taxation advice to you. This research report does not
constitute an offer, invitation or inducement to invest in securities or other investments and Motilal Oswal Securities Limited (hereinafter referred as MOSt) is not soliciting any action based upon it. This report is not for
public distribution and has been furnished to you solely for your general information and should not be reproduced or redistributed to any other person in any form. This report does not constitute a personal
recommendation or take into account the particular investment objectives, financial situations, or needs of individual clients. Before acting on any advice or recommendation in this material, investors should consider
whether it is suitable for their particular circumstances and, if necessary, seek professional advice. The price and value of the investments referred to in this material and the income from them may go down as well as
up, and investors may realize losses on any investments. Past performance is not a guide for future performance, future returns are not guaranteed and a loss of original capital may occur.
MOSt and its affiliates are a full-service, integrated investment banking, investment management, brokerage and financing group. We and our affiliates have investment banking and other business relationships with a
some companies covered by our Research Department. Our research professionals may provide input into our investment banking and other business selection processes. Investors should assume that MOSt and/or
its affiliates are seeking or will seek investment banking or other business from the company or companies that are the subject of this material and that the research professionals who were involved in preparing this
material may educate investors on investments in such business. The research professionals responsible for the preparation of this document may interact with trading desk personnel, sales personnel and other
parties for the purpose of gathering, applying and interpreting information. Our research professionals are paid on the profitability of MOSt which may include earnings from investment banking and other business.
MOSt generally prohibits its analysts, persons reporting to analysts, and members of their households from maintaining a financial interest in the securities or derivatives of any companies that the analysts cover.
Additionally, MOSt generally prohibits its analysts and persons reporting to analysts from serving as an officer, director, or advisory board member of any companies that the analysts cover. Our salespeople, traders,
and other professionals or affiliates may provide oral or written market commentary or trading strategies to our clients that reflect opinions that are contrary to the opinions expressed herein, and our proprietary
trading and investing businesses may make investment decisions that are inconsistent with the recommendations expressed herein. In reviewing these materials, you should be aware that any or all of the foregoing
among other things, may give rise to real or potential conflicts of interest. MOSt and its affiliated company(ies), their directors and employees and their relatives may; (a) from time to time, have a long or short position
in, act as principal in, and buy or sell the securities or derivatives thereof of companies mentioned herein. (b) be engaged in any other transaction involving such securities and earn brokerage or other compensation
or act as a market maker in the financial instruments of the company(ies) discussed herein or act as an advisor or lender/borrower to such company(ies) or may have any other potential conflict of interests with
respect to any recommendation and other related information and opinions.; however the same shall have no bearing whatsoever on the specific recommendations made by the analyst(s), as the recommendations
made by the analyst(s) are completely independent of the views of the affiliates of MOSt even though there might exist an inherent conflict of interest in some of the stocks mentioned in the research report
Reports based on technical and derivative analysis center on studying charts company's price movement, outstanding positions and trading volume, as opposed to focusing on a company's fundamentals and, as
such, may not match with a report on a company's fundamental analysis. In addition MOST has different business segments / Divisions with independent research separated by Chinese walls catering to different set
of customers having various objectives, risk profiles, investment horizon, etc, and therefore may at times have different contrary views on stocks sectors and markets.
Unauthorized disclosure, use, dissemination or copying (either whole or partial) of this information, is prohibited. The person accessing this information specifically agrees to exempt MOSt or any of its affiliates or
employees from, any and all responsibility/liability arising from such misuse and agrees not to hold MOSt or any of its affiliates or employees responsible for any such misuse and further agrees to hold MOSt or any of
its affiliates or employees free and harmless from all losses, costs, damages, expenses that may be suffered by the person accessing this information due to any errors and delays. The information contained herein is
based on publicly available data or other sources believed to be reliable. Any statements contained in this report attributed to a third party represent MOSt’s interpretation of the data, information and/or opinions
provided by that third party either publicly or through a subscription service, and such use and interpretation have not been reviewed by the third party. This Report is not intended to be a complete statement or
summary of the securities, markets or developments referred to in the document. While we would endeavor to update the information herein on reasonable basis, MOSt and/or its affiliates are under no obligation to
update the information. Also there may be regulatory, compliance, or other reasons that may prevent MOSt and/or its affiliates from doing so. MOSt or any of its affiliates or employees shall not be in any way
responsible and liable for any loss or damage that may arise to any person from any inadvertent error in the information contained in this report. MOSt or any of its affiliates or employees do not provide, at any time,
any express or implied warranty of any kind, regarding any matter pertaining to this report, including without limitation the implied warranties of merchantability, fitness for a particular purpose, and non-infringement.
The recipients of this report should rely on their own investigations.
This report is intended for distribution to institutional investors. Recipients who are not institutional investors should seek advice of their independent financial advisor prior to taking any investment decision based on
this report or for any necessary explanation of its contents.
Most and it’s associates may have managed or co-managed public offering of securities, may have received compensation for investment banking or merchant banking or brokerage services, may have received any
compensation for products or services other than investment banking or merchant banking or brokerage services from the subject company in the past 12 months.
Most and it’s associates have not received any compensation or other benefits from the subject company or third party in connection with the research report.
Subject Company may have been a client of Most or its associates during twelve months preceding the date of distribution of the research report
MOSt and/or its affiliates and/or employees may have interests/positions, financial or otherwise of over 1 % at the end of the month immediately preceding the date of publication of the research in the securities
mentioned in this report. To enhance transparency, MOSt has incorporated a Disclosure of Interest Statement in this document. This should, however, not be treated as endorsement of the views expressed in the
report.
Motilal Oswal Securities Limited is registered as a Research Analyst under SEBI (Research Analyst) Regulations, 2014. SEBI Reg. No. INH000000412
There are no material disciplinary action that been taken by any regulatory authority impacting equity research analysis activities
Analyst Certification
The views expressed in this research report accurately reflect the personal views of the analyst(s) about the subject securities or issues, and no part of the compensation of the research analyst(s) was, is, or will be
directly or indirectly related to the specific recommendations and views expressed by research analyst(s) in this report. The research analysts, strategists, or research associates principally responsible for preparation
of MOSt research receive compensation based upon various factors, including quality of research, investor client feedback, stock picking, competitive factors and firm revenues
Disclosure of Interest Statement
§
Analyst ownership of the stock
§
Served as an officer, director or employee
HATHWAY CABLE AND DATA
No
No
Disclosures
A graph of daily closing prices of securities is available at www.nseindia.com and http://economictimes.indiatimes.com/markets/stocks/stock-quotes
Regional Disclosures (outside India)
For U.S.
This report is not directed or intended for distribution to or use by any person or entity resident in a state, country or any jurisdiction, where such distribution, publication, availability or use would be contrary to law,
regulation or which would subject MOSt & its group companies to registration or licensing requirements within such jurisdictions.
Motilal Oswal Securities Limited (MOSL) is not a registered broker - dealer under the U.S. Securities Exchange Act of 1934, as amended (the"1934 act") and under applicable state laws in the United States. In
addition MOSL is not a registered investment adviser under the U.S. Investment Advisers Act of 1940, as amended (the "Advisers Act" and together with the 1934 Act, the "Acts), and under applicable state laws in the
United States. Accordingly, in the absence of specific exemption under the Acts, any brokerage and investment services provided by MOSL, including the products and services described herein are not available to or
intended for U.S. persons.
This report is intended for distribution only to "Major Institutional Investors" as defined by Rule 15a-6(b)(4) of the Exchange Act and interpretations thereof by SEC (henceforth referred to as "major institutional
investors"). This document must not be acted on or relied on by persons who are not major institutional investors. Any investment or investment activity to which this document relates is only available to major
institutional investors and will be engaged in only with major institutional investors. In reliance on the exemption from registration provided by Rule 15a-6 of the U.S. Securities Exchange Act of 1934, as amended (the
"Exchange Act") and interpretations thereof by the U.S. Securities and Exchange Commission ("SEC") in order to conduct business with Institutional Investors based in the U.S., MOSL has entered into a chaperoning
agreement with a U.S. registered broker-dealer, Motilal Oswal Securities International Private Limited. ("MOSIPL"). Any business interaction pursuant to this report will have to be executed within the provisions of this
chaperoning agreement.
The Research Analysts contributing to the report may not be registered /qualified as research analyst with FINRA. Such research analyst may not be associated persons of the U.S. registered broker-dealer, MOSIPL,
and therefore, may not be subject to NASD rule 2711 and NYSE Rule 472 restrictions on communication with a subject company, public appearances and trading securities held by a research analyst account.
Motilal Oswal Capital Markets Singapore Pte Limited is acting as an exempt financial advisor under section 23(1)(f) of the Financial Advisers Act(FAA) read with regulation 17(1)(d) of the Financial Advisors
Regulations and is a subsidiary of Motilal Oswal Securities Limited in India. This research is distributed in Singapore by Motilal Oswal Capital Markets Singapore Pte Limited and it is only directed in Singapore to
accredited investors, as defined in the Financial Advisers Regulations and the Securities and Futures Act (Chapter 289), as amended from time to time.
In respect of any matter arising from or in connection with the research you could contact the following representatives of Motilal Oswal Capital Markets Singapore Pte Limited:
Kadambari Balachandran
Email : kadambari.balachandran@motilaloswal.com
Contact : (+65) 68189233 / 65249115
Office Address : 21 (Suite 31),16 Collyer Quay,Singapore 04931
For Singapore
11 August 2015
Motilal Oswal Securities Ltd
Motilal Oswal Tower, Level 9, Sayani Road, Prabhadevi, Mumbai 400 025
Phone: +91 22 3982 5500 E-mail: reports@motilaloswal.com
10