14 August 2015
1QFY16 Results Update | Sector:
Utilities
RattanIndia Power
BSE SENSEX
28,067
Bloomberg
Equity Shares (m)
M.Cap. (INR b) / (USD
b)
52-Week Range (INR)
1, 6, 12 Rel. Per (%)
Avg Val,(INRm)/Vol ‘000
S&P CNX
8,519
RTPOW IN
2,952.9
26.4/0.4
14 / 6
-11/-25/-35
29/2691
42.5
CMP: INR7
TP: INR14 (+88%)
Buy
Stabilization, one-offs impact performance
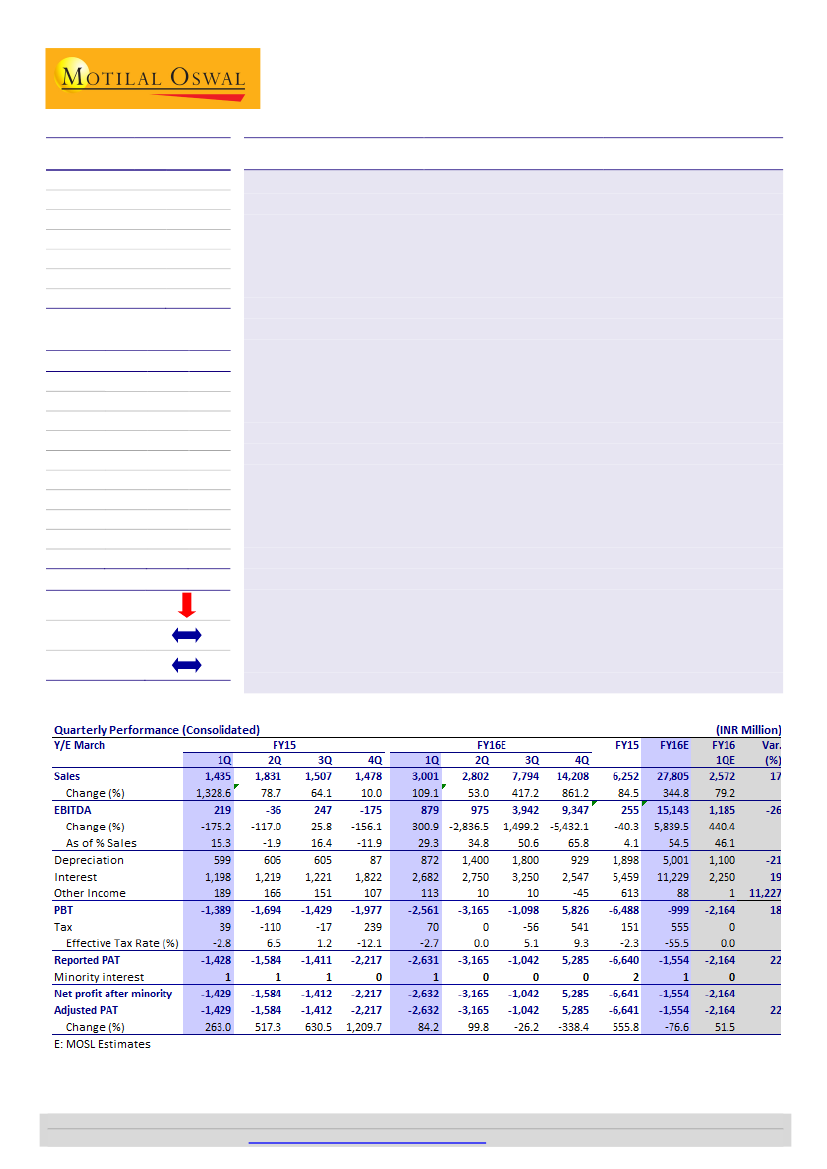
Consolidated EBIDTA below estimate:
RattanIndia Power (formerly Indiabulls
Power) reported consolidated revenue of INR3b, higher than estimate of
INR2.6b—partly led by high net generation at ~544MUs v/s estimate of 510MUs.
RTPOW also booked prior period revenue and compensatory tariff totaling to
~INR800m. However, consolidated EBIDTA stood at INR879m v/s estimate of
INR1.2b led by higher fuel cost (INR2.8/unit v/s estimate of INR1.7/unit).
Stabilization of three units commissioned at Amaravati project in March 2015
increased fuel cost.
Higher interest cost, deferred tax liability led to higher PAT loss:
Interest cost
inched up due to capitalization of three units at Amaravati, while depreciation was
lower due to change in accounting policy. PBT loss, thus, stood at INR2.6b v/s
estimate of INR2.2b. We had assumed NIL tax, while RTPOW provided for deferred
tax liability of INR70m—driving PAT loss to INR2.6b v/s estimate of INR2.2b.
Amravati PLF up in July; 2QFY16 operational performance to look up:
In 1QFY16,
Amravati average PLF was ~20% as Unit-1 ran at full load with available coal
supply. Coal supply improved to 0.3m tons in July and further in August (2-3
rakes/day being received v/s 4-5 rakes/day requirement); thus, generation/PLF is
expected to look up in 2QFY16 as all units achieve full load. For July 2015 itself, the
average PLF increased to 45%.
Cut estimate:
We lower our FY16/17 estimates to factor higher project cost and
slower ramp-up in operations. We now expect loss of INR1.6b in FY16 (v/s
INR1.4b earlier) and PAT of INR5.5b in FY17 (v/s INR7b earlier). Commissioning of
Nashik project by March 2016 and signing of PPA are the key triggers/monitorable.
The stock trades at P/E of 3.5x and P/BV of 0.4x on FY17E basis.
Free float (%)
Financials & Valuation (INR Billion)
Y/E MAR
Net Sales
EBITDA
Adj PAT
EPS (INR)
Gr. (%)
2015
6.3
0.3
(6.6)
(2.5)
-
2016E 2017E
27.8
15.1
(1.6)
(0.6)
(77)
17.2
(3.4)
6.0
(12.6)
0.4
67.8
29.0
5.5
2.1
(456)
19.0
11.6
12.8
3.5
0.4
BV/Sh.(INR) 17.8
RoE (%)
(13.2)
RoCE (%)
P/E (x)
P/BV (X)
(0.6)
(2.9)
0.4
Estimate change
TP change
Rating change
Nalin Bhatt
(NalinBhatt@MotilalOswal.com); +91 22 3982 5429
Investors are advised to refer through disclosures made at the end of the Research Report.
Motilal Oswal research is available on
www.motilaloswal.com/Institutional-Equities,
Bloomberg, Thomson Reuters, Factset and S&P Capital.