21 August 2015
1QFY16 Results Update | Sector: Agri
Monsanto India
BSE SENSEX
27,366
Bloomberg
S&P CNX
8,300
MCHM IN
CMP: INR2,866
TP: INR3,200 (+12%)
Buy
Earnings recovery to be back-ended; 2HFY16 to see a rebound in growth
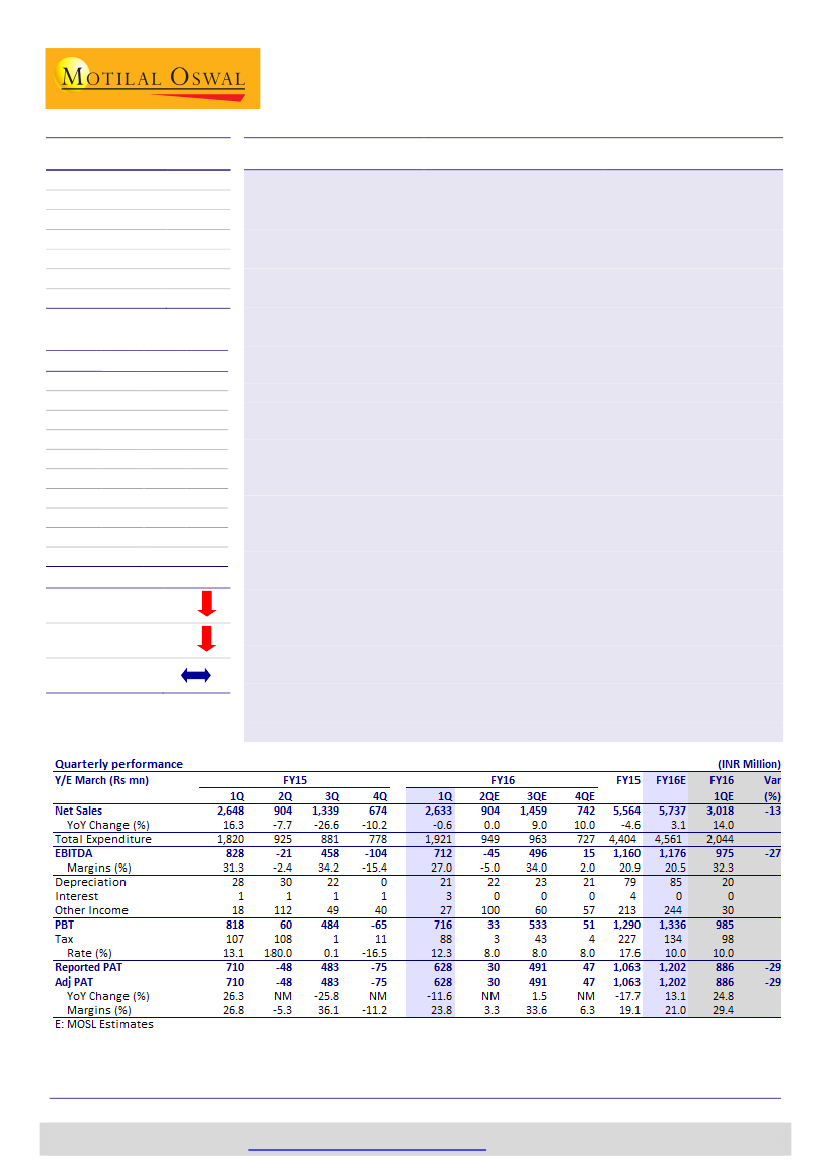
Results below expectations:
MCHM reported overall revenue of INR2,633m (est. of
INR3,108m) in 1QFY16 as against INR2,648m in 1QFY15, marking a YoY de-growth of
0.6%. EBITDA declined to INR712m (est. of INR975m) and margins contracted from
31.3% in 1QFY15 to 27% (est. of 32.3%) in 1QFY16. Our interaction with the
management suggests that margin contraction is largely on account of price correction
of ~20% in glyphosate selling price which led to inventory losses. Consequently, PAT
de-grew 11.6%— from INR710m in 1QFY15 to INR628m (est. of INR886m) in 1QFY16.
Earnings recovery to be back-ended; 2HFY16 to see a rebound in growth:
1QFY16
witnessed ~10% volume de-growth in corn seeds as a result of lower acreage;
however, due to higher share of new high-value products, value growth in corn seeds
was largely flat YoY. The management highlighted that glyphosate has seen a price
correction of ~20%; however, price correction led to strong volume growth (especially
in June)—leading to a minor overall decline in value growth. Our interaction with the
management suggests corn seeds as well as glyphosate are experiencing low growth
owing to below-normal monsoon in July 2015 (on a YoY basis). Accordingly, we expect
2QFY16 to witness flat growth and -5% margins. However, we expect growth to
rebound in 2HFY16—led by favorable base of glyphosate revenues and favorable
outlook for corn seed sales in Rabi.
Higher contribution from newly launched hybrids to drive margins higher:
Margins in
newly launched hybrids are higher as compared to old products by ~500 bps. We
believe improvement in mix in favor of newly launched hybrids will drive overall
margin improvement to the extent of 300bp in FY17.
Valuation and view
We cut our EPS estimates by 25% for FY16 and 19% for FY17 to factor in the impact of
weak monsoon, lower corn acreages and lower profitability in the glyphosate division.
Maintain
Buy
with a TP of INR3,200 (35x FY17E EPS).
Equity Shares (m)
17.3
M.Cap. (INR b) / (USD
46.3/0.8
b)
52-Week Range (INR) 3,756/2,000
1, 6, 12 Rel. Per (%)
-4/-9/30
Avg Val INRm/Vol ‘000
Free float (%)
Financials & Valuation (INR b)
Y/E MAR
Net Sales
EBITDA
Adj PAT
EPS (INR)
Gr (%)
2015
5.6
1.2
1.1
61.6
-17.6
2016E 2017E
5.6
1.2
1.2
68.6
11.3
225.4
31.0
34.5
42.0
12.8
6.7
1.6
1.6
92.1
34.3
245.3
39.1
43.5
31.3
11.7
138/46
27.9
BV/Sh.INR 216.9
RoE (%)
29.6
RoCE (%)
P/E (x)
P/BV (X)
36.0
46.8
13.3
Estimate change
TP change
Rating change
19%
8%
Niket Shah
(Niket.Shah@MotilalOswal.com); +91 22 3982 5426
Atul Mehra
(Atul.Mehra@MotilalOswal.com); +91 22 3982 5417
Investors are advised to refer through disclosures made at the end of the Research Report.
Motilal Oswal research is available on
www.motilaloswal.com/Institutional-Equities,
Bloomberg, Thomson Reuters, Factset and S&P Capital.

Monsanto India
Results below expectations
MCHM reported overall revenue of INR2,633m (est. of INR3,108m) in 1QFY16 as
against INR2,648m in 1QFY15, marking a YoY de-growth of 0.6%. EBITDA
declined to INR712m (est. of INR975m) and margins contracted from 31.3% in
1QFY15 to 27% (est 32.3%) in 1QFY16.
Our interaction with management suggests that margin contraction is largely on
account of price correction of ~20% in Glyphosate selling price, while the
purchase from parent company is at a cost plus fixed formula, thus causing
inventory losses.
Consequently, PAT de-grew 11.6% from INR710m in 1QFY15 to INR628m (est. of
INR886m) in 1QFY16.
Exhibit 2: Quarterly EBITDA trend
YoY Change (%)
28.1
-26.6
-7.7
1,339
-10.2
674
13.5
-0.6
639
2,633
132
668
3.3
25
828
-21
-2.4
458
-15.4
-104
712
EBITDA (INR m)
36.6
31.3
Margins (%)
34.2
27.0
Exhibit 1: Quarterly sales trend
71.9
Net Sales (INR m)
62.8
16.3
11.4
8.8
2,276
979
1,825
751
2,648
904
Source: Company, MOSL
Exhibit 3: Quarterly PAT trend
PAT (INR m)
122.4
0.0
15.6
562
77
651
78.6
26.3
27
710
0.0
-48
-25.8
483
-11.6
0.0
-76
628
YoY Growth (%)
Exhibit 4: Market share in corn
Others,
14%
Syngenta,
5%
Nuziveedu,
15%
Pioneer Du
Pont, 24%
Market Share
Monsanto,
28%
Kaveri, 14%
Source: Company, MOSL
Corn acreages seen weak in Kharif, FY16 Rabi and FY17 to see recovery
Management commented that corn seeds have seen a volume de-growth of
10% as a result of lower acreage, however due to higher share of new high value
products, the value growth was largely flat.
We expect corn volumes to post 10% de-growth in FY16.
Led by better mix in favor of newly launched hybrids as well as reducing age
profile of seeds sold, we expect 12% realization improvement in FY16, however
we factor a 0.8% revenue growth in the corn business for MCHM in FY16 due to
lower volumes.
21 August 2015
2

Monsanto India
Higher contribution from newly launched hybrids to drive margins higher
Margins in newly launched hybrids are higher as compared to old products by
~500 bps. We believe improvement in mix in favor of newly launched hybrids
will drive overall margin improvement to the extent of 300bp in FY17.
Herbicides business under pressure due to lower glyphosate prices
Management highlighted that glyphosate has seen a price correction of ~20%,
however since the purchase from the parent company is at a cost plus basis,
lower selling prices have dented margins.
Management highlighted that glyphosate has seen a price correction of ~20%,
however price correction led to strong volume growth especially in June, leading
to a minor overall decline in value growth.
We have built-in a 15% realization decline in glyphosate prices for FY16, while
we believe volume growth for FY16 would recover to 20% levels on the back of
10% volume decline in FY15. Consequently, we believe herbicides business will
post 2% revenue growth in FY16.
We expect realizations to sustain in FY17 from FY16 levels, while we factor in a
volume growth of 15% in FY17.
Earnings recovery to be back-ended, 2HFY16 to see growth bouncing back
Our interaction with management suggests that with monsoon in July 2015
being below normal, on a YoY basis, both corn seeds as well as glyphosate are
experiencing low growth.
Accordingly, we expect 2QFY16 to witness flat growth and -5% margins.
However, we expect growth to bounce back in 2HFY16, led by favorable base of
glyphosate revenues and favorable outlook for corn seed sales in Rabi.
We cut our EPS estimates by 25% for FY16 and 19% for FY17 to factor in the
impact of weak monsoon, lower corn acreages and lower profitability in the
glyphosate division. Maintain
Buy,
with a TP of INR3,300 (35x FY17E EPS).
Exhibit 5: Revenues to post 10% CAGR over FY15-17
Revenues (INR m)
5,818
3,634
3,738
4,424
5,564
5,636
6,718
Exhibit 6: PAT to post 22% CAGR over FY15-17
PAT (INR m)
1,290
1,063
532
500
673
1,183
1,589
FY11
FY12
FY13
FY14
FY15
FY16E
FY17E
FY11
FY12
FY13
FY14
FY15
FY16E
FY17E
Source: Company, MOSL
21 August 2015
3

Monsanto India
Valuation and view
We value MCHM at 35x FY17 EPS of 92 and arrive at a price target of INR3,200.
We believe our target multiple is justified, given the following:
Continued leadership in corn segment, with 28% market share.
New product launches, which have reduced age of portfolio to below 8 years.
Increasing hybrid penetration in corn (from 60% to 80% in the next five years).
Pending approval for GM crop, if received, can improve yields by 20-40% over
existing crops, which will drive up profitability.
Differentiated offering in terms of providing Monsanto Farm Advisory Services
(MFAS) to the farmer free of cost, which improves the brand loyalty.
We believe the following factors pose risks to our assumptions:
Irregularities in rainfall can change the cropping pattern.
Newly launched hybrids yielding lower than expected yields.
Delay in GM crop launch due to regulatory issues.
Exhibit 7: 10-years P/E chart
60
45
30
15
0
24.3
19.0
36.6
Exhibit 8: 10-year P/BV chart
15 Yrs Avg(x)
10 Yrs Avg(x)
16.5
12.5
P/E (x)
5 Yrs Avg(x)
P/B (x)
5 Yrs Avg(x)
15 Yrs Avg(x)
10 Yrs Avg(x)
12.3
22.2
8.5
4.5
0.5
5.9
5.0
4.1
Source: Company, MOSL
21 August 2015
4

Monsanto India
Operating metrics
Exhibit 9: Volume
growth
Particulars
Gylophosate Volume (MT) growth (%)
Seed Volume (MT) growth (%)
FY09
-17.9
-16.8
FY10
-11.9
10.3
FY11
-15.5
21.7
FY12
8.0
-4.6
FY13
34.0
7.0
FY14
20.0
8.8
FY15
-10.0
-13.5
FY16E
20.0
-10.0
FY17E
15.0
10.0
Exhibit 10:
Revenue
Mix
Particulars
Seed business
Agro Chemical business
FY09
56%
44%
FY10
65%
35%
FY11
72%
28%
FY12
69%
31%
FY13
65%
35%
FY14
63%
37%
FY15
63%
37%
FY16E
63%
37%
FY17E
64%
36%
Exhibit 11: Revenue
Growth
Particulars
Seed business (%)
Agro Chemical business (%)
FY09
4.2
9.8
FY10
19.1
-24.9
FY11
-1.1
-16.6
FY12
-0.7
12.5
FY13
11.3
38.4
FY14
30.0
39.4
FY15
-4.8
-1.0
FY16E
0.8
2.0
FY17E
21.0
16.2
21 August 2015
5

Monsanto India
Story in charts
Exhibit 12: Corn hybridization still at nascent stage in India
94%
88%
86%
% of Crop in Hybrid
85%
75%
60%
35%
Exhibit 13: Five states contribute 65% of total corn
production in India
Source: Company, MOSL
Exhibit 14: Worldwide corn production (mt)
Canada
2%
Mexico
2%
India
Argentina
3%
Ukraine
3%
2%
South Others
Africa 14%
1%
US
37%
Exhibit 15: Worldwide corn consumption (mt)
Indonesia Others
21%
1%
Egypt
1%
Canada
1%
Japan
2%
India
2% Mexico
3% Brazil
6% EU
8%
US
32%
EU
7% Brazil
7%
China
22%
China
23%
Source: Company, MOSL
Exhibit 16: Herbicide penetration (%)
62%
India
Global
48%
26%
16%
Exhibit 17: Consumption of agrochemicals is lowest in India
11
Consumption of Agrochemicals (Kg / Hectare)
9.4
6.6
4.6
4.2
2.5
2.4
2.3
1.3
0.6
23%
20%
2% 2%
Insecticides
Fungicides
Herbicides
Others
Source: Company, MOSL
21 August 2015
6

Monsanto India
Financials and valuations
Standalone - Income Statement
Y/E March (INR m)
Net Sales
Change (%)
EBITDA
Margin (%)
Depreciation
EBIT
Int. and Finance Charges
Other Income - Rec.
PBT bef. EO Exp.
EO Expense/(Income)
PBT after EO Exp.
Current Tax
Deferred Tax
Tax Rate (%)
Reported PAT
PAT Adj for EO items
Change (%)
Margin (%)
FY10
4,102
6.0
570
13.9
115
455
3
125
578
0
578
37
3
6.8
538
538
-26.8
13.1
FY11
3,634
-11.4
652
17.9
108
544
3
84
625
122
503
79
-5
14.8
428
532
-1.2
14.6
FY12
3,738
2.9
550
14.7
90
460
13
152
599
-3
601
97
2
16.5
502
500
-6.1
13.4
FY13
4,424
18.4
697
15.7
109
588
7
169
750
0
750
85
-9
10.2
673
673
34.8
15.2
FY14
5,818
31.5
1,451
24.9
119
1,332
5
129
1,456
69
1,387
160
-2
11.4
1,229
1,290
91.6
22.2
FY15
5,564
-4.4
1,160
20.9
79
1,081
4
213
1,290
0
1,290
233
-6
17.6
1,063
1,063
-17.6
19.1
FY16E
5,636
1.3
1,155
20.5
85
1,070
0
244
1,315
0
1,315
131
0
10.0
1,183
1,183
11.3
21.0
(INR Million)
FY17E
6,718
19.2
1,578
23.5
94
1,484
0
281
1,765
0
1,765
177
0
10.0
1,589
1,589
34.3
23.7
Standalone - Balance Sheet
Y/E March (Rs mn)
Equity Share Capital
Total Reserves
Preference Capital
Net Worth
Minority Interest
Deferred Liabilities
Total Loans
Capital Employed
Gross Block
Less: Accum. Deprn.
Net Fixed Assets
Capital WIP
Total Investments
Curr. Assets, Loans&Adv.
Inventory
Account Receivables
Cash and Bank Balance
Loans and Advances
Curr. Liability & Prov.
Account Payables
Other Current Liabilities
Provisions
Net Current Assets
Misc Expenditure
Appl. of Funds
FY10
86
3,430
0
3,516
0
-25
0
3,491
1,883
737
1,147
10
807
2,826
1,825
451
317
233
1,298
711
372
216
1,528
0
3,491
FY11
86
3,657
0
3,743
0
-30
0
3,714
1,395
518
876
51
1,514
2,367
1,303
409
172
484
1,095
535
296
264
1,273
0
3,714
FY12
173
3,671
0
3,844
0
-27
0
3,817
1,380
571
809
111
1,958
2,476
1,297
504
190
485
1,537
721
482
334
939
0
3,817
FY13
173
3,902
0
4,074
0
-36
0
4,038
1,541
674
868
24
2,509
2,503
1,394
412
203
494
1,866
1,037
403
427
637
0
4,038
FY14
173
3,272
0
3,445
0
-37
0
3,408
1,656
773
883
2
2,667
2,523
1,692
330
85
416
2,668
1,380
554
734
-145
0
3,408
FY15
173
3,571
0
3,743
0
-43
0
3,700
1,692
821
871
7
1,895
3,169
2,551
247
66
305
2,242
1,189
460
593
927
0
3,700
FY16E
173
3,717
0
3,890
0
-43
0
3,846
1,892
905
987
7
1,895
3,922
2,649
250
715
308
2,964
1,235
466
1,263
958
0
3,846
(INR Million)
FY17E
173
4,061
0
4,234
0
-43
0
4,191
2,092
1,000
1,092
9
1,895
4,715
3,107
298
952
358
3,520
1,448
555
1,516
1,195
0
4,191
21 August 2015
7

Monsanto India
Financials and valuations
Ratios
Y/E March
Basic (INR)
EPS
Cash EPS
BV/Share
DPS
Payout (%)
Valuation (x)
P/E
Cash P/E
P/BV
EV/Sales
EV/EBITDA
Dividend Yield (%)
Return Ratios (%)
RoE
RoCE
Working Capital Ratios
Asset Turnover (x)
Inventory (Days)
Debtor (Days)
Leverage Ratio (x)
Current Ratio
Debt/Equity
FY10
31.2
37.8
203.7
8.8
32.8
92.4
76.2
14.1
12.0
86.7
0.3
16.1
17.4
1.2
162.4
39
2.2
0.0
FY11
30.8
37.1
216.9
10.0
46.9
93.5
77.7
13.3
13.6
76.0
0.3
14.7
17.3
1.0
130.9
40
2.2
0.0
FY12
29.0
34.2
222.7
20.0
79.9
99.5
84.3
12.9
13.3
90.1
0.7
13.2
16.1
1.0
126.6
48
1.6
0.0
FY13
39.0
45.3
236.0
22.0
65.8
73.9
63.6
12.2
11.2
71.1
0.8
17.0
19.1
1.1
115.0
33
1.3
0.0
FY14
74.7
81.6
199.6
92.0
151.2
38.6
35.3
14.4
8.5
34.2
3.2
34.3
38.9
1.7
106.2
20
0.9
0.0
FY15
61.6
66.2
216.9
36.0
70.3
46.8
43.6
13.3
8.9
42.8
1.2
29.6
36.0
1.5
167.3
15
1.4
0.0
FY16E
68.6
73.5
225.4
50.0
87.6
42.0
39.2
12.8
8.7
42.4
1.7
31.0
34.5
1.5
171.5
15
1.3
0.0
FY17E
92.1
97.5
245.3
60.0
78.3
31.3
29.6
11.7
7.3
30.9
2.1
39.1
43.5
1.6
168.8
15
1.3
0.0
Standalone - Cash Flow Statement
Y/E March (Rs mn)
Net P/L Bef. Tax & EO Items
Depreciation
Interest & Finance Charges
Direct Taxes Paid
(Inc)/Dec in WC
CF from Operations
Others
CF from Operating incl EO
(inc)/dec in FA
Free Cash Flow
(Pur)/Sale of Investments
Others
CF from Investments
(Inc)/Dec in Debt
Interest Paid
Dividend Paid
CF from Fin. Activity
Inc/Dec of Cash
Add: Beginning Balance
Closing Balance
FY10
578
115
-4
39
17
666
-24
642
-137
505
-1,738
1,553
-322
82
-3
-191
-111
209
108
317
FY11
503
108
-3
100
316
824
72
896
-111
785
-1,909
1,269
-750
-16
-6
-151
-173
-27
198
172
FY12
601
90
3
125
258
828
-107
721
-96
624
-6,085
5,782
-399
-33
-3
-258
-294
27
163
190
FY13
750
109
-3
93
253
1,016
-122
894
-86
808
-3,840
3,450
-476
-47
-3
-345
-395
23
180
203
FY14
1,387
119
1
176
226
1,556
-22
1,534
-114
1,421
-4,669
4,627
-155
24
-4
-1,494
-1,474
-95
180
86
FY15
1,290
79
2
237
-891
243
-153
90
-93
-3
-6,681
7,544
770
0
4
-978
-974
-114
180
66
(INR Million)
FY16E
1,315
85
-244
131
618
1,641
0
1,641
-200
1,441
0
244
44
0
0
-1,037
-1,037
648
66
715
FY17E
1,765
94
-281
177
0
1,402
0
1,402
-201
1,201
0
281
80
0
0
-1,245
-1,245
237
715
952
21 August 2015
8

Monsanto India
Corporate profile: Monsanto India
Company description
Monsanto India (MCHM), the flagship company of
Monsanto company, is a subsidiary and the only
listed Monsanto entity outside the United States.
MCHM has partnered with farmers for over four
decades. In India, the Monsanto group operates
through 3 entities i.e. (1) the listed entity
Monsanto India Ltd (MCHM) which is primarily
involved in Maize seeds and Herbicides; (2) 50:50
JV between Mahyco and Monsanto Holdings Pvt.
Ltd known as Mahyco Monsanto Biotech (MMB)
which is sub-licensed to distribute BT cotton
technology in India; and (3) Monsanto Holding.
Exhibit 18: Sensex rebased
Exhibit 19: Shareholding pattern (%)
Jun-15
Promoter
DII
FII
Others
72.1
3.7
2.1
22.0
Mar-15
72.1
2.5
2.5
22.9
Jun-14
72.1
3.3
1.4
23.2
Exhibit 20: Top holders
Holder Name
R C Khanna
DSP Blackrock 3 Years Close Ended Equity Fund
% Holding
2.3
1.1
Note: FII Includes depository receipts
Exhibit 21: Top management
Name
Sekhar Natarajan
Shilpa Divekar Nirula
Designation
Chairman
Managing Director
Exhibit 22: Directors
Name
Sekhar Natarajan
Shilpa Divekar Nirula
H C Asher*
Name
Pradeep Poddar*
C Ravishankar
*Independent
Exhibit 23: Auditors
Name
Deloitte Haskins & Sells LLP
ABK & Associates
Type
Statutory
Cost Auditor
Exhibit 24: MOSL forecast v/s consensus
EPS
(INR)
FY16
FY17
MOSL
forecast
68.6
92.1
Consensus
forecast
74.6
93.7
Variation
(%)
-8.0
-1.7
21 August 2015
9

This document has been prepared by Motilal Oswal Securities Limited (hereinafter referred to as Most) to provide information about the company(ies) and/sector(s), if any, covered in the report and may be distributed
Monsanto India
by it and/or its affiliated company(ies). This report is for personal information of the selected recipient/s and does not construe to be any investment, legal or taxation advice to you. This research report does not
constitute an offer, invitation or inducement to invest in securities or other investments and Motilal Oswal Securities Limited (hereinafter referred as MOSt) is not soliciting any action based upon it. This report is not for
public distribution and has been furnished to you solely for your general information and should not be reproduced or redistributed to any other person in any form. This report does not constitute a personal
recommendation or take into account the particular investment objectives, financial situations, or needs of individual clients. Before acting on any advice or recommendation in this material, investors should consider
whether it is suitable for their particular circumstances and, if necessary, seek professional advice. The price and value of the investments referred to in this material and the income from them may go down as well as
up, and investors may realize losses on any investments. Past performance is not a guide for future performance, future returns are not guaranteed and a loss of original capital may occur.
MOSt and its affiliates are a full-service, integrated investment banking, investment management, brokerage and financing group. We and our affiliates have investment banking and other business relationships with a
some companies covered by our Research Department. Our research professionals may provide input into our investment banking and other business selection processes. Investors should assume that MOSt and/or
its affiliates are seeking or will seek investment banking or other business from the company or companies that are the subject of this material and that the research professionals who were involved in preparing this
material may educate investors on investments in such business. The research professionals responsible for the preparation of this document may interact with trading desk personnel, sales personnel and other
parties for the purpose of gathering, applying and interpreting information. Our research professionals are paid on the profitability of MOSt which may include earnings from investment banking and other business.
MOSt generally prohibits its analysts, persons reporting to analysts, and members of their households from maintaining a financial interest in the securities or derivatives of any companies that the analysts cover.
Additionally, MOSt generally prohibits its analysts and persons reporting to analysts from serving as an officer, director, or advisory board member of any companies that the analysts cover. Our salespeople, traders,
and other professionals or affiliates may provide oral or written market commentary or trading strategies to our clients that reflect opinions that are contrary to the opinions expressed herein, and our proprietary
trading and investing businesses may make investment decisions that are inconsistent with the recommendations expressed herein. In reviewing these materials, you should be aware that any or all of the foregoing
among other things, may give rise to real or potential conflicts of interest. MOSt and its affiliated company(ies), their directors and employees and their relatives may; (a) from time to time, have a long or short position
in, act as principal in, and buy or sell the securities or derivatives thereof of companies mentioned herein. (b) be engaged in any other transaction involving such securities and earn brokerage or other compensation
or act as a market maker in the financial instruments of the company(ies) discussed herein or act as an advisor or lender/borrower to such company(ies) or may have any other potential conflict of interests with
respect to any recommendation and other related information and opinions.; however the same shall have no bearing whatsoever on the specific recommendations made by the analyst(s), as the recommendations
made by the analyst(s) are completely independent of the views of the affiliates of MOSt even though there might exist an inherent conflict of interest in some of the stocks mentioned in the research report
Reports based on technical and derivative analysis center on studying charts company's price movement, outstanding positions and trading volume, as opposed to focusing on a company's fundamentals and, as
such, may not match with a report on a company's fundamental analysis. In addition MOST has different business segments / Divisions with independent research separated by Chinese walls catering to different set
of customers having various objectives, risk profiles, investment horizon, etc, and therefore may at times have different contrary views on stocks sectors and markets.
Unauthorized disclosure, use, dissemination or copying (either whole or partial) of this information, is prohibited. The person accessing this information specifically agrees to exempt MOSt or any of its affiliates or
employees from, any and all responsibility/liability arising from such misuse and agrees not to hold MOSt or any of its affiliates or employees responsible for any such misuse and further agrees to hold MOSt or any of
its affiliates or employees free and harmless from all losses, costs, damages, expenses that may be suffered by the person accessing this information due to any errors and delays. The information contained herein is
based on publicly available data or other sources believed to be reliable. Any statements contained in this report attributed to a third party represent MOSt’s interpretation of the data, information and/or opinions
provided by that third party either publicly or through a subscription service, and such use and interpretation have not been reviewed by the third party. This Report is not intended to be a complete statement or
summary of the securities, markets or developments referred to in the document. While we would endeavor to update the information herein on reasonable basis, MOSt and/or its affiliates are under no obligation to
update the information. Also there may be regulatory, compliance, or other reasons that may prevent MOSt and/or its affiliates from doing so. MOSt or any of its affiliates or employees shall not be in any way
responsible and liable for any loss or damage that may arise to any person from any inadvertent error in the information contained in this report. MOSt or any of its affiliates or employees do not provide, at any time,
any express or implied warranty of any kind, regarding any matter pertaining to this report, including without limitation the implied warranties of merchantability, fitness for a particular purpose, and non-infringement.
The recipients of this report should rely on their own investigations.
This report is intended for distribution to institutional investors. Recipients who are not institutional investors should seek advice of their independent financial advisor prior to taking any investment decision based on
this report or for any necessary explanation of its contents.
Most and it’s associates may have managed or co-managed public offering of securities, may have received compensation for investment banking or merchant banking or brokerage services, may have received any
compensation for products or services other than investment banking or merchant banking or brokerage services from the subject company in the past 12 months.
Most and it’s associates have not received any compensation or other benefits from the subject company or third party in connection with the research report.
Subject Company may have been a client of Most or its associates during twelve months preceding the date of distribution of the research report
MOSt and/or its affiliates and/or employees may have interests/positions, financial or otherwise of over 1 % at the end of the month immediately preceding the date of publication of the research in the securities
mentioned in this report. To enhance transparency, MOSt has incorporated a Disclosure of Interest Statement in this document. This should, however, not be treated as endorsement of the views expressed in the
report.
Motilal Oswal Securities Limited is registered as a Research Analyst under SEBI (Research Analyst) Regulations, 2014. SEBI Reg. No. INH000000412
There are no material disciplinary action that been taken by any regulatory authority impacting equity research analysis activities
Analyst Certification
The views expressed in this research report accurately reflect the personal views of the analyst(s) about the subject securities or issues, and no part of the compensation of the research analyst(s) was, is, or will be
directly or indirectly related to the specific recommendations and views expressed by research analyst(s) in this report. The research analysts, strategists, or research associates principally responsible for preparation
of MOSt research receive compensation based upon various factors, including quality of research, investor client feedback, stock picking, competitive factors and firm revenues
Disclosure of Interest Statement
Analyst ownership of the stock
Served as an officer, director or employee
MONSANTO INDIA
No
No
Disclosures
A graph of daily closing prices of securities is available at www.nseindia.com and http://economictimes.indiatimes.com/markets/stocks/stock-quotes
Regional Disclosures (outside India)
For U.S.
This report is not directed or intended for distribution to or use by any person or entity resident in a state, country or any jurisdiction, where such distribution, publication, availability or use would be contrary to law,
regulation or which would subject MOSt & its group companies to registration or licensing requirements within such jurisdictions.
Motilal Oswal Securities Limited (MOSL) is not a registered broker - dealer under the U.S. Securities Exchange Act of 1934, as amended (the"1934 act") and under applicable state laws in the United States. In
addition MOSL is not a registered investment adviser under the U.S. Investment Advisers Act of 1940, as amended (the "Advisers Act" and together with the 1934 Act, the "Acts), and under applicable state laws in the
United States. Accordingly, in the absence of specific exemption under the Acts, any brokerage and investment services provided by MOSL, including the products and services described herein are not available to or
intended for U.S. persons.
This report is intended for distribution only to "Major Institutional Investors" as defined by Rule 15a-6(b)(4) of the Exchange Act and interpretations thereof by SEC (henceforth referred to as "major institutional
investors"). This document must not be acted on or relied on by persons who are not major institutional investors. Any investment or investment activity to which this document relates is only available to major
institutional investors and will be engaged in only with major institutional investors. In reliance on the exemption from registration provided by Rule 15a-6 of the U.S. Securities Exchange Act of 1934, as amended (the
"Exchange Act") and interpretations thereof by the U.S. Securities and Exchange Commission ("SEC") in order to conduct business with Institutional Investors based in the U.S., MOSL has entered into a chaperoning
agreement with a U.S. registered broker-dealer, Motilal Oswal Securities International Private Limited. ("MOSIPL"). Any business interaction pursuant to this report will have to be executed within the provisions of this
chaperoning agreement.
The Research Analysts contributing to the report may not be registered /qualified as research analyst with FINRA. Such research analyst may not be associated persons of the U.S. registered broker-dealer, MOSIPL,
and therefore, may not be subject to NASD rule 2711 and NYSE Rule 472 restrictions on communication with a subject company, public appearances and trading securities held by a research analyst account.
Motilal Oswal Capital Markets Singapore Pte Limited is acting as an exempt financial advisor under section 23(1)(f) of the Financial Advisers Act(FAA) read with regulation 17(1)(d) of the Financial Advisors
Regulations and is a subsidiary of Motilal Oswal Securities Limited in India. This research is distributed in Singapore by Motilal Oswal Capital Markets Singapore Pte Limited and it is only directed in Singapore to
accredited investors, as defined in the Financial Advisers Regulations and the Securities and Futures Act (Chapter 289), as amended from time to time.
In respect of any matter arising from or in connection with the research you could contact the following representatives of Motilal Oswal Capital Markets Singapore Pte Limited:
Kadambari Balachandran
Email : kadambari.balachandran@motilaloswal.com
Contact : (+65) 68189233 / 65249115
Office Address : 21 (Suite 31),16 Collyer Quay,Singapore 04931
For Singapore
Motilal Oswal Securities Ltd
21 August 2015
Motilal Oswal Tower, Level 9, Sayani Road, Prabhadevi, Mumbai 400 025
Phone: +91 22 3982 5500 E-mail: reports@motilaloswal.com
10