15 October 2015
2QFY16 Results Update | Sector: Technology
BSE SENSEX
27,010
Bloomberg
Equity Shares (m)
M.Cap. INR b / USD b
52-Week Range (INR)
1, 6, 12 Rel. Per (%)
Avg Val INRm/Vol ‘000
Free float (%)
S&P CNX
8,180
MTCL IN
83.7
102.8/1.6
1589 / 870
-2/13/33
282/214
86.3
MindTree
CMP: INR1,403
TP: INR1,400
Neutral
Blockbuster growth; sanguine deal wins; yet commentary on 2H muted
Financials & Valuation (INR b)
Y/E Mar
Sales
EBITDA
PAT
EPS (INR)
EPS Gr. (%)
BV/Sh.(INR)
RoE (%)
RoCE (%)
P/E (x)
EV/EBITDA(x)
Estimate change
TP change
Rating change
2015 2016E 2017E
35.6
7.1
5.4
63.9
18.6
29.4
32.8
21.9
15.2
46.1
8.4
6.1
73.1
14.5
27.9
31.3
19.2
13.4
56.3
10.9
7.8
93.2
27.5
29.3
34.4
15.0
10.0
239.5 285.4 349.6
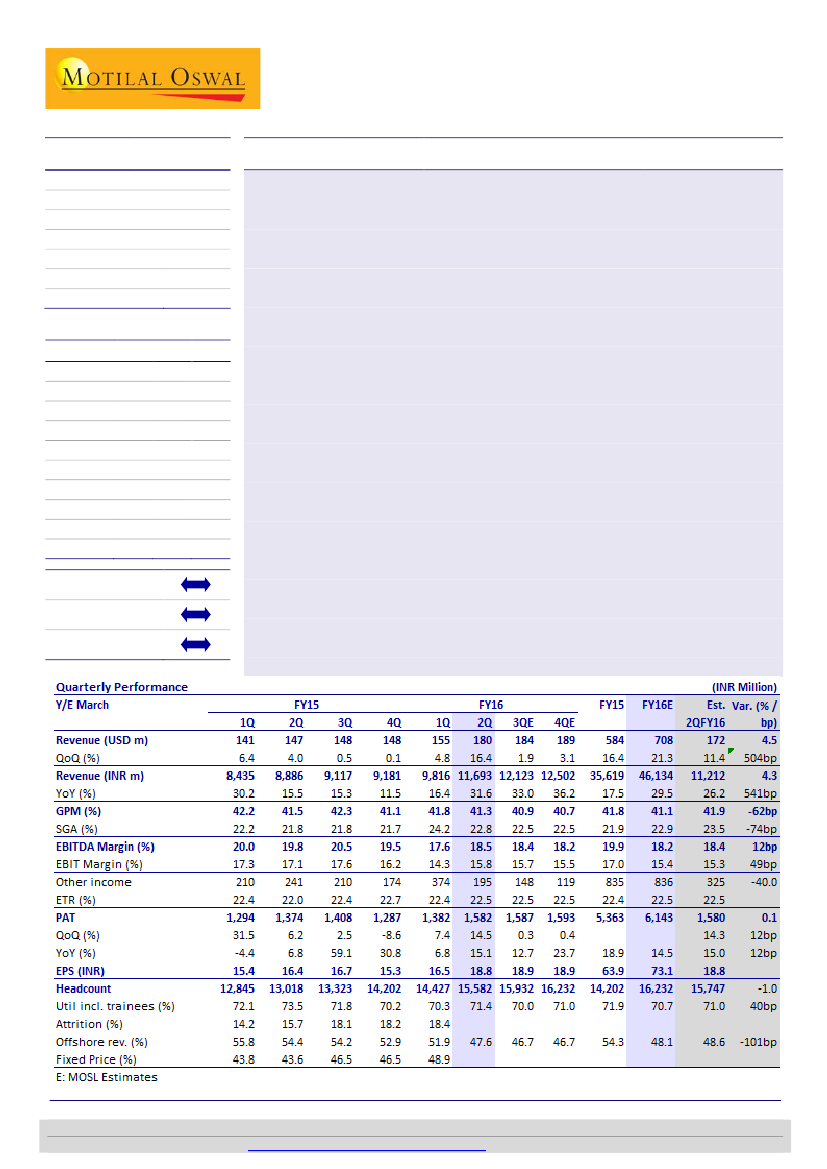
Strong revenue beat…:
MTCL’s 2QFY16 revenues at USD180.3m were higher than
our estimate of USD172.5m. Excluding the revenues from acquisition of Bluefin
and Relational Solutions, organic revenue growth stood at 8.1% QoQ, which was
higher than our expectation of 5.4%. That said, in a stance similar to INFO’s MTCL
remains muted in terms of its expectations for 2H, despite USD105m wins in
Digital, which see a quicker conversion to revenues.
…drove recovery in profitability:
EBITDA margins expanded 90bp QoQ to 18.5%,
in line with our estimate of 18.4%. During the quarter, the impact of wage hikes
was offset by INR depreciation, and operational efficiency. PAT at INR1.58b grew
14.5% QoQ, in line with our expectation, led by lower-than-expected forex gains.
Digital continues to drive:
MTCL saw 9.6% growth in digital revenues, which now
constitute to 36.6% of total revenues. Deal wins reflected continued strength in
digital; which contributed USD105m of the USD193m TCV.
Seasonality to weigh on 2H:
On account of seasonal weakness, and furloughs,
MTCL expects 3Q revenue growth to be soft. It indicated that USD revenue growth
would be higher than what it was in 3QFY15 (0.5% QoQ). With lower revenue
growth, part impact of wage hikes, and not factoring any currency benefits, it
expects margins to sequentially decline in 3Q.
Inching estimates higher:
We have increased our revenue estimates for
FY16E/FY17E by 2.6%/2.8%, to factor in higher organic growth momentum in 2Q
and visibility from deal wins. Our earnings estimates for FY16E/17E are up by
0.4%/2.9% to INR73.1/INR93.2, mainly on the back of revenue upgrade. Our price
target of INR1,400 discounts FY17E EPS by 15x. MTCL currently trades at 19.2x/
15x FY16E/17E EPS. While it remains our most preferred company in terms of
fundamentals within tier-II IT, we remain
Neutral
on valuations.
Investors are advised to refer through disclosures made at the end of the Research Report.
Motilal Oswal research is available on
www.motilaloswal.com/Institutional-Equities,
Bloomberg, Thomson Reuters, Factset and S&P Capital.
Ashish Chopra
(Ashish.Chopra@MotilalOswal.com); +91 22 3982 5424
Sagar Lele
(Sagar.Lele@MotilalOswal.com); +91 22 3982 5585

MindTree
Highest incremental organic revenues in the last six years
MTCL reported 16.4% QoQ growth in 2Q to USD180.3m, ahead of our estimate
of USD172.5m. Growth included revenues from Bluefin and Relational, which
were acquired during the quarter. On an organic basis, revenue growth was at
8.1% QoQ, which also beat our expectation of 5.4% QoQ, by a large margin. For
MTCL, the impact of cross-currency fluctuation on revenue growth was minimal,
at -10bp.
Exhibit 1: Stellar revenue growth in 2Q (organic)
Revenue (USD m)
6.4
4.5
2.5
117.7
124.0
127.1
132.8
141.3
4.0
0.5
147.0
147.7
0.1
147.8
154.9
167.4
4.8
QoQ Growth (%)
8.1
4.2
5.4
Source: MOSL, Company
On an organic basis, volume grew during the quarter by 8.4%, and realization
declined by 0.3%.
Including the acquisitions, onsite volume grew by 18%, and offshore volume by
8.2%. Growth was higher onsite as Bluefin’s revenue composition is entirely
onsite.
MTCL won USD193m TCV worth of deals in 2QFY16, after having won deals
worth USD208m in 1Q. Of the deal wins, USD63m were fresh intake while
USD130m were renewals. Out of these USD157m is expected within a year and
USD36m beyond that.
Of the deals, digital accounted for USD105m (54% of TCV) in 2Q, against
USD63m (30% of TCV) in 1Q.
MTCL also saw an increase in the size of deals, as the stage of maturity of its
clients evolved. In 2Q, average size of digital deals was USD448,000, compared
to USD220,000 in 1Q.
Profitability: EBITDA margins in line with estimates
EBITDA margin for the quarter was 18.5%, +90bp QoQ, in line with our estimate
of 18.4%. While the company had the headwinds of wage hike, and
consolidation of Bluefin (which has margins lower than MTCL); this was more
than offset by INR depreciation, and improvement in operational efficiency.
Gross margin declined by 55bp QoQ to 41.3% (v/s estimate of 41.9%), and SGA
was down 144bp QoQ at 22.8% (v/s estimate of 23.5%)
Given the lower revenue growth expectation in 3Q, part impact of wage hike,
and the assumption of no currency benefits, margins are expected to decline in
3Q.
15 October 2015
2

MindTree
Exhibit 2: EBITDA margin aided by INR depreciation, and lower SG&A costs
EBITDA margin (%)
22.6
21.4
21.3
19.4
22.2
21.8
SGA (%)
21.8
21.7
24.2
22.8
18.4
20.8
19.5
21.5
20.0
19.8
20.5
19.5
17.6
18.5
Source: MOSL, Company
Utilization excluding trainees was up 140bp to 73.3% while utilization including
trainees was up by 140bp QoQ to 71.4%. There was net addition of 115
employees during the quarter.
Incl. Trainees (%)
76
73
70
67
64
Excl. Trainees (%)
Exhibit 3: Utilization excl. trainees increased by 140bp
Source: MOSL, Company
PAT for the quarter was INR1,582m, 14.5% QoQ, below in line with our estimate
of INR1,580m. Together, other income and forex gains during the quarter were
INR195m v/s our estimate of INR325m.
Maintained guidance for FY16:
MTCL maintained its revenue growth guidance
of beating the NASSCOM band of 12-14%, including revenues from Discoverture,
but excluding the acquisition of Bluefin and Relational.
Seasonal weakness to soften revenue growth in 3Q:
On account of seasonal
weakness, and a negative impact of furloughs, MTCL expects softness in
3QFY16. Revenue growth is expected to be higher than the USD revenue growth
seen in 3QFY15, which was 0.5%.
Margins likely to decline in 3Q:
On account of the lower revenue growth,
impact of wage hikes to ~30% of employees, and the assumption that currency
benefits won’t exist; margins are expected to decline in 3Q. The impact of wage
hikes has been slightly higher for MTCL given wage hikes (9% offshore, and 3%
onsite) are a tad higher than industry average.
Growth strong in top-10 clients:
MTCL has been facing issues in two of its top
10 accounts. While, headwinds from one are now behind, the other is expected
to continue declining over the next two quarters. Excluding the client, which is
declining, MTCL’s revenues from its top 10 clients grew by 20.5% YoY. IT sees a
Takeaways from management commentary
15 October 2015
3

MindTree
strong funnel being built for growth from these accounts for the balance of the
year.
Digital: moving the needle for MTCL
Revenues from digital grew by 9.6% in 2Q, taking the composition of digital in
overall revenues to 36.6%.
While revenue growth in digital has been strong, the company is also seeing a
larger composition of digital in incremental deal wins. It reported deal wins with
a TCV of USD193m during the quarter, of which, USD105m was from digital.
Digital constituted to 54% of total deal wins (in value) in 2Q, compared to 30% in
1Q.
At the same time, digital is also seeing larger deal sizes compared to earlier.
Customer spending in digital can be divided into three parts: [1]
Experimentation, [2] Testing/POC, and [3] Increased order size and
implementation to a larger extent.
Although a very small portion of MTCL’s clients are currently in the third phase,
the proportion has been evolving with time. This is evident from average deal
sizes, which increased to USD448,000 in 2Q, from USD220,000k in 1Q. The
management expects this trend to continue going ahead.
Moreover, with the acquisition of Bluefin, MTCL broadened its service
capabilities into back-end systems too.
It will continue investing in building digital capabilities, including the
augmentation of its sales force, given growth driven by digital in both existing
customers, and new customers. Its acquisitions too are likely to be in digital
where the focus will be to gain capabilities faster through acquisitions.
We have increased our revenue estimates for FY16E/FY17E by 2.6%/2.8%, to
factor the revenue beat, revenues from the acquisition of Bluefin and Relational,
and given the visibility reflecting in its order book. We expect USD revenue
growth of 21.3%/18.7% in FY16E/FY17E
Our EBIT margin estimates for FY16E/17E are lower by 20bp each, owing to
investments in digital capabilities, wage hikes, and the consolidation of lower-
margin Bluefin. We model some gradual improvement in MTCL’s profitability in
FY17 – given higher SGA v/s peers, which could enjoy leverage from scale in
Digital revenues, and also marginal improvement in the current low utilization.
Consequently, our earnings estimates are revised upwards by 0.4%/2.9% for
FY16E/17E to INR73.1/INR93.2.
Revised
FY16E
FY17E
65.1
67.0
708
841
21.3
18.7
15.4
16.8
73.1
93.2
14.5%
27.5%
Earlier
FY16E
FY17E
65.2
67.0
691
818
18.3
18.4
15.6
17.0
72.8
90.6
10.6%
25.4%
Change
FY16E
FY17E
0.0%
0.0%
2.6%
2.8%
303bp
30bp
-24bp
-20bp
0.4%
2.9%
Source: MOSL
Change in estimates
Exhibit 4: Change in estimates
INR/USD
USD Revenue (m)
USD Rev growth (%)
EBIT Margin (%)
EPS (INR)
EPS growth
15 October 2015
4

MindTree
Valuation and view
MTCL has been a focused mid-tier company with play on select verticals (BFSI,
Retail, Travel, Hi-Tech) and services (Digital, IMS, ADM). Its pragmatic strategy
has been backed by strong execution, which has helped the company grow
above industry in its IT Services business (two0thirds of company’s revenue) – at
a CAGR of 17% over FY10-15.
The company remains actively focused on Digital, which continues to grow
ahead of company average. Proportion of Digital to overall revenues has
increased to 37% in 2QFY16, from 33% a year ago. The push continues to
announcement of two acquisitions announced with 1QFY16 results – around
SAP HANA and CPG analytics. Synergies in both these deals are started to show
up, with several integrated deals in the pipeline. We believe that acquisitive
intent is the right approach in the Digital solutions segment.
With continued traction in Digital / SMAC, in the near term, expect the growth
at MTCL to beat the industry average in the near-to-medium term, despite
sluggishness in 2 out of its top-10 accounts. 37% revenue exposure to SMAC
augurs well for company’s growth, and the company continues to actively invest
in building capabilities and leadership in this area. Moreover, Digital is becoming
a key aspect in mining existing accounts, and in getting an entry-point into new
ones.
At 18.5% EBITDA margin, MTCL has more levers to expand the same compared
to peers, with current SGA run rate of ~23% well above other companies. Even
utilization including trainees at ~73% is below peers, and could see further
uptick. While the SGA may not come down immediately, risk to margins is the
least among tier-II IT.
At 19.2x FY16E, and 15.0x FY17E EPS, the stock trades well above the average
across its listed history (7 years). We expect the company to grow its USD
revenues at a CAGR of 20% over FY15-17E and EPS at a CAGR of 20.8% during
this period. We believe that premium to historical average of 11x is justified
considering: [1] the turnaround following acquisition of Kyocera and product
foray, [2] strong execution in IT Services driving confidence of above-industry
growth, and so also strong book-to-bill in the last three quarters [3] capabilities
and expansion in Digital, and [4] Levers for margin expansion.
Our target price of INR1,400 discounts FY17E EPS by 15x – implying negligible
upside to CMP. Maintain
Neutral
on valuations. MTCL is our preferred business
models in tier-II IT from a long term perspective.
Key triggers
Change in growth and outlook for Hi-Tech vertical
Steady increase in revenue contribution from Digital
Uptick in margins on SGA rationalization
Key risk factors
Risk from vendor consolidation as client concentration is high
Margin decline from appreciation of INR
Continued volatility in Hi-tech vertical
15 October 2015
5

MindTree
Exhibit 5: 1-year forward PE band
30
20
12.0
10
0
11.5
4.0
PE (x)
Median(x)
Peak(x)
Min(x)
Avg(x)
27.3
16.9
Exhibit 6: 1-year forward PB band
6.5
5.0
3.5
2.0
0.5
2.3
1.1
2.5
PB (x)
Median(x)
Peak(x)
Min(x)
5.1
Avg(x)
4.4
15 October 2015
6

MindTree
Story in charts
Exhibit 7: Strong deal wins continue driving revenue
visibility
Deal Wins (USDm)
165
133
165
152
164
34.7
32
32
33
33
32
207.9
193
Exhibit 8: ..driven by Digital/SMAC based revenues
Digital Revenues
In USD m
% of Revenues
36.6
42.5
4QFY14 1QFY15 2QFY15 3QFY15 4QFY15 1QFY16 2QFY16
Source: Company, MOSL
45.2
48.5
48.7
47.3
53.8
66.0
4QFY14 1QFY15 2QFY15 3QFY15 4QFY15 1QFY16 2QFY16
Source: Company, MOSL
Exhibit 9: IMS has been a key growth driver in IT Services
IMS
% of overall revenue
% of incremental revenues
48.2
43.7
26.4
12.7
16.8
18.2
Exhibit 10: Efforts proportion at onsite has
increased steadily
Efforts mix (%)
Onsite
Offshore
19.9
4.0
0.5
6.9
FY11
9.8
23.6
88.3
88.5
87.2
85.7
83.7
82.2
11.7
FY12
FY13
FY14
FY15
FY10
11.5
FY11
12.8
FY12
14.3
FY13
16.3
FY14
17.8
FY15
FY10
Source: Company, MOSL
Exhibit 11: Margins have scope for improvement
EBITDA margin (%)
SGA (%)
22.6 21.4 21.3
22.2 21.8 21.8 21.7 24.2 22.8
19.4
Exhibit 12: Utilization, SGA and pyramid are margin levers
Utilization
79.0
75.5
72.0
Incl. Trainees (%)
Excl. Trainees (%)
18.4 20.8 19.5 21.5 20.0 19.8 20.5 19.5 17.6 18.5
68.5
65.0
Source: Company, MOSL
15 October 2015
7

MindTree
Exhibit 13:
Operating Metrics
Geographic Mix - %
US
Europe
India
APAC
Service Line Mix - %
Development
Maintenance
Consulting & IP
Licensing
Package
Implementation
Independent Testing
Infrastructure Mgt &
Tech Support
IP Licensing
Vertical Mix - %
Retail, CPG &
Manufacturing
BFSI
Travel & Hospitality
Hitech & Media
Services
Others
Project Type - %
FPP
T&M
Efforts Mix - %
Onsite
Offshore
Revenue mix - %
Onsite
Offshore
Utilization - %
Including Trainees
Excluding Trainees
Client Metrics
No. Of Active Clients
New Clients added
Client Buckets
USD1m clients
USD5m clients
USD10m clients
USD20m clients
USD30m clients
USD50m clients
Client Contribution -
%
Top client
Top 5
Top 10
Revenue from Repeat
business
1QFY14
57.8
27.4
5.8
9.0
37.8
22.5
2.8
3.2
18
14.3
1.5
2QFY14
57.5
28.8
4.9
8.7
37.2
22.7
3
2.5
17.6
16.3
0.8
3QFY14
57.6
28.3
4.7
9.3
35.4
23.7
3.3
2.4
16.6
17.8
0.7
4QFY14
58.8
28.0
3.7
9.4
33.1
22.6
3.8
4.1
16.7
18.6
1.1
1QFY15
59.2
26.8
3.5
10.5
33.9
20.6
3.8
5.4
15.7
18.9
1.7
2QFY15
60.4
26.1
4.0
9.6
33.4
21.2
4.2
5.4
15.5
18.7
1.6
3QFY15
63.1
24.2
4.1
8.6
34.0
21.4
4.1
5.8
15.4
17.6
1.6
4QFY15
64.9
23.7
3.6
7.8
33.2
20.8
3.9
7.5
17.5
15.4
1.7
1QFY16
67.5
21.9
3.4
7.2
33.4
21.7
3.7
7.2
17.7
14.9
1.4
2QFY16
63.2
26.6
3.2
7.0
31.8
21.0
2.8
13.3
12.8
17.0
1.3
20.9
22.8
14.5
34.1
7.7
21.6
22.7
20.1
28.5
7.1
21.5
23.3
20.6
27
7.6
22.1
23.3
15.4
31.8
7.4
21.2
22.7
16.4
32.7
7.0
21.6
22.8
17.1
32.7
5.8
22.2
23.5
16.2
32.7
5.4
21.7
25.0
16.0
32.6
4.7
22.0
26.4
15.5
31.7
4.3
20.6
24.7
13.9
30.4
10.5
40.8
59.2
15.1
84.9
38.7
61.3
40.4
59.6
16.5
83.5
41.4
58.6
41.4
58.6
16.3
83.7
42.8
57.2
42.5
57.5
17.2
82.8
43.8
56.2
43.8
56.2
17.0
83.0
44.2
55.8
43.6
56.4
17.6
82.4
45.6
54.4
46.5
53.5
18.2
81.8
45.8
54.2
46.5
53.5
18.5
81.5
47.1
52.9
48.9
51.1
18.6
81.4
48.1
51.9
49.7
50.3
20.0
80.0
52.4
47.6
69.6
74
65.9
70.3
67.4
68.7
68.5
68.7
72.1
72.4
73.5
74.2
71.8
74.2
70.2
71.1
70.3
71.9
71.4
73.3
222
9
72
20
10
5
3
0
220
9
70
21
10
5
3
0
208
9
68
22
13
6
3
0
207
15
73
24
13
6
3
0
206
3
75
26
13
6
3
0
200
8
77
27
13
7
4
0
201
5
83
27
13
6
4
1
217
8
88
28
14
6
4
1
218
16
88
28
13
6
0
2
296
18
92
29
13
6
0
2
7.8
31.2
46
99.4
7.9
31.6
47.5
99.4
7.8
32.3
48.9
99.6
8.2
33.1
49.2
99.1
8.7
32.3
49.0
99.2
9.1
32.4
48.8
99.7
9.6
32.5
48.1
99.4
10.1
32.3
47.3
11.0
33.2
48.5
10.7
31.8
45.5
99.2
98.9
98.9
Source: MOSL, Company
15 October 2015
8

MindTree
Financials and valuations
Key Assumptions
Y/E March
INR/USD Rate
Revenues (USD m)
Offshore Revenue (%)
Total Headcount
Per Capita Productivity (USD)
Offshore Uilization (%)
Volume growth (%)
Blended Pricing Change (%)
FY10
47.6
272
71.6
8,297
32,813
69.9
FY11
45.6
331
69.8
9,547
34,660
70.2
20.9
0.5
FY11
15,091
16.4
10,145
3,164
1,781
11.8
712
4
86
155
1,307
222
17.0
1,085
-49.7
FY12
47.6
403
66.4
11,674
34,489
69.9
16.5
4.4
FY12
19,152
26.9
12,261
3,961
2,930
15.3
695
5
188
197
2,615
430
16.4
2,185
101.4
FY13
54.2
436
62.4
11,430
38,114
70.4
6.4
1.7
FY13
23,618
23.3
14,274
4,484
4,860
20.6
624
10
350
-340
4,236
847
20.0
3,389
55.1
FY14
60.4
502
58.2
13,218
37,948
67.8
13.3
1.6
FY14
30,316
28.4
17,820
6,394
6,102
20.1
809
4
376
120
5,785
1,275
22.0
4,510
34.1
FY15
61.0
584
54.3
14,795
39,458
71.9
13.4
2.7
FY15
35,619
17.5
20,741
7,786
7,092
19.9
1,018
1
656
179
6,908
1,545
22.4
5,363
18.5
FY16E
65.1
708
48.1
16,825
42,098
70.7
17.6
3.2
FY16E
46,134
29.5
27,156
10,577
8,402
18.2
1,308
6
499
337
7,923
1,780
22.5
6,143
14.4
FY17E
67.0
841
46.3
19,096
44,027
71.5
16.0
2.4
FY17E
56,331
22.1
32,935
12,459
10,936
19.4
1,487
8
522
143
10,106
2,274
22.5
7,832
27.6
Income Statement
Y/E March
Sales
Change (%)
Cost of Services
SG&A Expenses
EBITDA
% of Net Sales
Depreciation
Interest
Other Income
Forex
PBT
Tax
Rate (%)
PAT
Change (%)
FY10
12,960
4.7
7,982
2,512
2,466
19.0
652
27
96
673
2,557
398
15.6
2,159
387.8
(INR Million)
Balance Sheet
Y/E March
Share Capital
Reserves
Net Worth
Loan
Capital Employed
Gross Block
Less : Depreciation
Net Block
CWIP
Other LT Assets
Investments
Curr. Assets
Current Investments
Debtors
Cash & Bank Balance
Loans & Advances
Other Current Assets
Current Liab. & Prov
Net Current Assets
Deferred Tax
Application of Funds
E: MOSL Estimates
15 October 2015
FY10
395
6,311
6,706
31
6,737
5,133
2,521
2,612
247
154
1,442
4,671
0
2,370
403
1,898
0
2,603
2,068
214
6,737
FY11
400
7,362
7,762
371
8,133
5,624
2,673
2,951
1
582
7
6,403
1,105
2,825
459
350
1,664
2,027
4,376
216
8,133
FY12
405
9,167
9,572
71
9,643
5,820
3,272
2,548
85
844
7
9,541
3,075
4,078
602
219
1,567
3,703
5,838
321
9,643
FY13
415
12,722
13,137
89
13,226
6,457
3,896
2,561
571
1,691
230
11,497
4,027
4,508
1,252
430
1,280
3,684
7,813
360
13,226
FY14
417
15,988
16,405
195
16,600
6,886
3,621
3,265
496
1,967
175
14,688
5,160
6,004
1,184
613
1,727
4,393
10,295
402
16,600
FY15
837
19,287
20,124
357
20,485
8,879
4,366
4,513
354
2,699
8
18,526
5,343
6,963
3,763
836
1,621
6,064
12,462
449
20,485
(INR Million)
FY16E
838
23,150
23,988
779
24,767
12,365
5,674
6,691
43
6,759
156
17,455
2,710
9,926
2,232
941
1,647
6,855
10,600
518
24,767
FY17E
838
28,549
29,387
779
30,166
15,075
7,161
7,914
43
6,759
156
22,850
2,710
11,700
5,685
1,108
1,647
8,074
14,776
518
30,166
9

MindTree
Financials and valuations
Ratios
Y/E March
Basic (INR)
EPS
Cash EPS
Book Value
DPS
Payout %
Valuation (x)
P/E
Cash P/E
EV/EBITDA
EV/Sales
Price/Book Value
Dividend Yield (%)
Profitability Ratios (%)
RoE
RoCE
Turnover Ratios
Debtors (Days)
Fixed Asset Turnover (x)
FY10
52.8
69.1
164.8
3.0
5.7
FY11
12.4
21.9
94.7
2.5
20.2
FY12
26.9
35.1
116.7
4.0
14.9
FY13
40.9
48.0
157.3
6.0
14.7
FY14
53.9
63.5
195.7
12.5
23.2
22.8
19.4
15.7
3.2
6.3
1.0
35.3
25.6
67
5.0
15.0
14.3
68
5.1
25.2
25.1
78
7.5
29.8
37.0
70
9.2
30.5
35.5
72
9.3
FY15
63.9
76.0
239.5
17.0
26.6
19.2
16.2
13.2
2.6
5.1
1.4
29.4
32.8
71
7.9
FY16E
73.1
88.6
285.4
23.0
31.5
19.2
15.8
13.4
2.4
4.9
1.6
27.9
31.3
79
6.9
FY17E
93.2
110.9
349.6
24.0
25.8
15.0
12.6
10.0
1.9
4.0
1.7
29.3
34.4
76
7.1
Cash Flow Statement
Y/E March
CF from Operations
Cash for Working Capital
Net Operating CF
Net Purchase of FA
Net Cash from Invest.
Proc. from equity issues
Proceeds from LTB/STB
Dividend Payments
Cash Flow from Fin.
Exchange difference
Net Cash Flow
Opening Cash Bal.
Add: Net Cash
Closing Cash Bal.
E: MOSL Estimates
FY10
1,629
673
2,302
-745
-1,004
94
-1,390
-46
-1,342
-8
-52
488
(52)
403
FY11
1,277
-844
433
-836
-383
139
13
-150
2
4
56
403
56
459
FY12
2,551
-523
2,028
-410
-2,327
120
398
-176
342
100
143
459
143
602
FY13
3,267
-603
2,664
-1,057
-1,919
322
-233
-214
-125
30
650
602
650
1,252
FY14
4,985
-1,766
3,219
-1,517
-2,243
63
-252
-924
-1,113
70
-67
1,252
-67
1,184
FY15
5,546
489
6,035
-1,851
-1,028
420
-4
-1,712
-1,296
-197
3,514
1,184
3,514
3,763
(INR Million)
FY16E
6,616
-2,277
4,339
-3,175
-2,824
1
-5
-2,331
-2,335
0
-821
3,763
-821
2,232
FY17E
8,654
-723
7,932
-2,710
-2,188
0
0
-2,433
-2,433
0
3,310
2,232
3,310
5,685
15 October 2015
10

MindTree
Corporate profile
Company description
MindTree (MTCL) is a global information
technology solutions company, with revenue of
over USD550m (LTM) and over 13,000 employees.
It is a strategic partner to many Fortune 500
enterprises, providing services in areas like
Application
Development,
Application
Maintenance,
Consulting,
Testing
and
Infrastructure Services, across industries like BFSI,
Travel and Retail. It enables customers to achieve
competitive advantage through flexible and next
generation global delivery models, agile
methodologies and expert frameworks.
Exhibit 15: Shareholding pattern (%)
Jun-15
Promoter
DII
FII
Others
13.7
7.4
37.9
41.1
Mar-15
13.7
7.9
37.7
40.7
Jun-14
16.4
10.0
36.4
37.2
Exhibit 14: Sensex rebased
1,600
1,400
1,200
1,000
800
Oct-14
Mindtree
Sensex - Rebased
Jan-15
Apr-15
Jul-15
Oct-15
Exhibit 16: Top holders
Holder Name
Coffee Day Enterprises Pvt Ltd
Nalanda India Fund Ltd
Coffee Day Trading Ltd
Matthews India Fund
V G Siddhartha
% Holding
10.4
9.4
6.3
3.4
3.0
Note: FII Includes depository receipts
Exhibit 17: Top management
Name
Subroto Bagchi
Dr. Albert Hieronimus
Krishnakumar Natarajan
Parthasarathy N.S
Rostow Ravanan
Designation
Chairman
Vice Chairman & Director
CEO and MD
ED, President, COO
Executive Director & CFO
Exhibit 18: Directors
Name
Dr. Albert Hieronimus*
Subroto Bagchi
Krishnakumar Natarajan
Pankaj Chandra*
Apurva Purohit*
Name
Manisha Girotra*
Ramesh Ramanathan*
Siddhartha V G
N S Parthasarathy
Rostow Ravanan
*Independent
Exhibit 19: Auditors
Name
BSR & Co LLP
Deloitte Haskins & Sells
G Sankar Prasad
Type
Statutory
Statutory
Secretarial Audit
Exhibit 20: MOSL forecast v/s consensus
EPS
(INR)
FY16
FY17
MOSL
forecast
73.1
93.2
Consensus
forecast
70.0
80.5
Variation
(%)
4.4
15.8
15 October 2015
11

This document has been prepared by Motilal Oswal Securities Limited (hereinafter referred to as Most) to provide information about the company(ies) and/sector(s), if any, covered in the report and may be distributed
MindTree
by it and/or its affiliated company(ies). This report is for personal information of the selected recipient/s and does not construe to be any investment, legal or taxation advice to you. This research report does not
constitute an offer, invitation or inducement to invest in securities or other investments and Motilal Oswal Securities Limited (hereinafter referred as MOSt) is not soliciting any action based upon it. This report is not for
public distribution and has been furnished to you solely for your general information and should not be reproduced or redistributed to any other person in any form. This report does not constitute a personal
recommendation or take into account the particular investment objectives, financial situations, or needs of individual clients. Before acting on any advice or recommendation in this material, investors should consider
whether it is suitable for their particular circumstances and, if necessary, seek professional advice. The price and value of the investments referred to in this material and the income from them may go down as well as
up, and investors may realize losses on any investments. Past performance is not a guide for future performance, future returns are not guaranteed and a loss of original capital may occur.
MOSt and its affiliates are a full-service, integrated investment banking, investment management, brokerage and financing group. We and our affiliates have investment banking and other business relationships with a
some companies covered by our Research Department. Our research professionals may provide input into our investment banking and other business selection processes. Investors should assume that MOSt and/or
its affiliates are seeking or will seek investment banking or other business from the company or companies that are the subject of this material and that the research professionals who were involved in preparing this
material may educate investors on investments in such business. The research professionals responsible for the preparation of this document may interact with trading desk personnel, sales personnel and other
parties for the purpose of gathering, applying and interpreting information. Our research professionals are paid on the profitability of MOSt which may include earnings from investment banking and other business.
MOSt generally prohibits its analysts, persons reporting to analysts, and members of their households from maintaining a financial interest in the securities or derivatives of any companies that the analysts cover.
Additionally, MOSt generally prohibits its analysts and persons reporting to analysts from serving as an officer, director, or advisory board member of any companies that the analysts cover. Our salespeople, traders,
and other professionals or affiliates may provide oral or written market commentary or trading strategies to our clients that reflect opinions that are contrary to the opinions expressed herein, and our proprietary
trading and investing businesses may make investment decisions that are inconsistent with the recommendations expressed herein. In reviewing these materials, you should be aware that any or all of the foregoing
among other things, may give rise to real or potential conflicts of interest. MOSt and its affiliated company(ies), their directors and employees and their relatives may; (a) from time to time, have a long or short position
in, act as principal in, and buy or sell the securities or derivatives thereof of companies mentioned herein. (b) be engaged in any other transaction involving such securities and earn brokerage or other compensation
or act as a market maker in the financial instruments of the company(ies) discussed herein or act as an advisor or lender/borrower to such company(ies) or may have any other potential conflict of interests with
respect to any recommendation and other related information and opinions.; however the same shall have no bearing whatsoever on the specific recommendations made by the analyst(s), as the recommendations
made by the analyst(s) are completely independent of the views of the affiliates of MOSt even though there might exist an inherent conflict of interest in some of the stocks mentioned in the research report
Reports based on technical and derivative analysis center on studying charts company's price movement, outstanding positions and trading volume, as opposed to focusing on a company's fundamentals and, as
such, may not match with a report on a company's fundamental analysis. In addition MOST has different business segments / Divisions with independent research separated by Chinese walls catering to different set
of customers having various objectives, risk profiles, investment horizon, etc, and therefore may at times have different contrary views on stocks sectors and markets.
Unauthorized disclosure, use, dissemination or copying (either whole or partial) of this information, is prohibited. The person accessing this information specifically agrees to exempt MOSt or any of its affiliates or
employees from, any and all responsibility/liability arising from such misuse and agrees not to hold MOSt or any of its affiliates or employees responsible for any such misuse and further agrees to hold MOSt or any of
its affiliates or employees free and harmless from all losses, costs, damages, expenses that may be suffered by the person accessing this information due to any errors and delays. The information contained herein is
based on publicly available data or other sources believed to be reliable. Any statements contained in this report attributed to a third party represent MOSt’s interpretation of the data, information and/or opinions
provided by that third party either publicly or through a subscription service, and such use and interpretation have not been reviewed by the third party. This Report is not intended to be a complete statement or
summary of the securities, markets or developments referred to in the document. While we would endeavor to update the information herein on reasonable basis, MOSt and/or its affiliates are under no obligation to
update the information. Also there may be regulatory, compliance, or other reasons that may prevent MOSt and/or its affiliates from doing so. MOSt or any of its affiliates or employees shall not be in any way
responsible and liable for any loss or damage that may arise to any person from any inadvertent error in the information contained in this report. MOSt or any of its affiliates or employees do not provide, at any time,
any express or implied warranty of any kind, regarding any matter pertaining to this report, including without limitation the implied warranties of merchantability, fitness for a particular purpose, and non-infringement.
The recipients of this report should rely on their own investigations.
This report is intended for distribution to institutional investors. Recipients who are not institutional investors should seek advice of their independent financial advisor prior to taking any investment decision based on
this report or for any necessary explanation of its contents.
Most and it’s associates may have managed or co-managed public offering of securities, may have received compensation for investment banking or merchant banking or brokerage services, may have received any
compensation for products or services other than investment banking or merchant banking or brokerage services from the subject company in the past 12 months.
Most and it’s associates have not received any compensation or other benefits from the subject company or third party in connection with the research report.
Subject Company may have been a client of Most or its associates during twelve months preceding the date of distribution of the research report
MOSt and/or its affiliates and/or employees may have interests/positions, financial or otherwise of over 1 % at the end of the month immediately preceding the date of publication of the research in the securities
mentioned in this report. To enhance transparency, MOSt has incorporated a Disclosure of Interest Statement in this document. This should, however, not be treated as endorsement of the views expressed in the
report.
Motilal Oswal Securities Limited is registered as a Research Analyst under SEBI (Research Analyst) Regulations, 2014. SEBI Reg. No. INH000000412
There are no material disciplinary action that been taken by any regulatory authority impacting equity research analysis activities
Analyst Certification
The views expressed in this research report accurately reflect the personal views of the analyst(s) about the subject securities or issues, and no part of the compensation of the research analyst(s) was, is, or will be
directly or indirectly related to the specific recommendations and views expressed by research analyst(s) in this report. The research analysts, strategists, or research associates principally responsible for preparation
of MOSt research receive compensation based upon various factors, including quality of research, investor client feedback, stock picking, competitive factors and firm revenues
Disclosure of Interest Statement
Analyst ownership of the stock
Served as an officer, director or employee
MINDTREE
No
No
Disclosures
A graph of daily closing prices of securities is available at www.nseindia.com and http://economictimes.indiatimes.com/markets/stocks/stock-quotes
Regional Disclosures (outside India)
For U.S.
This report is not directed or intended for distribution to or use by any person or entity resident in a state, country or any jurisdiction, where such distribution, publication, availability or use would be contrary to law,
regulation or which would subject MOSt & its group companies to registration or licensing requirements within such jurisdictions.
Motilal Oswal Securities Limited (MOSL) is not a registered broker - dealer under the U.S. Securities Exchange Act of 1934, as amended (the"1934 act") and under applicable state laws in the United States. In
addition MOSL is not a registered investment adviser under the U.S. Investment Advisers Act of 1940, as amended (the "Advisers Act" and together with the 1934 Act, the "Acts), and under applicable state laws in the
United States. Accordingly, in the absence of specific exemption under the Acts, any brokerage and investment services provided by MOSL, including the products and services described herein are not available to or
intended for U.S. persons.
This report is intended for distribution only to "Major Institutional Investors" as defined by Rule 15a-6(b)(4) of the Exchange Act and interpretations thereof by SEC (henceforth referred to as "major institutional
investors"). This document must not be acted on or relied on by persons who are not major institutional investors. Any investment or investment activity to which this document relates is only available to major
institutional investors and will be engaged in only with major institutional investors. In reliance on the exemption from registration provided by Rule 15a-6 of the U.S. Securities Exchange Act of 1934, as amended (the
"Exchange Act") and interpretations thereof by the U.S. Securities and Exchange Commission ("SEC") in order to conduct business with Institutional Investors based in the U.S., MOSL has entered into a chaperoning
agreement with a U.S. registered broker-dealer, Motilal Oswal Securities International Private Limited. ("MOSIPL"). Any business interaction pursuant to this report will have to be executed within the provisions of this
chaperoning agreement.
The Research Analysts contributing to the report may not be registered /qualified as research analyst with FINRA. Such research analyst may not be associated persons of the U.S. registered broker-dealer, MOSIPL,
and therefore, may not be subject to NASD rule 2711 and NYSE Rule 472 restrictions on communication with a subject company, public appearances and trading securities held by a research analyst account.
Motilal Oswal Capital Markets Singapore Pte Limited is acting as an exempt financial advisor under section 23(1)(f) of the Financial Advisers Act(FAA) read with regulation 17(1)(d) of the Financial Advisors
Regulations and is a subsidiary of Motilal Oswal Securities Limited in India. This research is distributed in Singapore by Motilal Oswal Capital Markets Singapore Pte Limited and it is only directed in Singapore to
accredited investors, as defined in the Financial Advisers Regulations and the Securities and Futures Act (Chapter 289), as amended from time to time.
In respect of any matter arising from or in connection with the research you could contact the following representatives of Motilal Oswal Capital Markets Singapore Pte Limited:
Kadambari Balachandran
Email : kadambari.balachandran@motilaloswal.com
Contact : (+65) 68189233 / 65249115
Office Address : 21 (Suite 31),16 Collyer Quay,Singapore 04931
For Singapore
15 October 2015
Motilal Oswal Tower, Level 9, Sayani Road, Prabhadevi, Mumbai 400 025
Phone: +91 22 3982 5500 E-mail: reports@motilaloswal.com
Motilal Oswal Securities Ltd
12