21 October 2015
2QFY16 Results Update | Sector:
Logistics
Container Corporation
BSE SENSEX
27,288
Bloomberg
Equity Shares (m)
M.Cap. (INR b)/(USD b)
52-Week Range (INR)
1, 6, 12 Rel. Per (%)
12M Avg Val (INR M)
Free float (%)
S&P CNX
8,252
CCRI IN
195.0
287.4/4.4
1944 / 1204
1/-7/10
375
38.2
CMP: INR1,470
TP: INR1,700 (+16%)
Buy
Financials & Valuation (INR Billion)
Y/E MAR
Sales
EBITDA
NP
EPS (INR)
2015
61.5
14.0
10.5
54.1
2016E 2017E
60.4
12.6
9.2
47.2
-12.7
418.5
11.8
15.7
31.2
3.5
66.4
15.4
11.4
58.4
23.6
459.3
13.3
17.4
25.2
3.2
EPS Gr. (%) 11.7
BV/Sh(INR) 385.5
RoE (%)
RoCE (%)
P/E (x)
P/BV (x)
14.7
18.2
27.3
3.8
Estimate change
TP change
Rating change
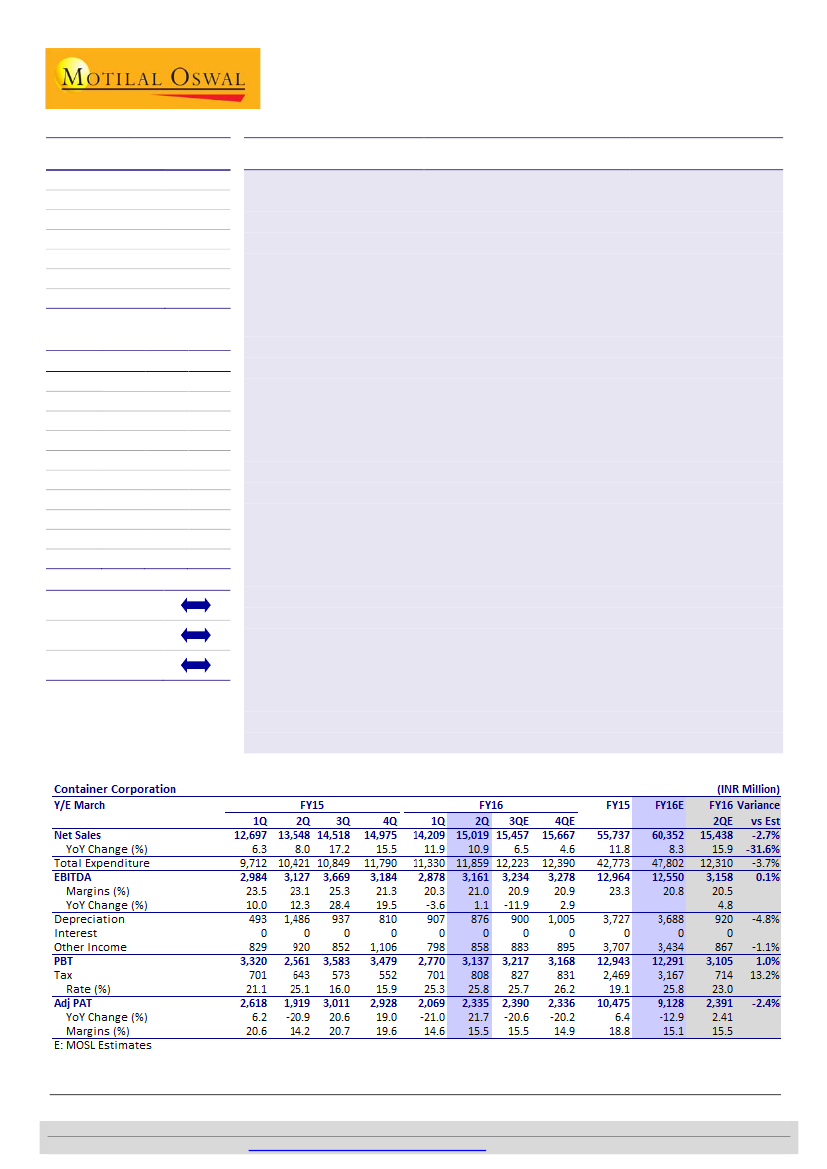
EBITDA, volumes in line with estimates, expect better volumes in 2H
Container Corporation (CCRI IN) reported largely in-line EBITDA at INR3.2b (+1%
YoY, +10% QoQ). Despite marginally lower revenue at INR15.0b (est. INR15.4b;
+11% YoY, +6% QoQ), EBITDA was in-line led by improved profitability in both,
EXIM as well as domestic segments.
Adj. PAT stood at INR2.3b (est. INR2.4b; +22% YoY, +13% QoQ), impacted by
higher-than-expected tax rate at 25.8% (est. 23.0%) and lower-than-expected
other income at INR858m (est. INR867m; -7% YoY, +8% QoQ).
Overall volumes stood at 0.75m teu (-6% YoY and +4% QoQ), led by EXIM at 0.6m
teu (-4% YoY, +6% QoQ) and domestic at 0.1m teu (-14% YoY, -3% QoQ). The
domestic decline was mainly due to 26-28% increase in haulage charge. We
model flat YoY volumes in FY16. Management indicated that they will review
their volume growth guidance of ~8% growth at end-3QFY16.
Realization (in INR/teu) in EXIM stood at 19,070 (+19% YoY, +1% QoQ) and
domestic at 25,445 (+16% YoY, +4% QoQ). The YoY increase in realization was led
by higher haulage rates.
EBIT per unit (in INR/teu) in EXIM stood at 3,660 (+38% YoY, +5% QoQ) and
domestic at 489 (-43% YoY, +25% QoQ).
Valuation and view
While DFC (Dedicated Freight Corridor) completion (expected in 2018/2019) will
be a significant efficiency driver for CCRI, its investments in long-gestation
MMLP’s will impact near-term ratios though.
The stock trades at 25.3x FY17E EPS of INR58. While the near term profitability
remains subdued with weak volume growth, expect CCRI to continue to trade at
rich valuations led by long term DFC led upsides in volume (market share gain
from road) and profitability (double stacking and efficiency benefit). We use DCF-
based (WACC 11.9%, TGR 5%) valuation to arrive at a fair value of INR1,700/sh for
CCRI imply 16% upside. Maintain
Buy.
Harshad Borawake
(HarshadBorawake@MotilalOswal.com); +91 22 3982 5432
Rajat Agarwal
(Rajat.Agarwal@MotilalOswal.com); +91 22 3982 5558
Investors are advised to refer through disclosures made at the end of the Research Report.
Motilal Oswal research is available on
www.motilaloswal.com/Institutional-Equities,
Bloomberg, Thomson Reuters, Factset and S&P Capital.

Container Corporation
Exhibit 1: Container Corp – 2QFY16 Financial Summary (INR m)
Net Sales
Terminal & Service Charges
Employee Expenses
Other Expenses
EBITDA
EBITDA margin (%)
Depreciation
EBIT
Interest
Other Income
PBT
Total Tax
Tax rate (%)
PAT
EPS (INR)
1QFY15
12,697
7,430
323
1,960
2,985
24%
493
2,491
0
829
3,320
701
21%
2,619
13.4
2QFY15
13,548
9,288
474
659
3,127
23%
1,486
1,641
0
920
2,562
643
25%
1,919
9.8
3QFY15
14,518
9,758
410
682
3,669
25%
937
2,731
0
852
3,584
573
16%
3,011
15.4
4QFY15
14,975
8,934
373
2,482
3,185
21%
810
2,375
0
1,106
3,481
552
16%
2,927
15.0
1QFY16
14,209
8,963
373
1,994
2,879
20%
907
1,972
0
798
2,770
701
25%
2,069
10.6
2QFY16
15,019
9,456
369
2,034
3,161
21%
876
2,286
0
858
3,144
808
26%
2,329
11.9
YoY (%)
10.9%
1.8%
-22.1%
208.4%
1.1%
-8.8%
-41.1%
39.3%
n.a.
-6.8%
22.7%
25.8%
QoQ (%)
5.7%
5.5%
-1.0%
2.0%
9.8%
3.9%
-3.4%
15.9%
n.a.
7.5%
13.5%
15.3%
21.4%
12.6%
21.4%
12.6%
Source: Company, MOSL
Exhibit 2: Container Corp – Segmental revenue and profitability -
1QFY15
Revenue (INRm)
EXIM
Domestic
Total Segment Revenue
Segmental EBIT
EXIM
Domestic
Total
EBIT Margin (%)
EXIM
Domestic
Total
9,788
2,909
12,697
2,319
312
2,630
23.7%
10.7%
20.7%
2QFY15
10,885
2,663
13,548
1,791
103
1,894
16.5%
3.9%
14.0%
3QFY15
11,886
2,632
14,518
2,924
139
3,064
24.6%
5.3%
21.1%
4QFY15
11,853
3,121
14,973
2,387
232
2,619
20.1%
7.4%
17.5%
1QFY16
11,570
2,639
14,209
2,139
42
2,181
18.5%
1.6%
15.3%
2QFY16
12,366
2,653
15,019
2,374
51
2,425
YoY (%)
13.6%
-0.4%
10.9%
32.5%
-50.7%
28.0%
QoQ (%)
6.9%
0.6%
5.7%
11.0%
20.9%
11.2%
19.2%
1.9%
16.1%
Source: Company, MOSL
Exhibit 3: Container Corp – Realization snapshot
1QFY15
Volumes (TEU)
EXIM
Domestic
Total
Realizations (INR / TEU)
EXIM
Domestic
Total
EBIT (INR/TEU)
EXIM
Domestic
Total
631,908
134,845
766,753
15,490
21,570
16,559
3,670
2,311
3,431
2QFY15
676,922
121,168
798,090
16,079
21,981
16,975
2,646
853
2,374
3QFY15
665,130
115,313
780,443
17,870
22,823
18,602
4,397
1,207
3,925
4QFY15
647,425
118,045
765,470
18,307
26,437
19,561
3,686
1,967
3,421
1QFY16
614,353
107,742
722,095
18,833
24,490
19,677
3,481
392
3,020
2QFY16
648,466
104,278
752,744
19,070
25,445
19,953
3,660
489
3,221
YoY (%)
-4.2%
-13.9%
-5.7%
18.6%
15.8%
17.5%
QoQ (%)
5.6%
-3.2%
4.2%
1.3%
3.9%
1.4%
38.3%
5.2%
-42.7%
24.9%
35.7%
6.7%
Source: Company, MOSL
21 October 2015
2

Container Corporation
Exhibit 4: Concor – Quarterly domestic and EXIM volume trend (‘000 TEU)
Volumes ('000 TEU)
676
120
555
660
125
536
629
96
533
634
106
528
637
114
523
686
117
568
EXIM
662
114
548
Domestic
723
120
603
Total
722
127
595
762
146
767
135
798
121
780
115
765
118
722
108
614
753
104
616
632
677
665
647
648
3Q
4Q
1Q
2Q
FY13
3Q
4Q
1Q
2Q
FY14
3Q
4Q
1Q
2Q
FY15
3Q
4Q
1Q
FY16
2Q
Source: Company, MOSL
Exhibit 5: Concor – Quarterly domestic and EXIM YoY volume growth trend (‘000 TEU)
Volume growth (YoY %)
30
20
10
-
(10)
(20)
(30)
3Q
4Q
1Q
EXIM
Domestic
Total
2Q
FY13
3Q
4Q
1Q
2Q
FY14
3Q
4Q
1Q
2Q
FY15
3Q
4Q
1Q
FY16
2Q
Source: Company, MOSL
Exhibit 6: Concor – Quarterly domestic and EXIM per TEU realization trend (INR/TEU)
Realization (INR/TEU)
28,000
24,000
20,000
16,000
12,000
3Q
4Q
1Q
2Q
FY13
3Q
4Q
1Q
2Q
FY14
3Q
4Q
1Q
2Q
FY15
3Q
4Q
1Q
FY16
Source: Company, MOSL
2Q
EXIM
Domestic
Total
21 October 2015
3

Container Corporation
Exhibit 7: Concor – Quarterly domestic and EXIM per TEU EBIT trend (INR/TEU)
EBIT (INR/TEU)
3,600
2,400
1,200
-
3Q
4Q
1Q
2Q
FY13
3Q
4Q
1Q
2Q
FY14
3Q
4Q
1Q
2Q
FY15
3Q
4Q
1Q
FY16
Source: Company, MOSL
2Q
EXIM
Total
Domestic - RHS
450
300
150
-
Key takeaways from concall
Management expects 2H volumes to be better than 1H, helped by likely
improvement in the port volumes and smooth operations at Pipavav/Mundra
which was impacted in 1H flooding led rail line disruptions.
Volumes from Pipavav port reduced to 2,086 TEUs in 2QFY16 TEUs from 19,334
TEUs in 2QFY15. Mundra port volumes reduced to 22,722 TEUs in 2QFY16 from
29,722 TEUs in 2QFY15. The volumes were reduced due to temporary
disruptions.
The management is confident of achieving the 7-8% volume growth in FY16 (we
model 0%) despite weaker volumes in the first half. New logistics parks will be
setup in Uttar Pradesh (2) and Harayana (1) over and above the 15 MMLPs that
have already been announced. 4 logistics parks have become operational.
The capex guidance for FY16 stands at INR11b with marginal increase expected
in FY17.
Khatuwas terminal will become operational shortly. The transit operations have
already been started partly.
Valuation and view
CCRI is a direct play on the upcoming large rail infrastructure (DFCs), revival in
economic growth and higher containerization. While DFC (Dedicated Freight
Corridor) completion (expected in 2018/2019) will be a significant efficiency
driver for CCRI, its investments in long-gestation MMLP’s will impact near-term
ratios though.
Key factors to watch out are (a) EXIM growth trend, (b) expansion of port
capacities (JNPT in the near term) and (b) completion of DFCs.
Key risks include (a) lower-than-expected GDP growth, (b) sharp increase in
haulage rates, (c) delay in DFCs completion and (d) any increase in export-
import imbalance.
Given the debt free balance sheet, we expect the dividend payout (currently at
25%) to increase in the next few years as it nears the end of its ongoing large
capex cycle, which is funded fully through equity.
We cut our FY17 earnings by 5% to model higher tax rate at 24% v/s 22% earlier.
The stock trades at 25.3x FY17E EPS of INR58. While the near term profitability
remains subdued with weak volume growth, expect CCRI to continue to trade at
4
21 October 2015

Container Corporation
rich valuations led by long term DFC led upsides in volume (market share gain
from road) and profitability (double stacking and efficiency benefit). We use
DCF-based (WACC 11.9%, TGR 5%) valuation to arrive at a fair value of
INR1,700/sh for CCRI imply 16% upside. Maintain Buy.
Exhibit 8: Concor – Key Assumptions
Y/E March
Volumes - TEU
EXIM
Domestic
Total
Volumes (% Share)
EXIM
Domestic
Total
Realization (INR/TEU)
EXIM
Domestic
Total
FY12
2,136
468
2,604
32,666
7,954
41,009
15,293
16,983
15,746
FY13
2,152
434
2,586
35,398
8,662
44,450
16,449
19,975
17,191
FY14
2,361
507
2,869
38,900
11,332
51,085
16,473
22,344
17,808
FY15
2,621
489
3,111
44,412
11,325
55,737
16,942
23,141
17,917
FY16E
2,621
422
3,043
49,730
10,622
60,352
18,973
25,168
19,832
FY17E
2,883
464
3,347
54,703
11,684
66,387
FY18E
3,229
520
3,749
61,267
13,086
74,354
18,973
18,973
25,168
25,168
19,832
19,832
Source: Company, MOSL
21 October 2015
5

Container Corporation
Story in charts
Exhibit 9: Model 6% volume CAGR over FY14-17E
Volumes
(million TEUs)
2.6
2.6
0.5
0.4
EXIM
3.1
0.5
3.3
0.5
3.7
0.5
11
1
2.9
3.2
10
11
1
10
Exhibit 10: Expect EBITDA to post 11% CAGR led by volume
growth and improvement in profitability
EBITDA
(INR b)
12
1
10
12
12
15
17
EXIM
14
2
13
1
16
1
19
2
2.9
0.5
3.0
0.4
2.1
2.2
2.4
2.6
2.6
FY12
FY13
FY14
FY15
FY16E
FY17E
FY18E
FY12
FY13
FY14
FY15
FY16E
FY17E
FY18E
Source: Company, MOSL
Exhibit 11: Capex intensity to remain high…
Capex (INRb)
9.4
5.9
4.6
3.2
2.2
3.1 3.1
2.3
10.3 10.1 10.0
Exhibit 12: ...resulting in lower FCF versus historical trend
FCF (INRb)
4.3
4.8
3.3
3.9
3.2
3.2
2.3
1.6
0.5
2.9
5.5
5.5
5.1
FY07 FY08 FY09 FY10 FY11 FY12 FY13 FY14 FY15 FY16 FY17 FY18
Source: Company, MOSL
FY07 FY08 FY09 FY10 FY11 FY12 FY13 FY14 FY15 FY16 FY17 FY18
Source: Company, MOSL
Exhibit 13: Also, return ratios to remain under pressure led
by capex towards long gestation MMLPs
55.0
46.0
42.2 42.4
RoE (%)
Exhibit 14: CCRI – 1 Yr forward P/E chart
40
35
30
25
20
15
10
5
PE (x)
Peak(x)
Avg(x)
Min(x)
36.9
39.1
33.8
29.9
22.6
19.4 19.0
16.5 15.8 14.4 14.7
11.9 13.2 14.5
25.5 27.5
30.5
27.8
13.8
6.3
FY09 FY10 FY11 FY12 FY13 FY14 FY15 FY16E FY17E FY18E
Source: Company, MOSL
21 October 2015
6

Container Corporation
Financials and valuations
Consolidated - Income Statement (INR Million)
Y/E March
Total Income from Operations
Change (%)
Total Expenditure
% of Sales
EBITDA
Margin (%)
Depreciation
EBIT
Int. and Finance Charges
Other Income
PBT after EO Exp.
Current Tax
Deferred Tax
Tax
Tax Rate (%)
Less: Minority Interest
Reported PAT
Adjusted PAT
Change (%)
Margin (%)
FY12
41,009
5.2
30,776
75.0
10,232
25.0
1,621
8,611
54
3,135
11,692
2,884
152
3,036
26.0
0
8,657
8,657
-1.2
21.1
FY13
44,450
8.4
33,953
76.4
10,497
23.6
1,763
8,734
32
3,326
12,027
2,406
315
2,721
22.6
0
9,306
9,306
7.5
20.9
FY14
53,167
19.6
41,644
78.3
11,523
21.7
2,357
9,167
220
3,583
12,529
2,779
293
3,072
24.5
15
9,443
9,443
1.5
17.8
FY15
61,493
15.7
47,474
77.2
14,019
22.8
4,108
9,911
183
3,470
13,198
3,189
-551
2,638
20.0
14
10,546
10,546
11.7
17.1
FY16E
60,352
-1.9
47,714
79.1
12,638
20.9
3,688
8,951
183
3,625
12,393
3,167
0
3,167
25.6
14
9,211
9,211
-12.7
15.3
FY17E
66,387
10.0
51,031
76.9
15,356
23.1
4,039
11,317
183
3,865
14,999
3,600
0
3,600
24.0
14
11,385
11,385
23.6
17.1
FY18E
74,354
12.0
56,440
75.9
17,913
24.1
4,410
13,504
183
4,372
17,693
4,246
0
4,246
24.0
14
13,433
13,433
18.0
18.1
Consolidated - Balance Sheet
Y/E March
Equity Share Capital
Preference Capital
Total Reserves
Net Worth
Minority Interest
Deferred Liabilities
Total Loans
Capital Employed
Gross Block
Less: Accum. Deprn.
Net Fixed Assets
Capital WIP
Total Investments
Curr. Assets, Loans&Adv.
Inventory
Account Receivables
Cash and Bank Balance
Loans and Advances
Curr. Liability & Prov.
Account Payables
Other Current Liabilities
Provisions
Net Current Assets
Deferred Tax assets
Appl. of Funds
E: MOSL Estimates
FY12
1,300
0
54,252
55,552
0
2,616
581
58,749
35,856
11,268
24,588
1,041
2,447
37,009
367
303
27,576
8,764
6,515
1,222
3,513
1,780
30,494
178
58,749
FY13
1,300
0
60,905
62,205
0
2,964
385
65,553
40,780
12,946
27,834
1,884
3,690
38,930
554
285
29,460
8,632
7,006
1,683
3,325
1,997
31,925
221
65,553
FY14
1,950
0
66,628
68,578
275
3,262
1,480
73,595
51,254
17,560
33,694
2,402
4,836
41,751
182
621
27,742
13,206
9,284
1,919
5,632
1,733
32,467
196
73,595
FY15
1,950
0
73,220
75,169
911
2,310
1,650
80,040
59,595
22,835
36,760
3,946
4,882
44,363
503
647
29,492
13,722
10,147
2,169
6,117
1,861
34,217
235
80,040
FY16E
1,950
0
79,649
81,598
911
2,310
1,650
86,469
65,406
26,522
38,883
8,385
4,882
45,293
505
635
30,293
13,859
11,209
2,180
6,003
3,026
34,083
235
86,469
(INR Million)
FY17E
1,950
0
87,595
89,545
911
2,310
1,650
94,416
71,505
30,561
40,944
12,336
4,882
48,685
541
699
33,448
13,997
12,667
2,332
6,603
3,731
36,019
235
94,416
FY18E
1,950
0
96,970
98,920
911
2,310
1,650
103,791
77,974
34,971
43,003
15,867
4,882
54,187
598
783
38,669
14,137
14,383
2,579
7,396
4,408
39,804
235
103,791
21 October 2015
7

Container Corporation
Financials and valuations
Ratios
Y/E March
Basic (INR)
EPS
Cash EPS
BV/Share
DPS
Payout (%)
Valuation (x)
P/E
Cash P/E
P/BV
EV/Sales
EV/EBITDA
Dividend Yield (%)
FCF per share
Return Ratios (%)
RoE
RoCE
Working Capital Ratios
Asset Turnover (x)
Inventory (Days)
Debtor (Days)
Creditor (Days)
Working Cap. Turnover (Days)
Leverage Ratio (x)
Current Ratio
Debt/Equity
FY12
66.6
79.1
427.4
16.5
28.8
FY13
71.6
85.2
478.6
17.5
28.5
FY14
48.4
60.5
351.7
12.5
30.3
30.4
24.4
4.2
4.9
22.7
0.9
8.1
14.4
19.2
0.7
1.2
4.3
19.3
32.4
4.5
0.0
FY15
54.1
75.2
385.5
13.6
30.2
27.3
19.6
3.8
4.2
18.5
0.9
11.7
14.7
18.2
0.8
3.0
3.8
19.0
28.0
4.4
0.0
FY16E
47.2
66.2
418.5
11.9
30.2
31.2
22.3
3.5
4.3
20.5
0.8
0.8
11.8
15.7
0.7
3.1
3.8
18.5
22.9
4.0
0.0
FY17E
58.4
79.1
459.3
14.7
30.2
25.2
18.6
3.2
3.8
16.6
1.0
15.0
13.3
17.4
0.7
3.0
3.8
18.0
14.1
3.8
0.0
FY18E
68.9
91.5
507.4
17.3
30.2
21.4
16.1
2.9
3.4
14.0
1.2
26.2
14.3
18.6
0.7
2.9
3.8
17.7
5.6
3.8
0.0
1.1
42.0
16.5
22.2
0.7
3.3
2.7
15.9
26.0
5.7
0.0
1.2
25.0
15.8
20.3
0.7
4.5
2.3
19.9
20.2
5.6
0.0
Consolidated - Cash Flow Statement
Y/E March
OP/(Loss) before Tax
Depreciation
Interest & Finance Charges
Direct Taxes Paid
(Inc)/Dec in WC
CF from Operations
Others
CF from Operating incl EO
(inc)/dec in FA
Free Cash Flow
(Pur)/Sale of Investments
Others
CF from Investments
(Inc)/Dec in Debt
Interest Paid
Dividend Paid
Others
CF from Fin. Activity
Inc/Dec of Cash
Opening Balance
Closing Balance
E: MOSL Estimates
FY12
11,692
1,621
-2,539
-2,000
-1,066
7,708
14
7,722
-2,267
5,455
-500
1,939
-828
110
-48
-2,342
0
-2,279
4,615
22,961
27,576
FY13
12,027
1,763
-2,977
-2,142
425
9,095
8
9,104
-5,858
3,246
-1,245
2,681
-4,422
-196
-33
-2,568
0
-2,798
1,884
27,576
29,460
FY14
12,529
2,357
220
-2,597
-2,645
9,864
-3,137
6,727
-5,145
1,582
-3,080
3,616
-4,609
-584
-238
-3,086
73
-3,835
-1,717
29,460
27,742
FY15
13,199
4,108
183
-3,653
1,058
14,896
-3,232
11,664
-9,376
2,288
-44
2,996
-6,424
167
-189
-3,130
-339
-3,490
1,749
27,742
29,492
FY16E
12,393
3,688
-3,442
-3,167
935
10,406
0
10,406
-10,250
156
0
3,625
-6,625
0
-183
-2,782
-14
-2,979
802
29,492
30,293
(INR Million)
FY17E
14,999
4,039
-3,682
-3,600
1,220
12,976
0
12,976
-10,050
2,926
0
3,865
-6,185
0
-183
-3,439
-14
-3,636
3,155
30,293
33,448
FY18E
17,693
4,410
-4,190
-4,246
1,435
15,102
0
15,102
-10,000
5,102
0
4,372
-5,628
0
-183
-4,057
-14
-4,254
5,220
33,448
38,669
21 October 2015
8

Container Corporation
Corporate profile: Container Corporation
Company description
Container Corp of India Ltd (CCRI) is a leading rail
freight transporter that is graduating to be a
multimodal logistic player. It is set to benefit from
GDP/EXIM revival and DFCs completion that will
accelerate containerization. Despite private players
entry in 2006, it has a leading market share (76%)
that can be attributed to its scale and vantage
locations. Long term growth acceleration could
come from its pre-emptive capex on multimodal
parks.
Exhibit 15: Sensex rebased
Exhibit 16: Shareholding pattern (%)
Jun-15
Promoter
DII
FII
Others
61.8
5.0
29.8
3.4
Mar-15
61.8
6.9
26.3
5.0
Jun-14
61.8
6.4
26.5
5.3
Exhibit 17: Top holders
Holder Name
Aberdeen Global Indian Equity Mauritius Ltd
Matthews Pacific Tiger Fund
Government of Singapore Investment -Corporation
LIC of India Profit Plus Growth Fund
T Rowe Price Emerging Markets Stock Fund
% Holding
3.5
2.8
2.0
1.4
1.1
Note: FII Includes depository receipts
Exhibit 18: Top management
Name
Anil Kumar Gupta
Designation
Chairman & Managing Director
Exhibit 19: Directors
Name
Anil Kumar Gupta
Arvind Bhatnagar
Manoj K Akhouri
P Alli Rani
M P Shorawala*
Name
Sudhir Mathur*
Pradeep Bhatnagar*
V Kalyana Rama
N Madhusudana Rao
Yash Vardhan
*Independent
Exhibit 20: Auditors
Name
Kumar Vijay Gupta & Co
Type
Statutory
Exhibit 21: MOSL forecast v/s consensus
EPS
(INR)
FY16
FY17
FY18
MOSL
forecast
48.0
58.1
70.1
Consensus
forecast
56.1
65.6
71.0
Variation
(%)
-14.4
-11.4
-1.2
21 October 2015
9

This document has been prepared by Motilal Oswal Securities Limited (hereinafter referred to as Most) to provide information about the company(ies) and/sector(s), if any, covered in the report and may be distributed
Container Corporation
by it and/or its affiliated company(ies). This report is for personal information of the selected recipient/s and does not construe to be any investment, legal or taxation advice to you. This research report does not
constitute an offer, invitation or inducement to invest in securities or other investments and Motilal Oswal Securities Limited (hereinafter referred as MOSt) is not soliciting any action based upon it. This report is not for
public distribution and has been furnished to you solely for your general information and should not be reproduced or redistributed to any other person in any form. This report does not constitute a personal
recommendation or take into account the particular investment objectives, financial situations, or needs of individual clients. Before acting on any advice or recommendation in this material, investors should consider
whether it is suitable for their particular circumstances and, if necessary, seek professional advice. The price and value of the investments referred to in this material and the income from them may go down as well as
up, and investors may realize losses on any investments. Past performance is not a guide for future performance, future returns are not guaranteed and a loss of original capital may occur.
MOSt and its affiliates are a full-service, integrated investment banking, investment management, brokerage and financing group. We and our affiliates have investment banking and other business relationships with a
some companies covered by our Research Department. Our research professionals may provide input into our investment banking and other business selection processes. Investors should assume that MOSt and/or
its affiliates are seeking or will seek investment banking or other business from the company or companies that are the subject of this material and that the research professionals who were involved in preparing this
material may educate investors on investments in such business. The research professionals responsible for the preparation of this document may interact with trading desk personnel, sales personnel and other
parties for the purpose of gathering, applying and interpreting information. Our research professionals are paid on the profitability of MOSt which may include earnings from investment banking and other business.
MOSt generally prohibits its analysts, persons reporting to analysts, and members of their households from maintaining a financial interest in the securities or derivatives of any companies that the analysts cover.
Additionally, MOSt generally prohibits its analysts and persons reporting to analysts from serving as an officer, director, or advisory board member of any companies that the analysts cover. Our salespeople, traders,
and other professionals or affiliates may provide oral or written market commentary or trading strategies to our clients that reflect opinions that are contrary to the opinions expressed herein, and our proprietary
trading and investing businesses may make investment decisions that are inconsistent with the recommendations expressed herein. In reviewing these materials, you should be aware that any or all of the foregoing
among other things, may give rise to real or potential conflicts of interest. MOSt and its affiliated company(ies), their directors and employees and their relatives may; (a) from time to time, have a long or short position
in, act as principal in, and buy or sell the securities or derivatives thereof of companies mentioned herein. (b) be engaged in any other transaction involving such securities and earn brokerage or other compensation
or act as a market maker in the financial instruments of the company(ies) discussed herein or act as an advisor or lender/borrower to such company(ies) or may have any other potential conflict of interests with
respect to any recommendation and other related information and opinions.; however the same shall have no bearing whatsoever on the specific recommendations made by the analyst(s), as the recommendations
made by the analyst(s) are completely independent of the views of the affiliates of MOSt even though there might exist an inherent conflict of interest in some of the stocks mentioned in the research report
Reports based on technical and derivative analysis center on studying charts company's price movement, outstanding positions and trading volume, as opposed to focusing on a company's fundamentals and, as
such, may not match with a report on a company's fundamental analysis. In addition MOST has different business segments / Divisions with independent research separated by Chinese walls catering to different set
of customers having various objectives, risk profiles, investment horizon, etc, and therefore may at times have different contrary views on stocks sectors and markets.
Unauthorized disclosure, use, dissemination or copying (either whole or partial) of this information, is prohibited. The person accessing this information specifically agrees to exempt MOSt or any of its affiliates or
employees from, any and all responsibility/liability arising from such misuse and agrees not to hold MOSt or any of its affiliates or employees responsible for any such misuse and further agrees to hold MOSt or any of
its affiliates or employees free and harmless from all losses, costs, damages, expenses that may be suffered by the person accessing this information due to any errors and delays. The information contained herein is
based on publicly available data or other sources believed to be reliable. Any statements contained in this report attributed to a third party represent MOSt’s interpretation of the data, information and/or opinions
provided by that third party either publicly or through a subscription service, and such use and interpretation have not been reviewed by the third party. This Report is not intended to be a complete statement or
summary of the securities, markets or developments referred to in the document. While we would endeavor to update the information herein on reasonable basis, MOSt and/or its affiliates are under no obligation to
update the information. Also there may be regulatory, compliance, or other reasons that may prevent MOSt and/or its affiliates from doing so. MOSt or any of its affiliates or employees shall not be in any way
responsible and liable for any loss or damage that may arise to any person from any inadvertent error in the information contained in this report. MOSt or any of its affiliates or employees do not provide, at any time,
any express or implied warranty of any kind, regarding any matter pertaining to this report, including without limitation the implied warranties of merchantability, fitness for a particular purpose, and non-infringement.
The recipients of this report should rely on their own investigations.
This report is intended for distribution to institutional investors. Recipients who are not institutional investors should seek advice of their independent financial advisor prior to taking any investment decision based on
this report or for any necessary explanation of its contents.
Most and it’s associates may have managed or co-managed public offering of securities, may have received compensation for investment banking or merchant banking or brokerage services, may have received any
compensation for products or services other than investment banking or merchant banking or brokerage services from the subject company in the past 12 months.
Most and it’s associates have not received any compensation or other benefits from the subject company or third party in connection with the research report.
Subject Company may have been a client of Most or its associates during twelve months preceding the date of distribution of the research report
MOSt and/or its affiliates and/or employees may have interests/positions, financial or otherwise of over 1 % at the end of the month immediately preceding the date of publication of the research in the securities
mentioned in this report. To enhance transparency, MOSt has incorporated a Disclosure of Interest Statement in this document. This should, however, not be treated as endorsement of the views expressed in the
report.
Motilal Oswal Securities Limited is registered as a Research Analyst under SEBI (Research Analyst) Regulations, 2014. SEBI Reg. No. INH000000412
There are no material disciplinary action that been taken by any regulatory authority impacting equity research analysis activities
Analyst Certification
The views expressed in this research report accurately reflect the personal views of the analyst(s) about the subject securities or issues, and no part of the compensation of the research analyst(s) was, is, or will be
directly or indirectly related to the specific recommendations and views expressed by research analyst(s) in this report. The research analysts, strategists, or research associates principally responsible for preparation
of MOSt research receive compensation based upon various factors, including quality of research, investor client feedback, stock picking, competitive factors and firm revenues
Disclosure of Interest Statement
Analyst ownership of the stock
Served as an officer, director or employee
CONTAINER CORP OF INDIA
No
No
Disclosures
A graph of daily closing prices of securities is available at www.nseindia.com and http://economictimes.indiatimes.com/markets/stocks/stock-quotes
This report is not directed or intended for distribution to or use by any person or entity resident in a state, country or any jurisdiction, where such distribution, publication, availability or use would be contrary to law,
regulation or which would subject MOSt & its group companies to registration or licensing requirements within such jurisdictions.
Motilal Oswal Securities Limited (MOSL) is not a registered broker - dealer under the U.S. Securities Exchange Act of 1934, as amended (the"1934 act") and under applicable state laws in the United States. In
addition MOSL is not a registered investment adviser under the U.S. Investment Advisers Act of 1940, as amended (the "Advisers Act" and together with the 1934 Act, the "Acts), and under applicable state laws in the
United States. Accordingly, in the absence of specific exemption under the Acts, any brokerage and investment services provided by MOSL, including the products and services described herein are not available to or
intended for U.S. persons.
This report is intended for distribution only to "Major Institutional Investors" as defined by Rule 15a-6(b)(4) of the Exchange Act and interpretations thereof by SEC (henceforth referred to as "major institutional
investors"). This document must not be acted on or relied on by persons who are not major institutional investors. Any investment or investment activity to which this document relates is only available to major
institutional investors and will be engaged in only with major institutional investors. In reliance on the exemption from registration provided by Rule 15a-6 of the U.S. Securities Exchange Act of 1934, as amended (the
"Exchange Act") and interpretations thereof by the U.S. Securities and Exchange Commission ("SEC") in order to conduct business with Institutional Investors based in the U.S., MOSL has entered into a chaperoning
agreement with a U.S. registered broker-dealer, Motilal Oswal Securities International Private Limited. ("MOSIPL"). Any business interaction pursuant to this report will have to be executed within the provisions of this
chaperoning agreement.
The Research Analysts contributing to the report may not be registered /qualified as research analyst with FINRA. Such research analyst may not be associated persons of the U.S. registered broker-dealer, MOSIPL,
and therefore, may not be subject to NASD rule 2711 and NYSE Rule 472 restrictions on communication with a subject company, public appearances and trading securities held by a research analyst account.
Regional Disclosures (outside India)
For U.S.
For Singapore
Motilal Oswal Capital Markets Singapore Pte Limited is acting as an exempt financial advisor under section 23(1)(f) of the Financial Advisers Act(FAA) read with regulation 17(1)(d) of the Financial Advisors
Regulations and is a subsidiary of Motilal Oswal Securities Limited in India. This research is distributed in Singapore by Motilal Oswal Capital Markets Singapore Pte Limited and it is only directed in Singapore to
accredited investors, as defined in the Financial Advisers Regulations and the Securities and Futures Act (Chapter 289), as amended from time to time.
In respect of any matter arising from or in connection with the research you could contact the following representatives of Motilal Oswal Capital Markets Singapore Pte Limited:
Kadambari Balachandran
Email : kadambari.balachandran@motilaloswal.com
Contact : (+65) 68189233 / 65249115
Office Address : 21 (Suite 31),16 Collyer Quay,Singapore 04931
Motilal Oswal Securities Ltd
21 October 2015
Motilal Oswal Tower, Level 9, Sayani Road, Prabhadevi, Mumbai 400 025
Phone: +91 22 3982 5500 E-mail: reports@motilaloswal.com
10