23 October 2015
2QFY16 Results Update | Sector: Automobiles
Bajaj Auto
BSE SENSEX
27,288
Bloomberg
Equity Shares (m)
M.Cap. (INR b)/(USD b)
52-Week Range (INR)
1, 6, 12 Rel. Per (%)
Avg Val/Vol ‘000
Free float (%)
Financials & Valuation (INR b)
Y/E March
Sales
EBITDA
NP
EPS Gr. (%)
BV/Sh. (INR)
RoE (%)
RoCE (%)
P/E (x)
P/BV (x)
2015
216.1
41.2
30.5
(6.0)
369.5
30.0
42.7
23.9
6.8
2016E 2017E
241.2
50.9
38.0
131.3
24.7
422.7
33.2
47.6
19.2
6.0
277.5
59.1
48.2
166.6
26.9
499.2
36.1
48.3
15.1
5.0
S&P CNX
8,252
BJAUT IN
289.4
728.7/11.2
2690 / 1914
6/28/2
984
50.7
CMP: INR 2,518
TP: INR 3,118 (+24%)
Buy
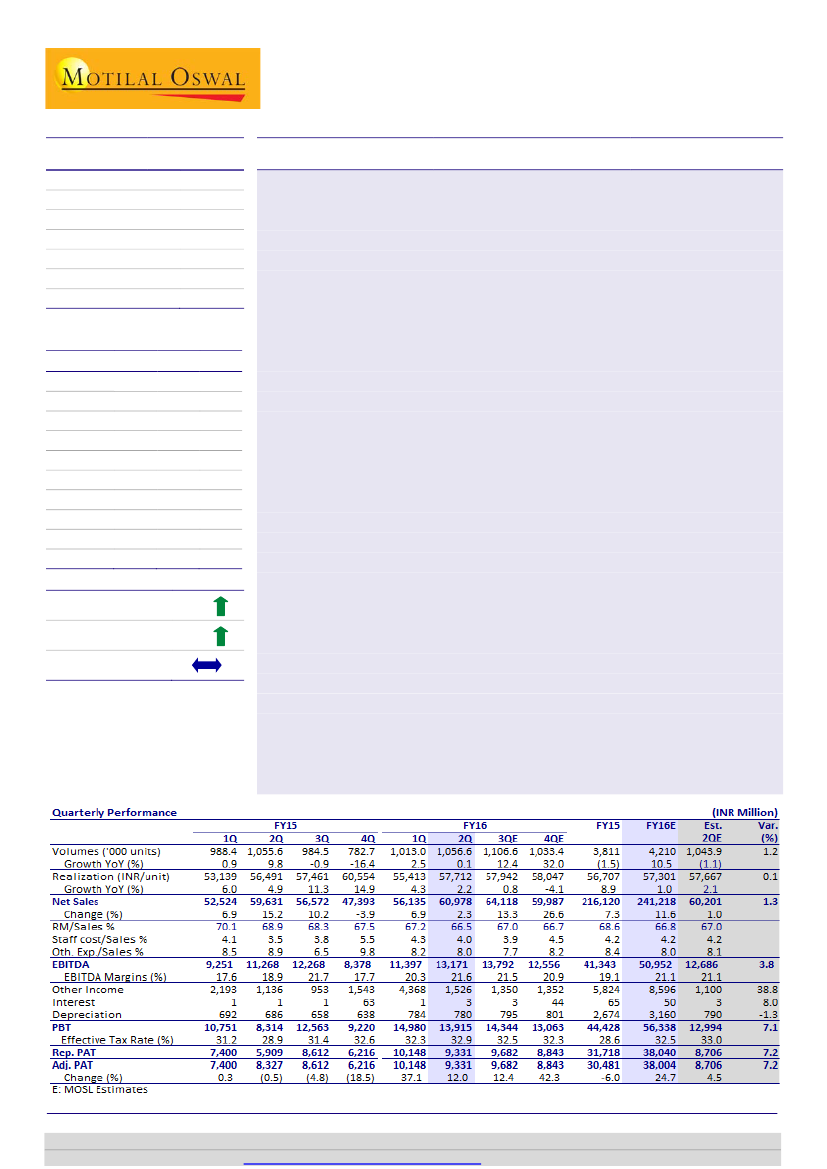
Above estimate; gross margins at 33.5%—highest since 2QFY10
Bajaj Auto’s (BJAUT) 2QFY16 numbers were above estimate—EBITDA of ~INR13.2b
(est. of ~INR12.7b) and PAT at ~INR9.3b (est. of ~INR8.7b). We believe BJAUT’s
volume recovery is on track in domestic (new product led) and export markets
(demand normalization in key markets); this—coupled with favorable Fx, new
product launches and operating leverage—would drive ~26% EPS CAGR (FY15-17).
Better mix and favorable forex drive realization:
Net sales grew ~2% YoY (8.6%
QoQ) to INR61b (est. of INR60.2b) on the back of improved mix (higher 3Ws and
premium motorcycles) and higher USD realization at INR65.2 (v/s INR63.9 in
1QFY16). Also, the company has undertaken price increase in the domestic
market (ex-CT100) to the tune of INR500-2,000 for motorcycles and up to
INR2,000 for domestic 3Ws, effective September 1, 2015.
EBITDA margins up due to forex benefit and positive operating leverage:
Gross
margins improved ~70bp QoQ, driven by favorable Fx (~70bp QoQ benefit).
EBITDA margins improved 270bp YoY (+130bp QoQ) to 21.6% (v/s est. of
~21.1%), driven by favorable forex and operating leverage benefit (~50bp QoQ).
Higher other income of INR1.5b (v/s est. of INR1.1b) drove PAT to INR9.3b (v/s
est. of INR8.7b).
Management commentary:
a) Ganpati and Navratri festive retails on like-to-like
basis were down 7-8% for the motorcycle industry, impacted by weak rural
demand; b) post the launch the of the new Avenger range, the company expects to
sell 12k units per month by Feb-16 (v/s 3.5k/month currently); c) domestic
motorcycle exit market share target of 21% (v/s the current ~18%); d) ~150k
permits have been opened up in Maharashtra, but benefit to come from 4QFY16; e)
part benefit of forex passed on in the export market w.e.f October 1, 2015; f)
doesn’t expect any further benefit from commodity prices.
Valuation and view:
We raise our EPS estimates for FY16/17 by 3%/2% to factor in
for higher EBITDA margins due to better forex realization and higher other income.
The stock trades at 19.2x/15.1x FY16E/FY17E EPS. We value BJAUT at INR3,118 (18x
FY17E EPS and add INR119/share for its KTM stake post 20% HoldCo discount).
Maintain
Buy.
Adj.EPS(INR) 105.3
Estimate change
TP change
Rating change
2-3%
2-3%
Jinesh Gandhi
(Jinesh@MotilalOswal.com); +91 22 3982 5416
Jay Shah
(Jay.Shah@MotilalOswal.com); +91 22 3078 4701
Investors are advised to refer through disclosures made at the end of the Research Report.
Motilal Oswal research is available on
www.motilaloswal.com/Institutional-Equities,
Bloomberg, Thomson Reuters, Factset and S&P Capital.

Bajaj Auto
Realizations were up 2.16% QoQ due to improved domestic mix (3Ws) and
USD realization of INR65.2 in exports:
Volumes were flat YoY (+4.3% QoQ) to 1,057k units, on back of
Domestic volumes for motorcycle was up by 2% YoY (-3.5% QoQ) to 469k units.
Domestic volumes for 3Ws de-grew by ~10% YoY (+32% QoQ) to 67k units.
Motorcycle exports were flat YoY (+11.4% QoQ) and 3Ws exports grew by 6%
YoY (flat QoQ).
Domestic motorcycle market share remained flat QoQ at 17.7% (+140bp YoY).
Net sales grew ~2% YoY (8.6% QoQ) to INR61b (est. of INR60.2b) on the back of
improved mix in domestic market (3Ws) and higher USD realization at INR65.2
(v/s INR63.9 in 1QFY16).
Also, company has took price increase in domestic market (ex-CT100) in range of
INR500-2000 for motorcycles and up to 2k for domestic 3Ws effective 1St
September 2015.
Exhibit 1: Trend in product mix (INR m)
2QFY16
Motorcycles
Domestic
% of total domestic
Exports
% of total exports
Total Motorcycles
% of total
Three Wheelers
Domestic
% of total domestic
Exports
% of total exports
Total 3Ws
% of total volumes
Total Volumes
469,330
87.5
433,767
83.4
903,097
85.5
67,117
12.5
86,382
16.6
153,499
14.5
1,056,596
2QFY15
461,651
86.1
437,502
84.3
899,153
85.2
74,838
13.9
81,591
15.7
156,429
14.8
1,055,582
YoY (%)
1.7
-0.9
0.4
1QFY16
486,427
90.6
389,417
81.7
875,844
86.5
50,715
9.4
87,079
18.3
137,794
13.6
1,013,029
QoQ (%)
-3.5
11.4
3.1
FY15
1,771,185
88.3
1,521,306
84.2
3,292,491
86.4
234,345
11.7
284,772
15.8
519,117
13.6
3,811,608
FY14
2,099,230
91.8
1,323,173
83.5
3,422,403
88.4
YoY (%)
-15.6
15.0
-3.8
-10.3
5.9
-1.9
0.1
32.3
-0.8
11.4
4.3
186,912
25.4
8.2
260,762
9.2
16.5
447,674
16.0
11.6
3,870,077
-1.5
Source: Company, MOSL
Exhibit 2: Trend in market share
(%)
Segment Wise
- Economy
- Executive
- Executive 100
- Executive 125
- Premium
- Premium excl RE
Dom. Motorcycles
Total Motorcycles
Total Dom. 2W
Total 2W (incl exports)
Dom. 3W
3W (incl exports)
2QFY16
37.3
4.2
14.9
10.5
35.1
46.7
17.7
27.4
11.1
18.6
47.7
57.8
2QFY15
21.4
9.2
7.0
14.3
35.9
43.0
16.4
26.1
11.0
18.4
46.5
57.2
YoY (bp)
1,590
-500
790
-390
-70
360
140
130
10
10
120
70
1QFY16
40.3
4.0
18.8
5.1
34.8
44.8
17.9
26.7
12.0
19.0
44.9
58.5
QoQ (bp)
-300
30
-390
540
40
190
-20
70
-90
-40
280
-70
FY15
24.9
8.2
7.4
12.4
35.8
43.5
16.5
25.4
11.1
17.9
44.1
55.3
FY14
YoY (%)
24.2
1,600
14.3
-1,030
14.5
430
13.7
-870
38.8
-410
44.7
10
20.4
-250
28.0
-140
14.6
-260
22.1
-310
51.2
-640
71.4
-1,290
Source: Company, MOSL
23 October 2015
2

Bajaj Auto
Exhibit 3: Sequential improvement
favorable mix (INR ‘000/unit)
Export Realizations
in
realizations
on
Exhibit 4: Domestic motorcycle market share to revive with
launch of new Pulsar’s and upcoming Avenger’s
Domestic Motorcycle
Total Motorcycle
33
33 34 32
32
31 31
29 28 27 28 26 26 26
48
Domestic Realizations
62
61
60 60
55
55
53 53
50 49 51 49 54
23
27 27
52 53 50 52 51 53 55 59 55 55
41 43 46 44
25 27 25 25 24 26 26
23 23
13
20
19 20 18
16 17 15 18 18
1Q 2Q 3Q 4Q 1Q 2Q 3Q 4Q 1Q 2Q 3Q 4Q 1Q 2Q
FY13
FY14
FY15
FY16
1Q 2Q 3Q 4Q 1Q 2Q 3Q 4Q 1Q 2Q 3Q 4Q 1Q 2Q 3Q 4Q 1Q 2Q
FY12
FY13
FY14
FY15
FY16
Source: Company, MOSL
Exhibit 5:
Domestic product mix improved in favor of premium segment
Economy
Premium <200
5
6
34
16
37
23
26
19
40
21
23
10
Executive 100
Premium >200
6
8
30
12
21
31
31
17
19
25
Executive 125
Premium >300
6
10
33
9
12
36
29
5
8
52
4
22
14
5
26
12
32
24
9
31
16
18
26
9
32
10
3
46
1QFY14 2QFY14 3QFY14 4QFY14 1QFY15 2QFY15 3QFY15 4QFY15 1QFY16 2QFY16
Source: Company, MOSL
EBITDA margins were up due to forex benefit and positive operating
leverage:
Gross margins improved ~70bp QoQ, driven by favorable Fx (~70bp QoQ
benefit) and commodity prices. Highest ever Gross margins since 2QFY10.
EBITDA margin improved 270bp YoY (+130bp QoQ) to 21.6% (v/s est. of
~21.1%), driven by operating leverage benefit of ~50bp QoQ and forex benefit.
Higher other income of INR1.5b (v/s est. of INR1.1b) drove PAT to INR9.3b (v/s
est. of INR8.7b).
Exhibit 6: EBITDA margins up by 130bp QoQ
EBITDA (INR/Unit)
EBITDA Margins (%)
21.9 22.1
18.9
17.6
18.9
21.7
20.3
17.9
18.4 18.7
17.6
18.5
17.7
21.6
17.8
18.8
19.7 19.8
1Q 2Q 3Q 4Q 1Q 2Q 3Q 4Q 1Q 2Q 3Q 4Q 1Q 2Q 3Q 4Q 1Q 2Q
FY12
FY13
FY14
FY15
FY16
Source: Company, MOSL
23 October 2015
3

Bajaj Auto
Key takeaways from Earnings call
3W Guidance for FY16:
265k-270k in domestic and Exports of 325k. ~150k
permits has been opened up in Maharashtra, but benefit to come from 4QFY16.
Retails during Ganpati and Navratris were down 7-8% for motorcycle industry,
impacted by weakness in rural market.
Nigeria is flat YoY, but other African markets are growing. Africa currently at 70k
units (Nigeria at 40k units v/s 45k units last year). Incremental contribution
coming from new markets seeded last year at 7-8k units per month.
New Avengers:
Avengers currently doing 3,500 units/month. Post launch of new
Avengers, company expects to do 12,000 units/month by Feb-16. Two new
Avengers to be launched in October 2015 and one more a month later.
Domestic Motorcycle exit market share target of 21% (v/s current ~18%)
Price increase of INR500-2,000 for 2W (ex CT100) and INR2,000 for 3W effective
1st September 2015.
Exports:
Part of Forex benefit passed on effective 1st October 2015.
Commodity price benefit was marginal in 2QFY16 and no further benefits
expected in 3QFY16.
Domestic motorcycle inventory at ~30 days is lowest in the industry.
Fx hedging for FY17 started with base rate of INR66/USD through range
forwards.
Estimates Capex of INR3b-4b pa, towards de-bottlenecking, Maintenance capex,
R&D etc.
Post adoption of Indian AS from FY17, hedging MTM for future hedges would be
routed through Balance Sheet. Similarly, FMP income would also be accounted
on accrual basis.
Valuation view
Urban recovery to drive revival in premium segment, BJAUT to be key beneficiary:
With the expectation of economic recovery, premium segment is expected to
rebound strongly. Initial signs of recovery are visible, as per our industry interaction.
BJAUT will be the key beneficiary given its leadership with 36% share coupled with
several launches in FY16-17.
New launches in economy and premium segment to fortify its area of strength:
BJAUT is in midst of several launches in area of its strength in both economy
segment and premium segment. Its recent launches of CT100 and Pulsar
RS200/AS200/AS150 received strong responses. Further it plans to launch variants
of Pulsar, updated Avenger and a new brand in leisure segment, thereby straddling
entire premium segment and having widest product offering in the premium
segment.
Exports offer huge potential, but might not be linear growth:
In its key markets,
2W penetration is very low (for eg ~1.7% in Africa, 4.2% in LatAm etc), thereby
offering huge growth potential. Further, in most of these markets it has room to
grow market share from Chinese players. While long term growth potential remains
intact, there could be short term volatility in volumes.
Re-Rating to be driven by robust ~26% EPS CAGR:
Recovery in industry demand,
especially in premium segment would drive market share gains for BJAUT. Further,
normalization of export volumes in key markets of Nigeria, Sri Lanka and Egypt
23 October 2015
4

Bajaj Auto
would drive volume recovery. This coupled with favorable Fx, new product launches
and operating leverage would drive 26% EPS CAGR over FY15-17E.
Maintain Buy with TP of ~INR3,118:
We raise our EPS estimates for FY16/17 by
3%/2% respectively to factor in for higher EBITDA margin due to better Forex
realization and higher other income. The stock trades at 19.2x/15.1x FY16/FY17E
EPS. We value BJAUT at INR3,118 (18x FY17E EPS and add INR119/share for its KTM
stake post 20% HoldCo discount). Maintain Buy.
Exhibit 7:
Revised forecast (INR m)
Rev
4,209,645
241,218
50,915
21.1
38,004
131.3
FY16E
Old
4,201,261
240,233
49,873
20.8
37,016
127.9
Chg (%)
0.2
0.4
2.1
30bp
2.7
2.7
Rev
4,731,479
277,466
59,076
21.3
48,216
166.6
FY17E
Old
Chg (%)
4,702,061
0.6
275,311
0.8
57,737
2.3
21.0
30bp
47,144
2.3
162.9
2.3
Source: Company, MOSL
Volumes (units)
Net Sales
EBITDA
EBITDA Margins (%)
Net Profit
EPS (INR)
Exhibit 8: BJAUT P/E trading above long term average
implying improving fundamentals
27
22
17
12
7
2
14.1
P/E (x)
7 Yrs Avg(x)
16.7
5 Yrs Avg(x)
Exhibit 9: BBJAUT’s P/BV at historical average
9.1
P/B (x)
5 Yrs Avg(x)
5.9
5.5
5.3
7 Yrs Avg(x)
16.4
7.2
5.3
3.4
1.5
Source: Company, MOSL
Exhibit 10: Comparative Valuation
Auto OEM's
Bajaj Auto
Hero MotoCorp
TVS Motor
M&M
Maruti Suzuki
Tata Motors
Ashok Leyland
Eicher Motors#
Auto Ancillaries
Bharat Forge
Exide Industries
Amara Raja
BOSCH
CMP * Rating
(INR)
2,518 Buy
2,619 Buy
252 Buy
1,258 Neutral
4,473 Buy
381 Buy
96 Buy
18,199 Buy
927
161
1,011
21,754
Buy
Buy
Buy
Buy
TP
(INR)
3,113
2,862
280
1,129
5,109
491
110
24,283
1,252
180
1,139
26,864
P/E (x)
FY16E
FY17E
19.2
15.1
16.6
14.6
27.4
15.8
19.6
15.8
26.3
18.6
8.8
7.1
24.2
12.4
51.1
29.0
24.3
21.9
33.0
48.5
18.5
17.9
22.2
35.4
EV/EBITDA (x)
FY16E
FY17E
11.9
9.8
10.6
9.5
16.6
10.4
14.8
13.0
12.9
10.1
3.8
3.0
11.7
7.0
28.0
16.7
13.0
12.8
18.7
32.2
10.6
10.4
13.7
23.8
RoE (%)
FY16E
FY17E
33.2
36.1
43.3
40.5
24.3
33.6
16.0
15.9
18.3
22.0
21.9
21.0
20.2
31.8
34.7
44.6
RoCE (%)
FY16E
FY17E
47.6
48.3
60.4
55.3
22.9
32.5
17.7
17.8
25.5
29.2
18.1
18.4
21.3
32.8
36.8
51.9
23.6
25.9
24.6
28.0
14.0
15.2
19.3
20.7
27.6
32.8
38.3
43.0
17.8
21.1
26.4
29.8
# Nos. are on CY basis Source: Company, MOSL
23 October 2015
5

Bajaj Auto
Exhibit 11:
Key operating metrics
000 units
Motorcycles (units)
Domestic
Growth (%)
% of total volumes
Exports
Growth (%)
% of total volumes
Total M/Cycles
Growth (%)
% of total volumes
3Ws
Domestic
Growth (%)
% of total volumes
Exports
Growth (%)
% of total volumes
3Ws
Growth (%)
% of total volumes
Total Volumes
Growth (%)
Avg. Net Realn (INR/unit)
Growth (%)
Net Revenues (INR B)
Growth (%)
EBITDA (INR B)
EBITDA margins (%)
EBITDA (INR/Unit)
Growth (%)
PAT
EPS (INR)
FY10
1,782
39.6
62.5
725
14.8
25.4
2,507
31.4
87.9
176
30.0
6.2
165
18.6
5.8
341
24.2
12.0
2,853
30.0
39,544
4.3
115
36.4
26
21.7
9,088.5
117.5
18
63
FY11
2,415
35.5
63.1
972
34.1
25.4
3,387
35.1
88.6
206
16.8
5.4
231
40.3
6.0
437
28.1
11.4
3,824
34.1
41,013
3.7
159
38.1
32
19.3
8,292.6
22.3
26
90
FY12
2,567
6.3
59.0
1,268
30.4
29.1
3,834
13.2
88.2
203
-1.3
4.7
312
35.0
7.2
515
17.9
11.8
4,350
13.7
42,366
3.3
189
18.8
37
19.0
8,552.6
17.3
31
107
FY13
2,464
-4.0
58.1
1,293
2.0
30.5
3,757
-2.0
88.7
226
11.4
5.3
254
-18.7
6.0
480
-6.8
11.3
4,237
-2.6
44,665
5.4
195
3.2
36
18.2
8,579.5
-2.3
30
105
FY14
2,099
-14.8
54.2
1,323
2.3
34.2
3,422
-8.9
88.4
187
-17.3
4.8
261
2.7
6.7
448
-6.7
11.6
3,870
-8.7
48,443
8.5
197
1.2
41
20.4
10,608.9
12.9
32
112
FY15
1,771
-15.6
46.5
1,521
15.0
39.9
3,292
-3.8
86.4
234
25.4
6.1
285
9.2
7.5
519
16.0
13.6
3,811
-1.5
51,853
7.0
211
7.0
41
19.0
10,801.2
0.3
30
105
FY16E
1,961
10.7
46.6
1,666
9.5
39.6
3,627
10.2
86.2
FY17E
2,263
15.4
47.8
1,832
10.0
38.7
4,096
12.9
86.6
262
283
12.0
8.0
6.2
6.0
320
352
12.5
10.0
7.6
7.4
583
636
12.3
9.1
13.8
13.4
4,210
4,731
10.5
12.4
53,269
54,712
2.7
2.7
238
274
12.6
15.2
51
59
21.1
21.3
12,094.9
12,485.8
23.7
16.0
38
48
131
167
Source: Company, MOSL
23 October 2015
6

Bajaj Auto
Story in charts: Domestic recovery, export momentum key drivers
Exhibit 12: Exports & 3Ws to drive volume growth
13.7
Volumes ('000 Units)
Growth (%)
10.5
12.4
Exhibit 13: Share of exports motorcycles to increase
2W - Dom
7.2
4.7
29.1
6.0
5.3
30.5
2W - Exports
6.7
4.8
34.2
3W - Dom
7.5
6.1
39.9
3W - Exports
7.6
6.2
39.6
7.4
6.0
38.7
(1.5)
(2.6)
(8.7)
FY12
FY13
FY14
FY15E
FY16E
FY17E
FY12
FY13
FY14
59.0
58.1
54.2
46.5
FY15E
46.6
FY16E
47.8
FY17E
Source: Company, MOSL
Exhibit 14: Volume mix to remain stable as CT-100 to make-
up for Discover loss
3Ws (Exports)
Others (Dom)
CT100 (Dom)
10
33
20
25
5
6
FY11
12
30
16
29
5
7
FY12
11
31
15
31
5
6
FY13
3Ws (Dom)
Pulsar (Dom)
Platina (Dom)
12
25
16
34
5
7
FY14
13
1
15
17
40
6
7
FY15
2W Exports
Discover (Dom)
7
14
6
17
40
6
8
FY16E
7
13
7
18
39
6
7
FY17E
Exhibit 15: EBITDA margins to remain healthy
EBITDA (INR m)
20.4
19.0
18.2
19.0
EBITDA Margins (%)
21.1
21.3
FY12
FY13
FY14
FY15E
FY16E
FY17E
Source: Company, MOSL
Exhibit 16: Return ratios to remain stable, due to
accumulation of cash
73.0
56.7 59.8
43.7
RoCE (%)
51.8
37.0
42.7
30.0
RoE (%)
Exhibit 17: Dividend payout to remain healthy
Dividend Payout (%)
Dividend Yield (%)
3.0
2.6
48.3
1.8
48.7
1.8
49.7
2.0
52.2
2.0
56.9
59.5
54.1
47.6
33.2
36.1
FY12
FY13
FY14
FY15E
FY16E
FY17E
FY12
FY13
FY14
FY15E
FY16E
FY17E
Source: Company, MOSL
23 October 2015
7

Bajaj Auto
Financials and valuations
Income Statement
Y/E March
Volumes
Change (%)
Net Sales
Change (%)
Total Expenditure
EBITDA
Change (%)
EBITDA Margins (%)
Depreciation
EBIT
Int. & Fin. Charges
Other Income
PBT
Effective Rate (%)
Adj. PAT
Change (%)
2010
2011
2012
2013
2014
2015
(INR Million)
2016E
2017E
4,731,479
12.4
277,466
15.0
218,390
59,076
16.0
21.3
3,388
55,688
50
11,329
66,967
28.0
48,216
26.9
2,852,579 3,823,954 4,349,560 4,237,151 3,870,077 3,811,201 4,209,645
30.0
34.1
13.7
-2.6
-8.7
-1.5
10.5
119,210
163,981
195,290
199,973
201,495
216,120
241,218
35.3
37.6
19.1
2.4
0.8
7.3
11.6
93,284
132,270
158,090
163,620
160,438
174,955
190,302
25,926
31,711
37,200
36,353
41,057
41,166
50,915
117.5
22.3
17.3
-2.3
12.9
0.3
23.7
21.7
19.3
19.0
18.2
20.4
19.0
21.1
1,365
1,228
1,456
1,640
1,796
2,674
3,160
24,561
30,482
35,744
34,713
39,261
38,492
47,756
60
17
222
5
5
65
50
1,225
5,765
6,080
7,955
7,064
5,824
8,596
24,102
43,476
40,262
42,662
46,321
40,848
56,302
29.4
23.2
25.4
28.7
30.0
31.1
32.5
18,175
26,150
31,069
30,436
32,420
30,481
38,004
128.3
43.9
18.8
(2.0)
6.5
(6.0)
24.7
Balance Sheet
Y/E March
Share Capital
Net Worth
Deferred Tax
Loans
Capital Employed
Gross Fixed Assets
Less: Depreciation
Net Fixed Assets
Capital WIP
Investments
Current Assets
Inventory
Sundry Debtors
Cash & Bank Balances
Loans & Advances
Others
Current Liab. & Prov.
Sundry Creditors
Other Liabilities
Provisions
Net Current Assets
Application of Funds
E: MOSL Estimates
2010
1,447
29,324
17
13,386
42,727
33,793
18,997
14,796
415
40,215
15,838
4,462
2,395
1,014
6,574
1,394
28,579
15,712
4,551
8,316
-12,740
42,727
2011
2,894
49,102
297
3,252
52,651
33,952
19,125
14,827
699
47,952
28,726
5,473
3,628
5,565
11,896
2,164
39,553
19,431
4,836
15,286
-10,827
52,651
2012
2,894
60,411
484
975
61,870
33,961
19,143
14,817
417
48,828
46,749
6,785
4,228
16,538
16,227
2,970
48,941
20,031
7,161
21,749
-2,192
61,870
2013
2,894
79,020
1,151
713
80,883
38,289
20,244
18,044
2,936
64,305
39,502
6,363
7,676
5,589
17,741
2,133
43,903
19,796
6,682
17,425
-4,401
80,883
2014
2,894
96,080
1,432
577
98,089
40,770
20,710
20,060
1,441
85,496
40,479
6,397
7,962
4,955
16,984
4,181
49,387
21,114
8,536
19,737
-8,908
98,089
2015
2,894
106,922
1,416
1,118
109,455
41,009
21,837
19,172
2,549
91,533
42,368
8,142
7,170
5,862
17,727
3,469
46,168
17,998
8,251
19,920
-3,800
109,455
(INR Million)
2016E
2,894
122,317
3,668
1,118
127,102
45,559
24,996
20,562
1,000
91,533
72,078
8,344
8,080
33,055
19,122
3,477
58,071
24,337
8,344
25,390
14,007
127,102
2017E
2,894
144,446
5,007
1,118
150,571
48,559
28,385
20,174
1,000
91,533
104,822
9,617
9,312
61,050
20,837
4,007
66,958
28,049
9,617
29,292
37,864
150,571
23 October 2015
8

Bajaj Auto
Financials and valuations
Ratios
Y/E March
Basic (INR)
EPS
EPS growth (%)
Cash EPS
Book Value per Share
DPS
Payout (Incl. Div. Tax) %
Valuation (x)
P/E
Cash P/E
EV/EBITDA
EV/Sales
Price to Book Value
Dividend Yield (%)
Profitability Ratios (%)
RoE
RoCE
RoIC
Turnover Ratios
Debtors (Days)
Inventory (Days)
Creditors (Days)
Working Capital (Days)
Fixed Asset Turnover
2010
62.8
128.3
67.5
101.3
20.0
37.1
40.1
37.3
13.0
2.8
12.4
0.8
78.7
68.4
116
7
13
46
-26
3.5
2011
90.4
43.9
94.6
169.7
40.0
51.4
27.9
26.6
21.4
4.1
14.8
1.6
66.7
76.0
239
8
12
41
-22
4.8
2012
107.4
18.8
112.4
208.8
45.0
48.7
23.5
22.4
17.9
3.4
12.1
1.8
56.7
73.0
334
8
12
36
-16
5.8
2013
105.2
-2.0
110.8
273.1
45.0
49.7
23.9
22.7
18.1
3.3
9.2
1.8
43.7
59.8
159
13
11
34
-10
5.5
2014
112.0
6.5
118.2
332.0
50.0
52.2
22.5
21.3
15.6
3.2
7.6
2.0
37.0
51.8
126
14
11
36
-12
5.1
2015
105.3
-6.0
114.6
369.5
50.0
56.9
23.9
22.0
15.4
2.9
6.8
2.0
30.0
42.7
120
12
13
29
-4
5.3
2016E
131.3
24.7
142.3
422.7
65.0
59.5
19.2
17.7
11.9
2.5
6.0
2.6
33.2
47.6
157
12
12
35
-11
5.6
2017E
166.6
26.9
178.3
499.2
75.0
54.1
15.1
14.1
9.8
2.1
5.0
3.0
36.1
48.3
276
12
12
35
-11
5.9
Cash Flow Statement
Y/E March
OP/(Loss) before Tax
Interest/Div. Received
Depreciation & Amort.
Direct Taxes Paid
(Inc)/Dec in Working Capital
CF from Oper. Activity
Extra-ordinary Items
CF after EO Items
(Inc)/Dec in FA+CWIP
Free Cash Flow
(Pur)/Sale of Invest.
CF from Inv. Activity
Inc. / Dec.in Networth
Inc/(Dec) in Debt
Interest Paid
Dividends Paid
CF from Fin. Activity
Inc/(Dec) in Cash
Add: Beginning Bal.
Closing Balance
E: MOSL Estimates
2010
24,508
1,240
1,365
-6,999
8,679
28,792
-182
28,611
-1,906
26,887
-20,970
-22,876
0
-2,314
-60
-3,716
-6,090
-355
1,369
1,014
2011
32,867
3,631
1,228
-9,743
-8,215
19,768
19,768
-1,678
18,089
-8,184
-9,863
0
-1,866
-17
-6,737
-8,620
1,285.4
1,014
5,565
2012
38,829
3,261
1,456
-11,483
797
32,860
32,860
-1,159
31,701
-6,557
-7,716
0
-2,001
-222
-13,420
-15,644
9,501
5,565
16,539
2013
42,662
3,245
1,640
-12,394
-7,319
21,344
0
21,344
-5,285
16,059
-12,218
-17,503
0
324
-5
-15,109
-14,791
-10,950
16,538
5,589
2014
46,321
3,683
1,796
-13,153
4,176
35,457
0
35,457
-2,547
32,910
-18,862
-21,409
0
505
-5
-15,182
-14,682
-634
5,589
4,955
2015
40,848
1,845
2,674
-12,854
-7,350
21,473
-3,403
18,070
-2,933
18,540
-1,192
-4,125
0
532
-65
-16,909
-16,442
-2,496
4,955
5,862
2016E
47,756
8,596
3,160
-16,046
9,387
52,853
0
52,853
-3,000
49,853
0
-3,000
0
0
-50
-22,608
-22,658
27,194
5,862
33,056
(INR
Million)
2017E
55,688
11,329
3,388
-17,411
4,137
57,131
0
57,131
-3,000
54,131
0
-3,000
0
0
-50
-26,087
-26,137
27,995
33,055
61,050
23 October 2015
9

Bajaj Auto
Corporate profile
Company description
Bajaj Auto (BJAUT), the flagship of the Bajaj group,
is a leading manufacturer of two-wheelers (~88%
of volumes) and three-wheelers (~12% of volumes).
It is the market leader in three-wheelers, and is the
second largest player in motorcycles and enjoys
leadership in the premium segment. It is also the
largest exporter of two-wheelers and three-
wheelers (~41% of its volumes).
Exhibit 18: Sensex rebased
Exhibit 19: Shareholding pattern (%)
Jun-15
Promoter
DII
FII
Others
49.2
8.4
17.6
24.8
Mar-15
49.2
8.7
17.0
25.1
Jun-14
50.0
7.1
18.6
24.3
Exhibit 20: Top holders
Holder Name
Life Insurance Corporation Of India
Jaya Hind Investments Pvt Ltd
Maharashtra Scooters Ltd
Government Pension Fund Global
Sikkim Janswwa Pratisthan Pvt Ltd
% Holding
4.9
3.5
2.3
1.5
1.3
Note: FII Includes depository receipts
Exhibit 21: Top management
Name
Rajiv Bajaj
Pradeep Shrivastav
Abraham Joseph
R C Maheshwari
Rakesh Sharma
Eric Vas
Kevin P D'sa
Designation
Managing Director
COO
CTO
President (CV Business)
President (International Business)
President (Motorcycle Business)
CFO
Exhibit 22: Directors
Name
Rahul Bajaj
Madhur Bajaj
Rajiv Bajaj
S H Khan*
P Murari*
D S Mehta*
J N Godrej*
Nanoo Pamnani*
Name
D J Balaji Rao*
Naresh Chandra*
Suman Kirloskar*
Kantikumar R Podar*
Niraj Bajaj
Sanjiv Bajaj
Shekhar Bajaj
Manish Kejriwal
*Independent
Exhibit 23: Auditors
Name
Dalal & Shah
Shyamprasad D Limaye
Type
Statutory
Secretarial Audit
Exhibit 24: MOSL forecast v/s consensus
EPS (INR)
FY16
FY17
MOSL forecast
131.3
166.6
Consensus
forecast
131.5
148.0
Variation (%)
-0.2
12.6
23 October 2015
10

Bajaj Auto
NOTES
23 October 2015
11

Disclosures
This document has been prepared by Motilal Oswal Securities Limited (hereinafter referred to as Most) to provide information about the company(ies) and/sector(s), if any, covered in the report and may be distributed
Bajaj Auto
by it and/or its affiliated company(ies). This report is for personal information of the selected recipient/s and does not construe to be any investment, legal or taxation advice to you. This research report does not
constitute an offer, invitation or inducement to invest in securities or other investments and Motilal Oswal Securities Limited (hereinafter referred as MOSt) is not soliciting any action based upon it. This report is not for
public distribution and has been furnished to you solely for your general information and should not be reproduced or redistributed to any other person in any form. This report does not constitute a personal
recommendation or take into account the particular investment objectives, financial situations, or needs of individual clients. Before acting on any advice or recommendation in this material, investors should consider
whether it is suitable for their particular circumstances and, if necessary, seek professional advice. The price and value of the investments referred to in this material and the income from them may go down as well as
up, and investors may realize losses on any investments. Past performance is not a guide for future performance, future returns are not guaranteed and a loss of original capital may occur.
MOSt and its affiliates are a full-service, integrated investment banking, investment management, brokerage and financing group. We and our affiliates have investment banking and other business relationships with a
some companies covered by our Research Department. Our research professionals may provide input into our investment banking and other business selection processes. Investors should assume that MOSt and/or
its affiliates are seeking or will seek investment banking or other business from the company or companies that are the subject of this material and that the research professionals who were involved in preparing this
material may educate investors on investments in such business. The research professionals responsible for the preparation of this document may interact with trading desk personnel, sales personnel and other
parties for the purpose of gathering, applying and interpreting information. Our research professionals are paid on the profitability of MOSt which may include earnings from investment banking and other business.
MOSt generally prohibits its analysts, persons reporting to analysts, and members of their households from maintaining a financial interest in the securities or derivatives of any companies that the analysts cover.
Additionally, MOSt generally prohibits its analysts and persons reporting to analysts from serving as an officer, director, or advisory board member of any companies that the analysts cover. Our salespeople, traders,
and other professionals or affiliates may provide oral or written market commentary or trading strategies to our clients that reflect opinions that are contrary to the opinions expressed herein, and our proprietary
trading and investing businesses may make investment decisions that are inconsistent with the recommendations expressed herein. In reviewing these materials, you should be aware that any or all of the foregoing
among other things, may give rise to real or potential conflicts of interest. MOSt and its affiliated company(ies), their directors and employees and their relatives may; (a) from time to time, have a long or short position
in, act as principal in, and buy or sell the securities or derivatives thereof of companies mentioned herein. (b) be engaged in any other transaction involving such securities and earn brokerage or other compensation
or act as a market maker in the financial instruments of the company(ies) discussed herein or act as an advisor or lender/borrower to such company(ies) or may have any other potential conflict of interests with
respect to any recommendation and other related information and opinions.; however the same shall have no bearing whatsoever on the specific recommendations made by the analyst(s), as the recommendations
made by the analyst(s) are completely independent of the views of the affiliates of MOSt even though there might exist an inherent conflict of interest in some of the stocks mentioned in the research report
Reports based on technical and derivative analysis center on studying charts company's price movement, outstanding positions and trading volume, as opposed to focusing on a company's fundamentals and, as
such, may not match with a report on a company's fundamental analysis. In addition MOST has different business segments / Divisions with independent research separated by Chinese walls catering to different set
of customers having various objectives, risk profiles, investment horizon, etc, and therefore may at times have different contrary views on stocks sectors and markets.
Unauthorized disclosure, use, dissemination or copying (either whole or partial) of this information, is prohibited. The person accessing this information specifically agrees to exempt MOSt or any of its affiliates or
employees from, any and all responsibility/liability arising from such misuse and agrees not to hold MOSt or any of its affiliates or employees responsible for any such misuse and further agrees to hold MOSt or any of
its affiliates or employees free and harmless from all losses, costs, damages, expenses that may be suffered by the person accessing this information due to any errors and delays. The information contained herein is
based on publicly available data or other sources believed to be reliable. Any statements contained in this report attributed to a third party represent MOSt’s interpretation of the data, information and/or opinions
provided by that third party either publicly or through a subscription service, and such use and interpretation have not been reviewed by the third party. This Report is not intended to be a complete statement or
summary of the securities, markets or developments referred to in the document. While we would endeavor to update the information herein on reasonable basis, MOSt and/or its affiliates are under no obligation to
update the information. Also there may be regulatory, compliance, or other reasons that may prevent MOSt and/or its affiliates from doing so. MOSt or any of its affiliates or employees shall not be in any way
responsible and liable for any loss or damage that may arise to any person from any inadvertent error in the information contained in this report. MOSt or any of its affiliates or employees do not provide, at any time,
any express or implied warranty of any kind, regarding any matter pertaining to this report, including without limitation the implied warranties of merchantability, fitness for a particular purpose, and non-infringement.
The recipients of this report should rely on their own investigations.
This report is intended for distribution to institutional investors. Recipients who are not institutional investors should seek advice of their independent financial advisor prior to taking any investment decision based on
this report or for any necessary explanation of its contents.
Most and it’s associates may have managed or co-managed public offering of securities, may have received compensation for investment banking or merchant banking or brokerage services, may have received any
compensation for products or services other than investment banking or merchant banking or brokerage services from the subject company in the past 12 months.
Most and it’s associates have not received any compensation or other benefits from the subject company or third party in connection with the research report.
Subject Company may have been a client of Most or its associates during twelve months preceding the date of distribution of the research report
MOSt and/or its affiliates and/or employees may have interests/positions, financial or otherwise of over 1 % at the end of the month immediately preceding the date of publication of the research in the securities
mentioned in this report. To enhance transparency, MOSt has incorporated a Disclosure of Interest Statement in this document. This should, however, not be treated as endorsement of the views expressed in the
report.
Motilal Oswal Securities Limited is registered as a Research Analyst under SEBI (Research Analyst) Regulations, 2014. SEBI Reg. No. INH000000412
There are no material disciplinary action that been taken by any regulatory authority impacting equity research analysis activities
Analyst Certification
The views expressed in this research report accurately reflect the personal views of the analyst(s) about the subject securities or issues, and no part of the compensation of the research analyst(s) was, is, or will be
directly or indirectly related to the specific recommendations and views expressed by research analyst(s) in this report. The research analysts, strategists, or research associates principally responsible for preparation
of MOSt research receive compensation based upon various factors, including quality of research, investor client feedback, stock picking, competitive factors and firm revenues
Disclosure of Interest Statement
Analyst ownership of the stock
Served as an officer, director or employee
BAJAJ AUTO
No
No
A graph of daily closing prices of securities is available at www.nseindia.com and http://economictimes.indiatimes.com/markets/stocks/stock-quotes
Regional Disclosures (outside India)
For U.S.
This report is not directed or intended for distribution to or use by any person or entity resident in a state, country or any jurisdiction, where such distribution, publication, availability or use would be contrary to law,
regulation or which would subject MOSt & its group companies to registration or licensing requirements within such jurisdictions.
Motilal Oswal Securities Limited (MOSL) is not a registered broker - dealer under the U.S. Securities Exchange Act of 1934, as amended (the"1934 act") and under applicable state laws in the United States. In
addition MOSL is not a registered investment adviser under the U.S. Investment Advisers Act of 1940, as amended (the "Advisers Act" and together with the 1934 Act, the "Acts), and under applicable state laws in the
United States. Accordingly, in the absence of specific exemption under the Acts, any brokerage and investment services provided by MOSL, including the products and services described herein are not available to or
intended for U.S. persons.
This report is intended for distribution only to "Major Institutional Investors" as defined by Rule 15a-6(b)(4) of the Exchange Act and interpretations thereof by SEC (henceforth referred to as "major institutional
investors"). This document must not be acted on or relied on by persons who are not major institutional investors. Any investment or investment activity to which this document relates is only available to major
institutional investors and will be engaged in only with major institutional investors. In reliance on the exemption from registration provided by Rule 15a-6 of the U.S. Securities Exchange Act of 1934, as amended (the
"Exchange Act") and interpretations thereof by the U.S. Securities and Exchange Commission ("SEC") in order to conduct business with Institutional Investors based in the U.S., MOSL has entered into a chaperoning
agreement with a U.S. registered broker-dealer, Motilal Oswal Securities International Private Limited. ("MOSIPL"). Any business interaction pursuant to this report will have to be executed within the provisions of this
chaperoning agreement.
The Research Analysts contributing to the report may not be registered /qualified as research analyst with FINRA. Such research analyst may not be associated persons of the U.S. registered broker-dealer, MOSIPL,
and therefore, may not be subject to NASD rule 2711 and NYSE Rule 472 restrictions on communication with a subject company, public appearances and trading securities held by a research analyst account.
Motilal Oswal Capital Markets Singapore Pte Limited is acting as an exempt financial advisor under section 23(1)(f) of the Financial Advisers Act(FAA) read with regulation 17(1)(d) of the Financial Advisors
Regulations and is a subsidiary of Motilal Oswal Securities Limited in India. This research is distributed in Singapore by Motilal Oswal Capital Markets Singapore Pte Limited and it is only directed in Singapore to
accredited investors, as defined in the Financial Advisers Regulations and the Securities and Futures Act (Chapter 289), as amended from time to time.
In respect of any matter arising from or in connection with the research you could contact the following representatives of Motilal Oswal Capital Markets Singapore Pte Limited:
Kadambari Balachandran
Email : kadambari.balachandran@motilaloswal.com
Contact : (+65) 68189233 / 65249115
Office Address : 21 (Suite 31),16 Collyer Quay,Singapore 04931
For Singapore
Motilal Oswal Securities Ltd
23 October 2015
Motilal Oswal Tower, Level 9, Sayani Road, Prabhadevi, Mumbai 400 025
Phone: +91 22 3982 5500 E-mail: reports@motilaloswal.com
12