26 October 2015
Update | Sector: Metals
NMDC
Sell
BSE Sensex
27,362
S&P CNX
8,261
CMP: INR98
TP: INR81 (-17%)
Reduction in freight and export duties makes exports
viable
Stock Info
Bloomberg
Equity Shares (m)
52-Week Range (INR)
1, 6, 12 Rel. Per (%)
M.Cap. (INR b)
M.Cap. (USD b)
Avg Val (INRm)
Free float (%)
But will be short-lived as we expect IODEX to fall to USD40
NMDC IN
3,964.7
174/90
-3/-23/-41
376.6
5.9
312
20.0
Indian government recently made two changes to facilitate NMDC export iron
ore—rail freight reduced by ~INR1,500/t (Exhibits 2 and 3) and duties on
exports to Japan/South Korea reduced from 30% to 10%.
Exports now viable, but will still be margin dilutive
NMDC has signed an MoU with steel mills in Japan and Korea to supply ~16.5mt
iron ore by March 2018. Annual supply can fluctuate between 3.8mt and 5.3mt.
NMDC did not export a single ton during 1HFY16 due to high export duties and
freight levies. Under the revised freight & duty structure, the company will
generate a positive contribution on export volumes. We estimate incremental
revenue of ~INR751/914 per ton on fines/lumps (Exhibit 1:). Since the variable
costs are low at ~INR200/t, we expect an EBITDA per ton of INR550/714 on
fines/lumps; this implies an average EBITDA per ton of ~INR600/t on iron ore
exports at IODEX of USD51/dmt, which is lower than the EBITDA per ton of
INR884/t for domestic sales during 3QFY16E. If IODEX were to fall to USD40/t,
the EBITDA per ton on exports will be close to nil.
Financial Snapshot (INR Billion)
Y/E Mar
2015 2016E 2017E
Net Sales
123.6 61.8 59.9
EBITDA
Adj PAT
EPS (INR)
Gr (%)
RoE (%)
RoCE (%)
P/E (x)
P/BV (x)
EV/EBITDA (x)
77.8
65.9
16.6
20.8
20.8
5.9
1.2
2.6
29.7
31.5
7.9
14.8
14.7
12.3
1.2
7.1
25.8
27.1
6.8
8.6
8.6
14.3
1.1
9.3
3.1 -52.2 -13.8
EBITDA accretive at IODEX of USD51, but exports unviable at USD40
NMDC has a production capacity of ~34mtpa in Chhattisgarh (~7mtpa added in
1QFY16 with commissioning of 11B). Due to domestic oversupply, the
production is well below its potential. Hence, exports, although margin dilutive,
will be EBITDA accretive. As of now, we are not upgrading volumes because we
expect IODEX to soon fall to USD40/dmt—a level at which exports will become
unviable once again. Further, there is a risk to domestic realization on rising
domestic supply. Recently, Odisha increased volume limits from 57mtpa to
75mtpa.
Shareholding pattern (%)
Jun-15 Mar-15
Promoter 80.0
DII
FII
12.5
4.0
80.0
11.8
4.9
Jun-14
80.0
10.2
7.0
Others
3.5
3.3
2.8
FII Includes depository receipts
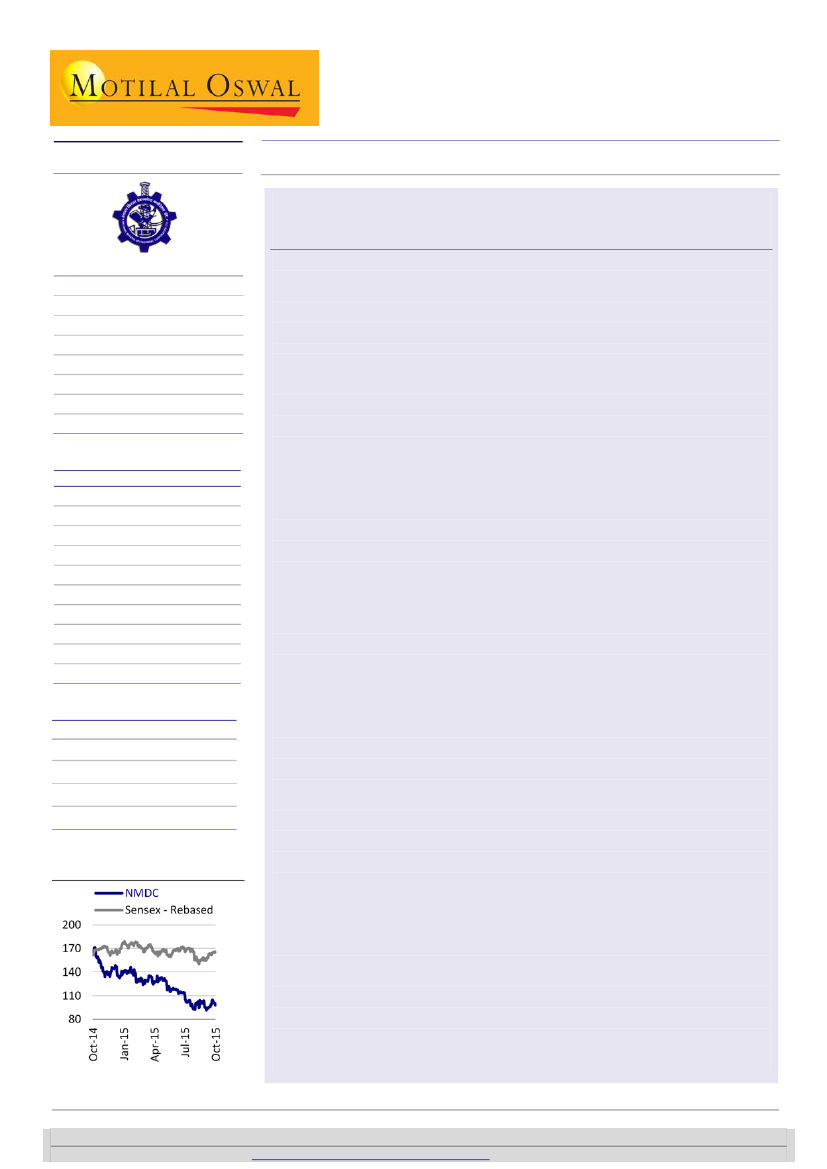
Stock Performance (1-year)
Expect more pressure on iron ore prices; maintain Sell
We expect iron ore (China cfr) prices to drop to ~USD40/t. Seaborne iron ore
supply is expected to grow by 80mtpa (~20mt from Goa, ~5mt from NMDC,
~55mt from Roy Hill); this is over and above the planned expansions of BIG4
(BHP, Rio, Vale, FMG), who are targeting production cost of USD15/t. With
dwindling Chinese crude steel production, we expect prices to come under
pressure.
NMDC is struggling to sell because of aggressive competition from private
mines and its margins have also come under pressure. Capital allocation to low-
RoI INR165b steel project and INR100b slurry pipeline and pelletization projects
will drag return ratios and force cut in dividend per share. We value the stock at
INR81/share based on SOTP valuation; maintain
Sell.
Sanjay Jain
(SanjayJain@MotilalOswal.com); +91 22 3982 5412
Dhruv Muchhal
(Dhruv.Muchhal@MotilalOswal.com); +91 22 3027 8033
Investors are advised to refer through disclosures made at the end of the Research Report.
Motilal Oswal research is available on
www.motilaloswal.com/Institutional-Equities,
Bloomberg, Thomson Reuters, Factset and S&P Capital.

NMDC
Exhibit 1: Realization on export at iron ore (china cfr) USD51/t under old and revised freight/duty structure
Fines
old
51.0
8.0
55.1
7.6
8.0
43.1
65.0
2,800
30
1,960
100
2,874
(1,014)
15
30
1,460
286
(1,300)
new
51.0
8.0
55.1
7.6
8.0
43.1
65.0
2,800
10
2,520
100
1,383
1,037
15
30
1,460
286
751
Lumps
old
new
51.0
51.0
8.0
8.0
0.105
0.105
61.9
61.9
7.6
7.6
8.0
8.0
49.4
49.4
65.0
65.0
3,208
3,208
30
10
2,246
2,887
100
100
2,874
1,383
(728)
1,404
15
15
30
30
2,500
2,500
490
490
(1,218)
914
Source: MOSL, Company
a.
b.
c.
d.
e.
f.
g.
h.
i.
j.
k.
m.
n.
o.
p.
q.
r.
s.
t.
Iron ore China cfr 62% Fe
NMDC grade premium for 65% Fe
Lump premium
cfr Japan/Korea (a+a*b%+c*65)
Sea freight
Moisture
Fob Vizag port (d-e-d*f%)
USD/INR
Fob Vizag port
export duty
Net fob realization (i-i*j%)
port handling
Rail freight
Net back mines (k-m-n)
Royalty
DMF
NMDC ex-mine domestic price
total royalties etc. (r*p%+r*p%*q%*1.02)
Net ex-mine export realization (o-s)
USD/dmt
%
USD/dmtu
USD/dmt
USD/dmt
%
USD/wmt
INR/wmt
%
INR/wmt
INR/wmt
INR/wmt
INR/wmt
%
%
INR/wmt
INR/wmt
INR/wmt
Exhibit 2: Rail freight charges on iron ore exports under revised rules—w.e.f September 2015
a. Distance in KM
A. Class 165 rate table
B. Distanc based surcharge (A*a%+b)
(a) ad-valorem
(b) specific
C. Freight (A+B)
D. Busy season (except July-Sep) @15%
E. Freight (C+D)
F. Development surcharge@5%
H. Freight (E+F)
I. tax @4.2%
J. Total freight
INR/T
INR/T
(%)
INR/T
INR/T
INR/T
INR/T
INR/T
INR/T
INR/T
INR/T
100
234
300
0
300
534
80
614
31
645
27
672
200
357
300
0
300
657
99
756
38
793
33
827
300
504
300
0
300
804
121
925
46
971
41
1,012
400
500
600
650
799
949
300
300
300
0
0
0
300
300
300
950
1,099
1,249
143
165
187
1,093
1,264
1,436
55
63
72
1,147
1,327
1,508
48
56
63
1,195
1,383
1,572
Source: MOSL, Company
Exhibit 3: Rail freight charges on iron ore exports under earlier rules—prior to September 2015
a. Distance in KM
A. Class 165
B. Distanc based surcharge (A*a%+b)
(a) ad-valorem
(b) specific
C. Freight (A+B)
D. Busy season (except July-Sep) @15%
E. Freight (C+D)
F. Development surcharge@5%
H. Freight (E+F)
I. tax @4.2%
J. Total freight
INR/T
INR/T
(%)
INR/T
INR/T
INR/T
INR/T
INR/T
INR/T
INR/T
INR/T
100
234
1,418
125
1,125
1,652
248
1,899
95
1,994
84
2,078
200
357
1,571
125
1,125
1,928
289
2,217
111
2,328
98
2,426
300
504
1,579
90
1,125
2,083
312
2,395
120
2,515
106
2,620
400
500
600
650
799
949
1,613
1,485
1,362
75
45
25
1,125
1,125
1,125
2,263
2,284
2,311
339
343
347
2,602
2,627
2,658
130
131
133
2,732
2,758
2,791
115
116
117
2,847
2,874
2,908
Source: MOSL, Company
26 October 2015
2

NMDC
Australian mines targeting production cost of USD15/t on fob basis
Excerpts from press releases of Fortescue Metal Group (FMG), Rio Tinto and BHP
Billiton clearly show that iron ore production cost is heading toward (unless USD
starts to depreciate) USD15/t (Vale at USD13/t), while iron ore price index is still
very good at ~USD50-55/t. While BHP, Rio and FMG continue to pump iron ore in
seaborne market at elevated level, another high grade ~55mtpa from Roy Hill is
waiting to enter sea— 90% of that has already been sold through long-term
contracts, while 50% will be picked up by minority shareholders. India too will boost
iron ore exports by 20mt (Goa) and 5mtpa (NMDC) after reduction in export duties
from 30% to 10%. Iron ore imports by China were unchanged at 699mt during the
first nine months in CY2015 amid shrinking steel demand in China (-3.5% in CY15).
Fortescue Metal Group
Based on operating targets, FMG expects to exit FY16 with a production cost of
USD15/wmt (at an exchange rate of 0.72). In 1QFY16, the company achieved a C1
cost of USD16.9/t.
Exhibit 4: FMG’s production and cash cost summary
Source: Company
Rio Tinto
1HFY15 result excerpts – “This
is reflected in a reduction in Pilbara cash unit costs to
USD16.20 per tonne in 2015 first half, compared with USD20.40 per tonne in 2014
first half. Pilbara operations delivered a free on board (FOB) EBITDA margin of 61%
in 2015 first half (2014 first half: 70%)”
BHP Billiton
WAIO unit cash costs declined 31% to USD19 per tonne, underpinned by reductions
in labor, contractor and maintenance costs, lower diesel prices and a stronger US
dollar. In the FY16, unit costs are expected to fall further to USD15 per tonne.
26 October 2015
3

NMDC
Exhibit 5: BHP 2HFY15 iron ore cash cost summary
Source: Company
26 October 2015
4

NMDC
Financials and valuations
Income Statement (Consolidated)
Y/E March
Net sales
Change (%)
Total Expenses
EBITDA
% of Net Sales
Depn. & Amortization
EBIT
Net Interest
Other income
PBT before EO
EO income
PBT after EO
Tax
Rate (%)
Reported PAT
Adjusted PAT
Change (%)
2011
113,689
82.2
27,260
86,430
76.0
1,215
85,215
12,057
97,272
97,272
32,280
33.2
64,992
64,992
88.8
2012
112,615
-0.9
23,334
89,281
79.3
1,328
87,953
20,169
108,123
-513
107,610
34,941
32.5
72,669
73,015
12.3
2013
107,043
-4.9
29,205
77,838
72.7
1,385
76,452
22,389
98,841
-4,058
94,783
31,228
32.9
63,556
66,277
-9.2
2014
120,582
12.6
42,869
77,713
64.4
1,504
76,209
20,945
97,154
455
97,609
33,391
34.2
64,218
63,919
-3.6
2015
123,564
2.5
45,787
77,777
62.9
1,622
76,155
23,200
99,354
99,354
33,460
33.7
65,895
65,895
3.1
2016E
61,811
-50.0
32,128
29,682
48.0
1,664
28,018
18,929
46,947
46,947
15,471
33.0
31,476
31,476
-52.2
(INR Million)
2017E
59,921
-3.1
34,074
25,847
43.1
1,837
24,010
15,894
39,903
39,903
12,769
32.0
27,134
27,134
-13.8
Balance Sheet
Y/E March
Share Capital
Reserves
Share holders funds
Defferred tax liability (net)
Capital Employed
Gross Block
Less: Accum. Deprn.
Net Fixed Assets
Capital WIP
Investments
Curr. Assets
Inventories
Sundry Debtors
Cash and Bank
Loans and Advances
Curr. Liability & Prov.
Sundry Creditors
Other Liabilities & prov.
Net Current Assets
Application of Funds
E: MOSL Estimates
2011
3,965
188,181
192,145
1,029
193,174
22,728
11,736
10,993
6,772
1,357
191,860
4,154
4,854
172,281
10,571
17,807
6,145
11,662
174,053
193,174
2012
3,965
240,099
244,064
1,001
245,065
23,882
11,994
11,888
19,147
2,478
232,972
4,589
7,370
202,646
18,367
21,420
6,447
14,973
211,552
245,065
2013
3,965
271,145
275,110
1,045
276,155
26,025
13,379
12,647
32,808
2,497
260,992
6,375
10,822
210,258
33,538
32,788
11,094
21,694
228,204
276,155
2014
3,965
295,918
299,883
1,073
300,956
28,506
14,883
13,623
57,613
2,504
241,029
6,812
14,484
186,572
33,161
13,814
11,092
2,722
227,216
300,956
2015
3,965
319,353
323,317
984
324,301
31,969
16,505
15,464
74,973
5,619
248,642
6,919
17,523
184,431
39,768
20,397
2,263
18,134
228,245
324,301
2016E
3,965
332,274
336,239
984
337,223
35,969
18,169
17,800
106,938
5,619
228,388
3,387
8,467
176,765
39,768
21,521
3,387
18,134
206,866
337,223
(INR Million)
2017E
3,965
340,854
344,819
984
345,803
39,969
20,007
19,962
143,416
5,619
198,223
3,283
8,208
146,963
39,768
21,418
3,283
18,134
176,805
345,803
26 October 2015
5

NMDC
Financials and valuations
Ratios
Y/E March
Basic (INR)
EPS
Cash EPS
BV/Share
DPS
Payout (%)
Valuation (x)
P/E
Cash P/E
P/BV
EV/EBITDA
Dividend Yield (%)
EV/ton
Return Ratios (%)
RoE
RoCE
RoIC
Working Capital Ratios
Fixed Asset Turnover (x)
Asset Turnover (x)
Debtor (Days)
Inventory (Days)
Creditors (Days)
Leverage Ratio (x)
Current Ratio
Debt/Equity
2011
16.4
16.7
48.5
2.2
15.3
2012
18.4
18.8
61.6
4.5
26.3
7.1
7.0
2.1
3.5
3.4
5
29.7
29.5
403.2
5.0
0.6
16
13
20
10.8
-0.9
31.6
31.5
346.6
4.7
0.5
24
15
21
10.9
-0.8
2013
16.7
17.1
69.4
7.0
51.1
7.8
7.7
1.9
4.0
5.3
4
26.8
26.7
215.3
4.1
0.4
37
22
38
8.0
-0.8
2014
16.1
16.5
75.6
8.5
61.4
8.1
7.9
1.7
4.3
6.5
4
22.6
22.6
119.5
4.2
0.4
44
21
34
17.4
-0.6
2015
16.6
17.0
81.5
8.6
60.2
5.9
5.7
1.2
2.6
8.8
2
20.8
20.8
88.6
3.9
0.4
52
20
7
12.2
-0.6
2016E
7.9
8.4
84.8
4.0
58.9
12.3
11.7
1.2
7.1
4.1
2
14.8
14.7
64.7
1.7
0.2
50
20
20
10.6
-0.5
2017E
6.8
7.3
87.0
4.0
68.4
14.3
13.4
1.1
9.3
4.1
3
8.6
8.6
35.9
1.5
0.2
50
20
20
9.3
-0.4
Cash Flow Statement
Y/E March
Pre-tax profit
Depreciation
(Inc)/Dec in Wkg. Cap.
Tax paid
Other operating activities
CF from Op. Activity
(Inc)/Dec in FA + CWIP
Free Cash Flow
(Pur)/Sale of Investments
CF from Inv. Activity
Equity raised/(repaid)
Debt raised/(repaid)
Dividend (incl. tax)
Other financing activities
CF from Fin. Activity
(Inc)/Dec in Cash
Add: opening Balance
Closing Balance
E: MOSL Estimates
2011
97,272
1,215
-1,162
-32,280
-4,549
60,496
-6,228
54,268
-595
-6,823
2012
107,610
1,328
-7,134
-34,941
-2,739
64,123
-13,529
50,595
-1,121
-14,650
2013
94,783
1,385
-9,040
-31,228
5
55,906
-15,805
40,102
-19
-15,824
2014
97,609
1,504
-22,697
-33,391
12
43,037
-27,286
15,751
-7
-27,293
2015
99,354
1,622
-3,170
-33,460
-2,888
61,459
-20,823
40,636
-3,116
-23,939
2016E
46,947
1,664
13,712
-15,471
46,853
-35,964
10,888
-35,964
(INR Million)
2017E
39,903
1,837
259
-12,769
29,230
-40,478
-11,248
-40,478
-9,942
-9,942
43,731
128,549
172,281
-19,109
-19,109
30,365
172,281
202,646
-32,471
-32,471
7,612
202,646
210,258
-39,429
-39,429
-23,685
210,258
186,572
-39,661
-39,661
-2,141
186,572
184,431
-18,555
-18,555
-7,666
184,431
176,765
-18,555
-18,555
-29,803
176,765
146,963
26 October 2015
6

NMDC GALLERY
NMDC
OTHER COMPANIES
SECTOR UPDATES

Disclosures
This document has been prepared by Motilal Oswal Securities Limited (hereinafter referred to as Most) to provide information about the company(ies) and/sector(s), if any, covered in the report and may be distributed
by it and/or its affiliated company(ies). This report is for personal information of the selected recipient/s and does not construe to be any investment, legal or taxation advice to you. This research
NMDC
not
report does
constitute an offer, invitation or inducement to invest in securities or other investments and Motilal Oswal Securities Limited (hereinafter referred as MOSt) is not soliciting any action based upon it. This report is not for
public distribution and has been furnished to you solely for your general information and should not be reproduced or redistributed to any other person in any form. This report does not constitute a personal
recommendation or take into account the particular investment objectives, financial situations, or needs of individual clients. Before acting on any advice or recommendation in this material, investors should consider
whether it is suitable for their particular circumstances and, if necessary, seek professional advice. The price and value of the investments referred to in this material and the income from them may go down as well as
up, and investors may realize losses on any investments. Past performance is not a guide for future performance, future returns are not guaranteed and a loss of original capital may occur.
MOSt and its affiliates are a full-service, integrated investment banking, investment management, brokerage and financing group. We and our affiliates have investment banking and other business relationships with a
some companies covered by our Research Department. Our research professionals may provide input into our investment banking and other business selection processes. Investors should assume that MOSt and/or
its affiliates are seeking or will seek investment banking or other business from the company or companies that are the subject of this material and that the research professionals who were involved in preparing this
material may educate investors on investments in such business. The research professionals responsible for the preparation of this document may interact with trading desk personnel, sales personnel and other
parties for the purpose of gathering, applying and interpreting information. Our research professionals are paid on the profitability of MOSt which may include earnings from investment banking and other business.
MOSt generally prohibits its analysts, persons reporting to analysts, and members of their households from maintaining a financial interest in the securities or derivatives of any companies that the analysts cover.
Additionally, MOSt generally prohibits its analysts and persons reporting to analysts from serving as an officer, director, or advisory board member of any companies that the analysts cover. Our salespeople, traders,
and other professionals or affiliates may provide oral or written market commentary or trading strategies to our clients that reflect opinions that are contrary to the opinions expressed herein, and our proprietary
trading and investing businesses may make investment decisions that are inconsistent with the recommendations expressed herein. In reviewing these materials, you should be aware that any or all of the foregoing
among other things, may give rise to real or potential conflicts of interest. MOSt and its affiliated company(ies), their directors and employees and their relatives may; (a) from time to time, have a long or short position
in, act as principal in, and buy or sell the securities or derivatives thereof of companies mentioned herein. (b) be engaged in any other transaction involving such securities and earn brokerage or other compensation
or act as a market maker in the financial instruments of the company(ies) discussed herein or act as an advisor or lender/borrower to such company(ies) or may have any other potential conflict of interests with
respect to any recommendation and other related information and opinions.; however the same shall have no bearing whatsoever on the specific recommendations made by the analyst(s), as the recommendations
made by the analyst(s) are completely independent of the views of the affiliates of MOSt even though there might exist an inherent conflict of interest in some of the stocks mentioned in the research report
Reports based on technical and derivative analysis center on studying charts company's price movement, outstanding positions and trading volume, as opposed to focusing on a company's fundamentals and, as
such, may not match with a report on a company's fundamental analysis. In addition MOST has different business segments / Divisions with independent research separated by Chinese walls catering to different set
of customers having various objectives, risk profiles, investment horizon, etc, and therefore may at times have different contrary views on stocks sectors and markets.
Unauthorized disclosure, use, dissemination or copying (either whole or partial) of this information, is prohibited. The person accessing this information specifically agrees to exempt MOSt or any of its affiliates or
employees from, any and all responsibility/liability arising from such misuse and agrees not to hold MOSt or any of its affiliates or employees responsible for any such misuse and further agrees to hold MOSt or any of
its affiliates or employees free and harmless from all losses, costs, damages, expenses that may be suffered by the person accessing this information due to any errors and delays. The information contained herein is
based on publicly available data or other sources believed to be reliable. Any statements contained in this report attributed to a third party represent MOSt’s interpretation of the data, information and/or opinions
provided by that third party either publicly or through a subscription service, and such use and interpretation have not been reviewed by the third party. This Report is not intended to be a complete statement or
summary of the securities, markets or developments referred to in the document. While we would endeavor to update the information herein on reasonable basis, MOSt and/or its affiliates are under no obligation to
update the information. Also there may be regulatory, compliance, or other reasons that may prevent MOSt and/or its affiliates from doing so. MOSt or any of its affiliates or employees shall not be in any way
responsible and liable for any loss or damage that may arise to any person from any inadvertent error in the information contained in this report. MOSt or any of its affiliates or employees do not provide, at any time,
any express or implied warranty of any kind, regarding any matter pertaining to this report, including without limitation the implied warranties of merchantability, fitness for a particular purpose, and non-infringement.
The recipients of this report should rely on their own investigations.
This report is intended for distribution to institutional investors. Recipients who are not institutional investors should seek advice of their independent financial advisor prior to taking any investment decision based on
this report or for any necessary explanation of its contents.
Most and it’s associates may have managed or co-managed public offering of securities, may have received compensation for investment banking or merchant banking or brokerage services, may have received any
compensation for products or services other than investment banking or merchant banking or brokerage services from the subject company in the past 12 months.
Most and it’s associates have not received any compensation or other benefits from the subject company or third party in connection with the research report.
Subject Company may have been a client of Most or its associates during twelve months preceding the date of distribution of the research report
MOSt and/or its affiliates and/or employees may have interests/positions, financial or otherwise of over 1 % at the end of the month immediately preceding the date of publication of the research in the securities
mentioned in this report. To enhance transparency, MOSt has incorporated a Disclosure of Interest Statement in this document. This should, however, not be treated as endorsement of the views expressed in the
report.
Motilal Oswal Securities Limited is registered as a Research Analyst under SEBI (Research Analyst) Regulations, 2014. SEBI Reg. No. INH000000412
There are no material disciplinary action that been taken by any regulatory authority impacting equity research analysis activities
Analyst Certification
The views expressed in this research report accurately reflect the personal views of the analyst(s) about the subject securities or issues, and no part of the compensation of the research analyst(s) was, is, or will be
directly or indirectly related to the specific recommendations and views expressed by research analyst(s) in this report. The research analysts, strategists, or research associates principally responsible for preparation
of MOSt research receive compensation based upon various factors, including quality of research, investor client feedback, stock picking, competitive factors and firm revenues
Disclosure of Interest Statement
Analyst ownership of the stock
Served as an officer, director or employee
NMDC
No
No
A graph of daily closing prices of securities is available at www.nseindia.com and http://economictimes.indiatimes.com/markets/stocks/stock-quotes
Regional Disclosures (outside India)
For U.S.
This report is not directed or intended for distribution to or use by any person or entity resident in a state, country or any jurisdiction, where such distribution, publication, availability or use would be contrary to law,
regulation or which would subject MOSt & its group companies to registration or licensing requirements within such jurisdictions.
Motilal Oswal Securities Limited (MOSL) is not a registered broker - dealer under the U.S. Securities Exchange Act of 1934, as amended (the"1934 act") and under applicable state laws in the United States. In
addition MOSL is not a registered investment adviser under the U.S. Investment Advisers Act of 1940, as amended (the "Advisers Act" and together with the 1934 Act, the "Acts), and under applicable state laws in the
United States. Accordingly, in the absence of specific exemption under the Acts, any brokerage and investment services provided by MOSL, including the products and services described herein are not available to or
intended for U.S. persons.
This report is intended for distribution only to "Major Institutional Investors" as defined by Rule 15a-6(b)(4) of the Exchange Act and interpretations thereof by SEC (henceforth referred to as "major institutional
investors"). This document must not be acted on or relied on by persons who are not major institutional investors. Any investment or investment activity to which this document relates is only available to major
institutional investors and will be engaged in only with major institutional investors. In reliance on the exemption from registration provided by Rule 15a-6 of the U.S. Securities Exchange Act of 1934, as amended (the
"Exchange Act") and interpretations thereof by the U.S. Securities and Exchange Commission ("SEC") in order to conduct business with Institutional Investors based in the U.S., MOSL has entered into a chaperoning
agreement with a U.S. registered broker-dealer, Motilal Oswal Securities International Private Limited. ("MOSIPL"). Any business interaction pursuant to this report will have to be executed within the provisions of this
chaperoning agreement.
The Research Analysts contributing to the report may not be registered /qualified as research analyst with FINRA. Such research analyst may not be associated persons of the U.S. registered broker-dealer, MOSIPL,
and therefore, may not be subject to NASD rule 2711 and NYSE Rule 472 restrictions on communication with a subject company, public appearances and trading securities held by a research analyst account.
Motilal Oswal Capital Markets Singapore Pte Limited is acting as an exempt financial advisor under section 23(1)(f) of the Financial Advisers Act(FAA) read with regulation 17(1)(d) of the Financial Advisors
Regulations and is a subsidiary of Motilal Oswal Securities Limited in India. This research is distributed in Singapore by Motilal Oswal Capital Markets Singapore Pte Limited and it is only directed in Singapore to
accredited investors, as defined in the Financial Advisers Regulations and the Securities and Futures Act (Chapter 289), as amended from time to time.
In respect of any matter arising from or in connection with the research you could contact the following representatives of Motilal Oswal Capital Markets Singapore Pte Limited:
Kadambari Balachandran
Email : kadambari.balachandran@motilaloswal.com
Contact : (+65) 68189233 / 65249115
Office Address : 21 (Suite 31),16 Collyer Quay,Singapore 04931
For Singapore
26 October 2015
Motilal Oswal Tower, Level 9, Sayani Road, Prabhadevi, Mumbai 400 025
Phone: +91 22 3982 5500 E-mail: reports@motilaloswal.com
Motilal Oswal Securities Ltd
8