27 October 2015
2QFY16 Results Update | Sector:
Entertainment
BSE SENSEX
27,253
Bloomberg
Equity Shares (m)
M.Cap. (INR b) / (USD b)
52-Week Range (INR)
1, 6, 12 Rel. Per (%)
Avg Val (INR m)
Free float (%)
S&P CNX
8,233
WONH IN
56.5
17.8/0.3
349/242
3/12/-2
55
29.0
CMP: INR315
TP: INR360 (+15%)
Wonderla Holidays
Buy
Financials & Valuation (INR Billion)
Y/E MAR
Sales
EBITDA
NP
EPS (INR)
Gr. (%)
BV/Sh. (INR)
RoE (%)
RoCE (%)
P/E (x)
P/BV (x)
2015 2016E 2017E
1.8
0.8
0.5
9.0
-5.7
63.1
20.0
27.4
35.2
5.0
2.1
0.9
0.6
10.7
19.4
71.4
15.9
22.6
29.5
4.4
3.2
1.3
0.8
13.9
30.0
82.4
18.1
25.6
22.7
3.8
Estimate change
TP change
Rating change
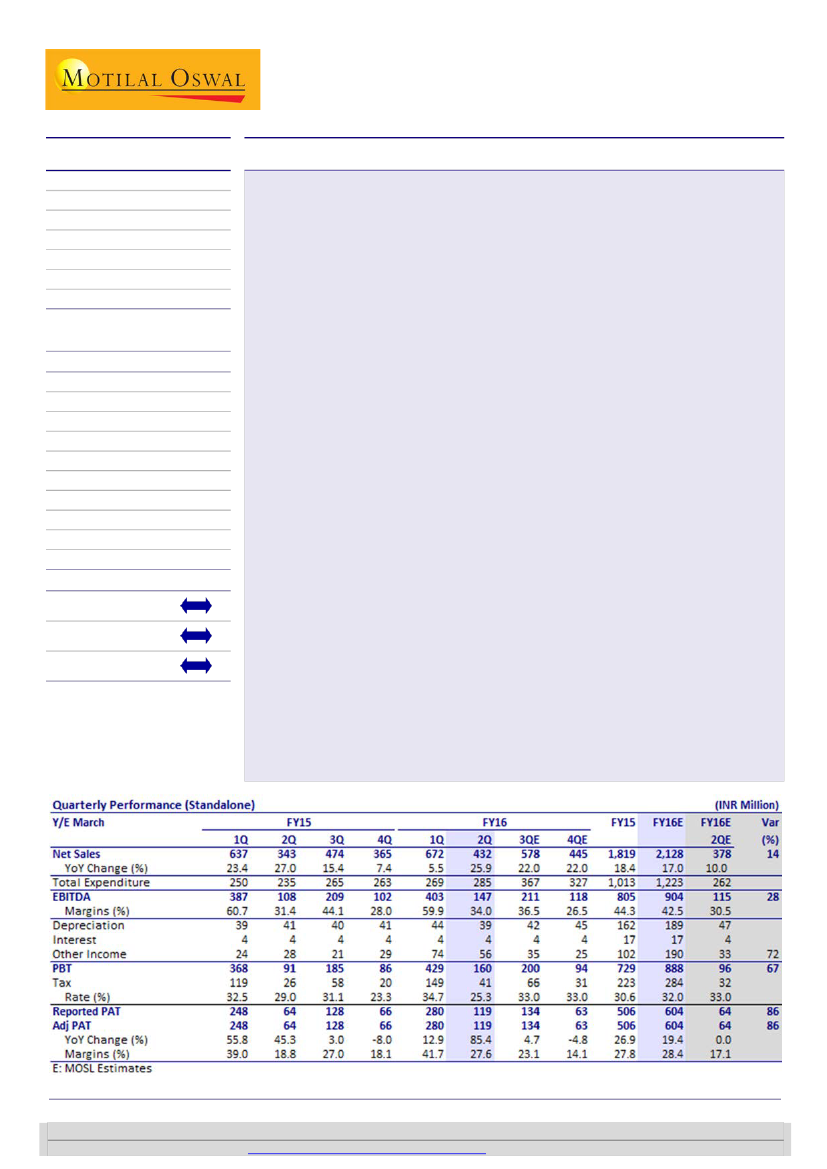
Strong footfall growth of 7% YoY and realization growth of 17% YoY leads to all-
round beat:
Wonderla Holidays saw 2QFY16 revenue grow 25.9% YoY to INR432m
(est. of INR378m) v/s INR343m in 2QFY15. Footfalls grew 7% YoY to 469.6k in
2QFY16 while average revenue per visitor grew 17% YoY to INR955. The company
effectively took two price hikes—one in 1QFY16 of ~10% and second of ~5% in
2QFY16—to cushion the effect of contingent provisions toward service tax.
Management maintained its guidance of ~3-4% footfall growth in FY16.
Margins higher than estimates; provision for disputed service tax drags margins:
EBITDA grew 37% YoY in 2QFY16 to INR147m (est. of INR115m); EBITDA margins
stood at 34% (est. of 30.5%) v/s 31.4% in 2QFY15, an expansion of 260bp YoY.
Other expenses increased 770bp, mainly on account of INR30m of provision for
disputed service tax liability. Management highlighted that post filing an appeal
against levy of service tax in Kochi and Bangalore High Courts, the company has
received a stay order from the Kochi court and has accordingly discontinued
charging and recovering service tax from July 1 in the city. Though the case is still
pending in Bangalore, Wonderla has discontinued charging and recovering service
tax in the city from August 12, 2015. PAT for 2QFY16 stood at INR119m (est. of
INR64m), a YoY growth of 85.4%.
2HFY16 footfall growth to be significantly stronger than 1HFY16:
Seasonally, 1Q
and 3Q are the strongest quarters for amusement parks. Given the focus on
promotional campaigns, coupled with revival in demand from schools, we believe
footfall growth should revive from -2% in 1HFY16 to +8% in 2HFY16. However, we
believe continued provisioning for disputed service tax and higher advertising
spends (deferred from 2Q to 3Q due to delayed festive season) will result in flat
EBITDA growth in 2HFY16.
Valuation and view:
We expect WONH’s revenue to clock 33% CAGR and 24%
PAT CAGR over FY15-17. We upgrade our FY16/FY17 EPS estimates by 11%/4%,
given the strong earnings beat in 2QFY16 and footfall growth revival expected in
2HFY16. We believe WONH is on track to be a pan-India player over the long run
and will be a major beneficiary of the amusement park industry’s development.
The stock trades at 29.5x FY16E and 22.7x FY17E earnings; we value WONH at 26x
FY17E EPS, with a target price of INR360. Maintain
Buy.
Results beat expectations; footfall growth revival expected in 2HFY16
Niket Shah
(Niket.Shah@MotilalOswal.com); +91 22 3982 5426
Atul Mehra
(Atul.Mehra@MotilalOswal.com); +91 22 3982 5417
Investors are advised to refer through disclosures made at the end of the Research Report.
Motilal Oswal research is available on
www.motilaloswal.com/Institutional-Equities,
Bloomberg, Thomson Reuters, Factset and S&P Capital.

Wonderla Holidays
Results beat expectations
Wonderla Holidays saw 2QFY16 revenue grow 25.9% YoY at INR432m (est. of
INR378m) vs INR343m in 2QFY15.
Footfalls grew 7% YoY to 469.2k in 2QFY16 while Average Revenue per Visitor
grew 17% YoY to INR971.
The company effectively took two price hikes – one in 1QFY16 of ~10% annual
price hike and around ~5% of price hike in 2QFY16 to cushion the effect of service
tax provided for.
Overall, management maintained guidance of footfall growth of ~3-4% in FY16.
Exhibit 1: Revenue growth at 26% YoY
Revenues (INR m)
23%
27%
15%
7%
637
1QFY15
343
2QFY15
474
3QFY15
365
4QFY15
1QFY16
672
5%
432
2QFY16
Growth (%)
26%
Exhibit 2: Footfalls posted a robust growth of 7%
Footfalls (m)
9%
9%
0.7
-1%
0.5
-8%
4QFY15
-8%
1QFY16
Growth (%)
7%
0.8
1QFY15
0.4
2QFY15
0.6
3QFY15
0.5
2QFY16
Source: Company, MOSL
Margins beat estimates; provision for disputed service tax dragged margins
EBITDA grew by 37% YoY in 2QFY16 to INR147m (est. of INR115m); margins stood
at 34% (est. of 30.5%) v/s 31.4% in 2QFY15, expansion of 260bp YoY.
Other expenses increased by 770bp mainly on account of INR30m of provision for
disputed service tax liability. Management highlighted that post filing an appeal
against levy of service tax in Kochi and Bangalore High Courts, the company has
received a stay order from Kochi while the case is still pending in Bangalore.
Accordingly, Wonderla Kochi discontinued charging and recovering service tax
from 1
st
July in Kochi and 12
th
August, 2015 in Bangalore. PAT for 2QFY16 stood at
INR119m (est. INR64m), a YoY growth of 85.4%.
Other income stood at INR56m vs INR28m in 2QFY16, led by income on IPO
funds, driving PAT higher.
PAT for 2QFY16 stood at INR119m (est. INR64m), a YoY growth of 85.4%.
Exhibit 4: PAT up 85% YoY
PAT (INR m)
56%
Growth (%)
85%
Exhibit 3: EBITDA margins expanded 300bp YoY
61%
EBITDA (INR m)
Margins (%)
60%
44%
31%
28%
34%
45%
280
-8%
66
4QFY15
1QFY16
13%
119
2QFY16
3%
387
1QFY15
108
2QFY15
209
3QFY15
102
4QFY15
403
1QFY16
147
2QFY16
248
1QFY15
64
2QFY15
128
3QFY15
Source: Company, MOSL
27 October 2015
Source: Company, MOSL
3

Wonderla Holidays
Bangalore park performance
Bangalore posted 18.3% revenue growth led mainly by 13.8% growth in ARPU.
Average ticket revenue grew 12% YoY to INR738.6 while average non-ticket
revenue posted a 21% YoY growth to INR200.3.
2QFY15
187
226
825
2QFY16
221
235
939
YoY (%)
18.3%
3.9%
13.8%
Exhibit 5: 2QFY16 performance of Bangalore park
Particulars
Total Revenues (INR m)
No of Visitors (In ‘000)
Avg. Revenue Per Visitor (INR)
Source: Company, MOSL
Kochi park performance
Kochi posted 37.2% revenue growth led by 23.4% growth in ARPU and 11.2%
growth in footfalls.
While the footfalls in 2QFY15 constituted of 57% walk-ins, this increased to 59%
in 2QFY16, which further boosted average ticket revenues since discounted
tickets are less in the case of walk-ins.
Average ticket revenue grew 21% YoY to INR715 while average non-ticket
revenue posted a 35% YoY growth to INR164.2.
2QFY15
150
211
713
2QFY16
206
234
879
YoY (%)
37.2%
11.2%
23.4%
Exhibit 6: 2QFY16 performance of Kochi park
Particulars
Total Revenues (INR m)
No of Visitors (In ‘000)
Avg. Revenue Per Visitor (INR)
Source: Company, MOSL
Bangalore resort performance
Bangalore resort posted 2.6% revenue growth led by ARR’s which grew by 11.7%
YoY to INR4,552/room.
However, occupancy reduced from 44% in 2QFY15 to 33% in 2QFY16 on account
of lesser contribution from long staying guests.
Exhibit 7: 2QFY16 performance of Bangalore resort
Particulars
Total Revenues (INR m)
Total no. of room nights available to guests
Occupancy (%)
Avg. Room Rental for the period (INR)
2QFY15
21
7,600
33%
4,077
2QFY16
22
7,611
44%
4,522
YoY (%)
2.6%
15.%
-25%
11.7%
Hyderabad park launch on track for April - 2016
Source: Company, MOSL
Over 49.5 acres of land has been acquired for the Hyderabad Park. Current park
development is on 27 acres. The park would initially comprise of 43 rides.
Investment made in Hyderabad Park as on 30
th
September 2015 was INR1,056m.
Management highlighted that all approvals, including land acquisition, are well
in place and construction is as per schedule.
The park is likely to become operational by April, 2016 and contains the capacity
to entertain as much as 9,000-10,000 people in a single day.
Management has guided for a capex of ~INR220m for existing parks and
~INR500m for Hyderabad Park in FY16.
27 October 2015
4

Wonderla Holidays
Valuation and view
We value WONH at 26x FY17E EPS with a target price of INR360, which we believe is
justified considering:
Company is one of the largest and most profitable parks in India. With the new
park opening in Hyderabad in FY17, we believe it has huge potential to grow.
There are ~140 amusement parks in India, of which only ~10% are of large
formats. Thus, the competition intensity is very low.
Development of an amusement park requires huge capex and operational
expertise to be successful. Hence, it is a huge entry barrier for new entrants.
Lack of any large amusement park in the vicinity of Bangalore and Kochi gives a
huge advantage.
Globally, most large amusement parks are loss-making. We believe that a target
multiple of 26x to WONH is justified given its profitable operations, experienced
management and significant opportunity for amusement parks’ growth in India.
We believe the following factors can pose risks to our estimates:
Any occurrence of accidents or mishaps at amusement parks exposes the
company to possible financial liabilities and legal proceedings, resulting in
adverse publicity.
Lower-than-expected footfall growth for Hyderabad park and a decline in
footfall growth for existing matured parks such as Bangalore and Kochi can
significantly affect company’s earnings.
Any delay in completion of construction of Hyderabad park can delay our
earnings estimates.
Company is currently focused only on South markets. Any political instability,
natural calamity or epidemic breakout in the Southern region may result in
significant lowering of our earnings estimates.
Environmental risk like floods, heavy rainfalls etc can significantly affect the
footfall growth. Kochi saw de-growth in footfalls due to heavy rain falls.
Exhibit 8: Global peer comparison
Company Name
Six Flags Entertainment
Haichang Holdings
Walt Disney Co
Average
Wonderla
Currenc
USD
USD
USD
Market
Cap (M) FY15
4,947
1,157
908
242
191,606 48,799
EBITDA Margin (%)
RoE (%)
P/E (x)
FY15 FY16E FY17E FY15 FY16E FY17E FY15 FY16E FY17E
37.4 37.9 39.1 22.9 76.5 77.5 52.8 34.4 29.6
44.0 41.8 43.9 7.9
5.8
6.3 27.5 24.2 19.7
29.5 30.1 30.6 16.8 18.8 22.2 26.3 22.4 20.2
37.0 36.6 37.9 15.9 33.7 35.3 35.5 27.0 23.2
1,819 2,128 3,235 44.3 42.5 40.5 20.9 15.9 18.1 35.2 29.5 22.7
Source: Company, MOSL
Sales
FY16E FY17E
1,235 1,300
258
297
52,490 56,045
27 October 2015
5

Wonderla Holidays
Exhibit 9: Key
assumptions
Absolute
Kochi Footfalls (In m)
Bangalore Footfalls (In m)
Hyderabad Footfalls (in m)
Total Footfalls
Kochi Ticket realization (INR)
Bangalore Ticket realization (INR)
Hyderabad Ticket realization (INR)
Bangalore (no of rooms)
Occupancy rate (%)
Growth
Footfall growth
Kochi
Bangalore
Total Footfalls
Ticket realization growth
Kochi
Bangalore
FY10
0.89
0.72
1.61
327
423
FY11
1.11
0.92
2.03
336
440
FY12
1.18
1.08
2.26
383
489
FY13
1.21
1.13
2.34
423
545
84
34%
FY14
1.10
1.19
2.29
477
598
84
32%
FY15
1.09
1.25
2.34
556
672
88
45%
FY16E
1.12
1.29
2.41
656
780
88
50%
FY17E
1.17
1.36
0.70
3.23
723
859
88
55%
-1%
14%
5%
10%
-3%
24%
28%
26%
3%
4%
6%
18%
11%
14%
11%
3%
5%
4%
10%
11%
-9%
5%
-2%
13%
10%
-1%
5%
2%
17%
12%
3%
3%
3%
18%
16%
4%
6%
34%
10%
10%
27 October 2015
6

Wonderla Holidays
Story in charts
Indian amusement park industry still at nascent stage
Exhibit 10: Total footfalls of India’s amusement parks is less than individual global amusement parks
Visitors in 2013 (in m)
18.6
17.2
16.2
14.1
11.2
6.0
Magic Kingdom, US
Tokyo Disneyland
Disneyland
California, US
Tokyo DisneySea
Walt Disney World
Resort, US
Total India
Source: Company, MOSL
Wonderla has a first-mover advantage with rich operating experience
Exhibit 11: Kochi park footfall trend
Kochi Footfalls (In m)
24%
1.11
0.90 0.89
10%
-1%
6%
1.18
1.21
YoY Growth
1.10 1.09 1.12 1.17
3%
4%
0.63
2%
14%
0.72
1.08
5%
5%
5%
3%
Exhibit 12: Bangalore park footfall trends
Bangalore Footfalls (m)
28%
1.19
0.92
18%
1.13
6%
YoY Growth
1.25
1.29
1.36
3%
-9%
-1%
FY09 FY10 FY11 FY12 FY13 FY14 FY15 FY16E FY17E
Source: Company, MOSL
FY09 FY10 FY11 FY12 FY13 FY14 FY15 FY16E FY17E
Source: Company, MOSL
Exhibit 13: Average ticket realization in Kochi park
Average Ticket Realisation Kochi (INR)
14%
10%
3%
298
327
383
336
423
10%
17%
13%
656
YoY Growth
18%
Exhibit 14: Average ticket realization in Bangalore park
Average Ticket Realisation Bangalore (INR)
12%
YoY Growth
16%
11%
10%
4%
437
-3%
423
440
489
545
598
672
11%
10%
10%
780
859
477
556
723
FY09 FY10 FY11 FY12 FY13 FY14 FY15 FY16E FY17E
Source: Company, MOSL
FY09 FY10 FY11 FY12 FY13 FY14 FY15 FY16E FY17E
Source: Company, MOSL
27 October 2015
7

Wonderla Holidays
Financials and valuations
Standalone - Income Statement
Y/E March
Total Income from Operations
Change (%)
EBITDA
Margin (%)
Depreciation
EBIT
Int. and Finance Charges
Other Income
PBT bef. EO Exp.
EO Expense/(Income)
PBT after EO Exp.
Current Tax
Deferred Tax
Tax Rate (%)
Less: Mionrity Interest
Reported PAT
Adjusted PAT
Change (%)
Margin (%)
FY11
896
30.2
459
51.2
118
341
0
124
465
0
465
124
4
27.6
0
337
337
122.1
37.6
FY12
1,131
26.2
558
49.3
116
442
0
14
456
0
456
146
-2
31.6
0
312
312
-7.4
27.6
FY13
1,378
21.9
625
45.4
119
507
22
15
500
0
500
163
1
32.8
0
336
336
7.8
24.4
FY14
1,536
11.4
703
45.8
132
571
16
24
579
0
579
184
-3
31.1
0
399
399
18.7
26.0
FY15
1,819
18.4
805
44.3
162
643
17
102
729
0
729
246
-23
30.6
0
506
506
26.9
27.8
FY16E
2,128
17.0
904
42.5
189
715
17
190
888
0
888
284
0
32.0
0
604
604
19.4
28.4
(INR Million)
FY17E
3,235
52.1
1,310
40.5
287
1,024
22
152
1,154
0
1,154
369
0
32.0
0
785
785
30.0
24.3
Standalone - Balance Sheet
Y/E March
Equity Share Capital
Preference Capital
Total Reserves
Net Worth
Minority Interest
Deferred Liabilities
Total Loans
Capital Employed
Gross Block
Less: Accum. Deprn.
Net Fixed Assets
Goodwill on Consolidation
Capital WIP
Total Investments
Curr. Assets, Loans&Adv.
Inventory
Account Receivables
Cash and Bank Balance
Loans and Advances
Curr. Liability & Prov.
Account Payables
Other Current Liabilities
Provisions
Net Current Assets
Deferred Tax assets
Misc Expenditure
Appl. of Funds
FY11
420
0
290
710
0
36
168
915
1,685
755
931
0
77
0
57
15
3
3
37
150
44
10
96
-93
0
0
914
FY12
420
0
518
938
0
34
216
1,188
2,078
868
1,210
0
44
0
143
18
2
25
98
208
97
8
104
-65
0
0
1,189
FY13
420
0
780
1,200
0
37
210
1,446
2,420
981
1,440
0
57
0
163
28
5
29
102
213
86
0
128
-50
0
0
1,447
FY14
420
0
1,079
1,499
0
33
239
1,772
2,553
1,099
1,455
0
201
0
348
33
3
200
111
231
90
0
141
116
0
0
1,772
FY15
565
0
2,999
3,564
0
-11
151
3,705
2,695
1,302
1,394
0
398
1,943
232
41
5
83
102
261
91
0
169
-29
0
0
3,705
FY16E
565
0
3,471
4,036
0
-11
250
4,275
4,175
1,491
2,685
0
43
1,500
354
47
6
121
118
307
103
0
203
48
0
0
4,275
(INR Million)
FY17E
565
0
4,090
4,655
0
-11
250
4,894
5,375
1,777
3,598
0
65
1,000
656
82
9
367
136
425
181
0
244
231
0
0
4,894
27 October 2015
8

Wonderla Holidays
Financials and valuations
Ratios
Y/E Mar
Basic (INR)
EPS
Cash EPS
BV/Share
DPS
Payout (%)
Valuation (x)
P/E
Cash P/E
P/BV
EV/Sales
EV/EBITDA
Dividend Yield (%)
FCF per share
Return Ratios (%)
RoE
RoCE
Working Capital Ratios
Asset Turnover (x)
Inventory (Days)
Debtor (Days)
Creditor (Days)
Working Capital Turnover (Days)
Leverage Ratio (x)
Debt/Equity
FY11
8.0
10.8
16.9
1.5
21.7
FY12
7.4
10.2
22.3
1.5
23.5
FY13
8.0
10.8
28.6
1.5
21.9
FY14
9.5
12.6
35.7
2.0
24.9
FY15
9.0
11.8
63.1
1.5
19.7
35.2
26.7
5.0
9.8
22.2
0.5
3.4
56.3
50.5
1.0
5.9
1
18
-39
0.2
37.8
44.8
1.0
5.9
1
31.1
-29
0.2
31.4
40.7
1.0
7.4
1
22.8
-21
0.2
29.6
37.8
0.9
7.9
1
21.4
-20
0.2
20.0
27.4
0.5
8.2
1
18.3
-22
0.0
FY16E
10.7
14.0
71.4
2.0
22.0
29.5
22.5
4.4
8.4
19.8
0.6
-5.2
15.9
22.6
0.5
8.1
1.0
17.7
-13
0.1
FY17E
13.9
19.0
82.4
2.5
21.1
22.7
16.6
3.8
5.5
13.5
0.8
-1.2
18.1
25.6
0.7
9.3
1.0
20.4
-15
0.1
Standalone - Cash Flow Statement
Y/E March
NP / (Loss) Before Tax and EO Items
Depreciation
Interest & Finance Charges
Direct Taxes Paid
(Inc)/Dec in WC
CF from Operations
Others
CF from Operating incl EO
(inc)/dec in FA
Free Cash Flow
(Pur)/Sale of Investments
Others
CF from Investments
Issue of Shares
(Inc)/Dec in Debt
Interest Paid
Dividend Paid
Others
CF from Fin. Activity
Inc/Dec of Cash
Add: Beginning Balance
Closing Balance
FY11
426
118
39
-108
-33
442
-114
328
50
378
0
7
56
0
-303
-41
-49
0
-392
-8
11
3
FY12
445
116
11
-139
18
451
-4
447
-392
55
0
4
-388
0
46
-11
-73
0
-37
22
3
25
FY13
500
119
22
-151
-2
488
-2
486
-374
112
0
3
-371
0
-15
-23
-73
0
-111
4
25
29
FY14
579
132
14
-198
-19
508
-6
502
-270
232
0
11
-259
0
29
-27
-74
0
-71
172
29
200
FY15
729
162
13
-252
-23
630
-67
562
-369
193
-1,943
77
-2,235
1,700
-88
-21
-99
0
1,493
-179
200
21
FY16E
888
189
17
-284
24
834
0
834
-1,125
-291
443
0
-682
0
99
-17
-133
0
-51
101
21
121
(INR Million)
FY17E
1,154
287
22
-369
62
1,155
0
1,155
-1,222
-67
500
0
-722
0
0
-22
-166
0
-187
246
121
367
27 October 2015
9

Wonderla Holidays
Corporate profile: Wonderla Holidays
Company description
Wonderla Holidays (WONH) is one of the largest
operators of amusement parks in India, which
owns and operates two parks under the brand
name “Wonderla”, situated at Kochi and Bangalore.
In FY14, it had a cumulative annual footfall of 2.3m.
WONH raised INR1.8b through an IPO to set up its
third park in Hyderabad, which is awaiting the final
stages of approval. Company has also developed
the Wonderla Resort in Bangalore, a Three Star
leisure resort, next to its amusement park,
comprising of 84 luxury rooms
Exhibit 15: Sensex rebased
Exhibit 16: Shareholding pattern (%)
Jun-15
Promoter
DII
FII
Others
71.0
2.0
9.1
17.9
Mar-15
71.0
1.9
8.9
18.2
Jun-14
71.0
8.3
2.1
18.6
Exhibit 17: Top holders
Holder Name
Il And Fs Trust Company Limited
Handelsbankens Tillvaxtmarknadsfond
Dnb Fund A/C Dnb Fund - Asian Small Cap
Aditya Birla Private Equity Trust
Steinberg India Emerging Opportunities Fund Limited
% Holding
2.3
1.8
1.6
1.5
1.1
Note: FII Includes depository receipts
Exhibit 18: Top management
Name
George Joseph
Kochouseph Chittilappilly
Arun Kochouseph Chittilappilly
Designation
Chairman
Vice Chairman
Managing Director
Exhibit 19: Directors
Name
George Joseph*
Kochouseph Chittilappilly
Arun Kochouseph Chittilappilly
Name
M P Ramachandran*
Priya Sarah Cheeran Joseph
*Independent
Exhibit 20: Auditors
Name
BSR & Co LLP
Somy Jacab & Associates
Type
Statutory
Secretarial Audit
Exhibit 21: MOSL forecast v/s consensus
EPS (INR)
FY16
FY17
MOSL
forecast
9.6
13.3
Consensus
forecast
-
-
Variation (%)
-
-
27 October 2015
10

WONDERLA GALLERY
WONDERLA
OTHER COMPANIES
OTHER COMPANIES

Wonderla Holidays
NOTES
27 October 2015
12

This document has been prepared by Motilal Oswal Securities Limited (hereinafter referred to as Most) to provide information about the company(ies) and/sector(s), if any, covered in
Wonderla
may be distributed
the report and
Holidays
by it and/or its affiliated company(ies). This report is for personal information of the selected recipient/s and does not construe to be any investment, legal or taxation advice to you. This research report does not
constitute an offer, invitation or inducement to invest in securities or other investments and Motilal Oswal Securities Limited (hereinafter referred as MOSt) is not soliciting any action based upon it. This report is not for
public distribution and has been furnished to you solely for your general information and should not be reproduced or redistributed to any other person in any form. This report does not constitute a personal
recommendation or take into account the particular investment objectives, financial situations, or needs of individual clients. Before acting on any advice or recommendation in this material, investors should consider
whether it is suitable for their particular circumstances and, if necessary, seek professional advice. The price and value of the investments referred to in this material and the income from them may go down as well as
up, and investors may realize losses on any investments. Past performance is not a guide for future performance, future returns are not guaranteed and a loss of original capital may occur.
MOSt and its affiliates are a full-service, integrated investment banking, investment management, brokerage and financing group. We and our affiliates have investment banking and other business relationships with a
some companies covered by our Research Department. Our research professionals may provide input into our investment banking and other business selection processes. Investors should assume that MOSt and/or
its affiliates are seeking or will seek investment banking or other business from the company or companies that are the subject of this material and that the research professionals who were involved in preparing this
material may educate investors on investments in such business. The research professionals responsible for the preparation of this document may interact with trading desk personnel, sales personnel and other
parties for the purpose of gathering, applying and interpreting information. Our research professionals are paid on the profitability of MOSt which may include earnings from investment banking and other business.
MOSt generally prohibits its analysts, persons reporting to analysts, and members of their households from maintaining a financial interest in the securities or derivatives of any companies that the analysts cover.
Additionally, MOSt generally prohibits its analysts and persons reporting to analysts from serving as an officer, director, or advisory board member of any companies that the analysts cover. Our salespeople, traders,
and other professionals or affiliates may provide oral or written market commentary or trading strategies to our clients that reflect opinions that are contrary to the opinions expressed herein, and our proprietary
trading and investing businesses may make investment decisions that are inconsistent with the recommendations expressed herein. In reviewing these materials, you should be aware that any or all of the foregoing
among other things, may give rise to real or potential conflicts of interest. MOSt and its affiliated company(ies), their directors and employees and their relatives may; (a) from time to time, have a long or short position
in, act as principal in, and buy or sell the securities or derivatives thereof of companies mentioned herein. (b) be engaged in any other transaction involving such securities and earn brokerage or other compensation
or act as a market maker in the financial instruments of the company(ies) discussed herein or act as an advisor or lender/borrower to such company(ies) or may have any other potential conflict of interests with
respect to any recommendation and other related information and opinions.; however the same shall have no bearing whatsoever on the specific recommendations made by the analyst(s), as the recommendations
made by the analyst(s) are completely independent of the views of the affiliates of MOSt even though there might exist an inherent conflict of interest in some of the stocks mentioned in the research report
Reports based on technical and derivative analysis center on studying charts company's price movement, outstanding positions and trading volume, as opposed to focusing on a company's fundamentals and, as
such, may not match with a report on a company's fundamental analysis. In addition MOST has different business segments / Divisions with independent research separated by Chinese walls catering to different set
of customers having various objectives, risk profiles, investment horizon, etc, and therefore may at times have different contrary views on stocks sectors and markets.
Unauthorized disclosure, use, dissemination or copying (either whole or partial) of this information, is prohibited. The person accessing this information specifically agrees to exempt MOSt or any of its affiliates or
employees from, any and all responsibility/liability arising from such misuse and agrees not to hold MOSt or any of its affiliates or employees responsible for any such misuse and further agrees to hold MOSt or any of
its affiliates or employees free and harmless from all losses, costs, damages, expenses that may be suffered by the person accessing this information due to any errors and delays. The information contained herein is
based on publicly available data or other sources believed to be reliable. Any statements contained in this report attributed to a third party represent MOSt’s interpretation of the data, information and/or opinions
provided by that third party either publicly or through a subscription service, and such use and interpretation have not been reviewed by the third party. This Report is not intended to be a complete statement or
summary of the securities, markets or developments referred to in the document. While we would endeavor to update the information herein on reasonable basis, MOSt and/or its affiliates are under no obligation to
update the information. Also there may be regulatory, compliance, or other reasons that may prevent MOSt and/or its affiliates from doing so. MOSt or any of its affiliates or employees shall not be in any way
responsible and liable for any loss or damage that may arise to any person from any inadvertent error in the information contained in this report. MOSt or any of its affiliates or employees do not provide, at any time,
any express or implied warranty of any kind, regarding any matter pertaining to this report, including without limitation the implied warranties of merchantability, fitness for a particular purpose, and non-infringement.
The recipients of this report should rely on their own investigations.
This report is intended for distribution to institutional investors. Recipients who are not institutional investors should seek advice of their independent financial advisor prior to taking any investment decision based on
this report or for any necessary explanation of its contents.
Most and it’s associates may have managed or co-managed public offering of securities, may have received compensation for investment banking or merchant banking or brokerage services, may have received any
compensation for products or services other than investment banking or merchant banking or brokerage services from the subject company in the past 12 months.
Most and it’s associates have not received any compensation or other benefits from the subject company or third party in connection with the research report.
Subject Company may have been a client of Most or its associates during twelve months preceding the date of distribution of the research report
MOSt and/or its affiliates and/or employees may have interests/positions, financial or otherwise of over 1 % at the end of the month immediately preceding the date of publication of the research in the securities
mentioned in this report. To enhance transparency, MOSt has incorporated a Disclosure of Interest Statement in this document. This should, however, not be treated as endorsement of the views expressed in the
report.
Motilal Oswal Securities Limited is registered as a Research Analyst under SEBI (Research Analyst) Regulations, 2014. SEBI Reg. No. INH000000412
There are no material disciplinary action that been taken by any regulatory authority impacting equity research analysis activities
Analyst Certification
The views expressed in this research report accurately reflect the personal views of the analyst(s) about the subject securities or issues, and no part of the compensation of the research analyst(s) was, is, or will be
directly or indirectly related to the specific recommendations and views expressed by research analyst(s) in this report. The research analysts, strategists, or research associates principally responsible for preparation
of MOSt research receive compensation based upon various factors, including quality of research, investor client feedback, stock picking, competitive factors and firm revenues
Disclosure of Interest Statement
Analyst ownership of the stock
Served as an officer, director or employee
WONDERLA HOLIDAYS LTD
No
No
Disclosures
A graph of daily closing prices of securities is available at www.nseindia.com and http://economictimes.indiatimes.com/markets/stocks/stock-quotes
Regional Disclosures (outside India)
For U.S.
This report is not directed or intended for distribution to or use by any person or entity resident in a state, country or any jurisdiction, where such distribution, publication, availability or use would be contrary to law,
regulation or which would subject MOSt & its group companies to registration or licensing requirements within such jurisdictions.
Motilal Oswal Securities Limited (MOSL) is not a registered broker - dealer under the U.S. Securities Exchange Act of 1934, as amended (the"1934 act") and under applicable state laws in the United States. In
addition MOSL is not a registered investment adviser under the U.S. Investment Advisers Act of 1940, as amended (the "Advisers Act" and together with the 1934 Act, the "Acts), and under applicable state laws in the
United States. Accordingly, in the absence of specific exemption under the Acts, any brokerage and investment services provided by MOSL, including the products and services described herein are not available to or
intended for U.S. persons.
This report is intended for distribution only to "Major Institutional Investors" as defined by Rule 15a-6(b)(4) of the Exchange Act and interpretations thereof by SEC (henceforth referred to as "major institutional
investors"). This document must not be acted on or relied on by persons who are not major institutional investors. Any investment or investment activity to which this document relates is only available to major
institutional investors and will be engaged in only with major institutional investors. In reliance on the exemption from registration provided by Rule 15a-6 of the U.S. Securities Exchange Act of 1934, as amended (the
"Exchange Act") and interpretations thereof by the U.S. Securities and Exchange Commission ("SEC") in order to conduct business with Institutional Investors based in the U.S., MOSL has entered into a chaperoning
agreement with a U.S. registered broker-dealer, Motilal Oswal Securities International Private Limited. ("MOSIPL"). Any business interaction pursuant to this report will have to be executed within the provisions of this
chaperoning agreement.
The Research Analysts contributing to the report may not be registered /qualified as research analyst with FINRA. Such research analyst may not be associated persons of the U.S. registered broker-dealer, MOSIPL,
and therefore, may not be subject to NASD rule 2711 and NYSE Rule 472 restrictions on communication with a subject company, public appearances and trading securities held by a research analyst account.
Motilal Oswal Capital Markets Singapore Pte Limited is acting as an exempt financial advisor under section 23(1)(f) of the Financial Advisers Act(FAA) read with regulation 17(1)(d) of the Financial Advisors
Regulations and is a subsidiary of Motilal Oswal Securities Limited in India. This research is distributed in Singapore by Motilal Oswal Capital Markets Singapore Pte Limited and it is only directed in Singapore to
accredited investors, as defined in the Financial Advisers Regulations and the Securities and Futures Act (Chapter 289), as amended from time to time.
In respect of any matter arising from or in connection with the research you could contact the following representatives of Motilal Oswal Capital Markets Singapore Pte Limited:
Kadambari Balachandran
Email : kadambari.balachandran@motilaloswal.com
Contact : (+65) 68189233 / 65249115
Office Address : 21 (Suite 31),16 Collyer Quay,Singapore 04931
For Singapore
27 October 2015
Motilal Oswal Tower, Level 9, Sayani Road, Prabhadevi, Mumbai 400 025
Phone: +91 22 3982 5500 E-mail: reports@motilaloswal.com
Motilal Oswal Securities Ltd
13