28 October 2015
3QCY15 Results Update | Sector: Cement
BSE SENSEX
27,226
Bloomberg
Equity Shares (m)
M.Cap. (INR b)/(USD b)
52-Week Range (INR)
1, 6, 12 Rel. Per (%)
Avg Val(INR m)
Free float (%)
S&P CNX
8,240
ACEM IN
1,983.2
323.5/5.0
287/192
-4/-11/-7
478
49.7
Ambuja Cements
CMP: INR209
TP: INR245 (+18%)
Upgrade to buy
Operations in line; valuation comfort improves; upgrade to Buy
Financials & Valuation (INR Billion)
Y/E Dec
2015 2016E 2017E
Sales
EBITDA
NP
94.9 108.3 127.5
15.3 21.7 30.4
9.5 14.9 21.0
7.5 10.6
22.6 41.2
96.6 102.9
10.1 10.6
14.1 15.1
57.6 40.3
16.6
1.3
12.2
134
11.8
1.2
8.4
123
Adj. EPS (INR)
6.1
EPS Gr. (%)
-28.3
BV/Sh. (INR)
66.1
RoE (%)
9.3
RoCE (%)
13.4
Payout (%)
92.4
Valuations
P/E (x)
34.1
P/BV (x)
3.2
EV/EBITDA (x) 17.9
EV/Ton (USD)
142
Estimate change
TP change
Rating change
-4-5%
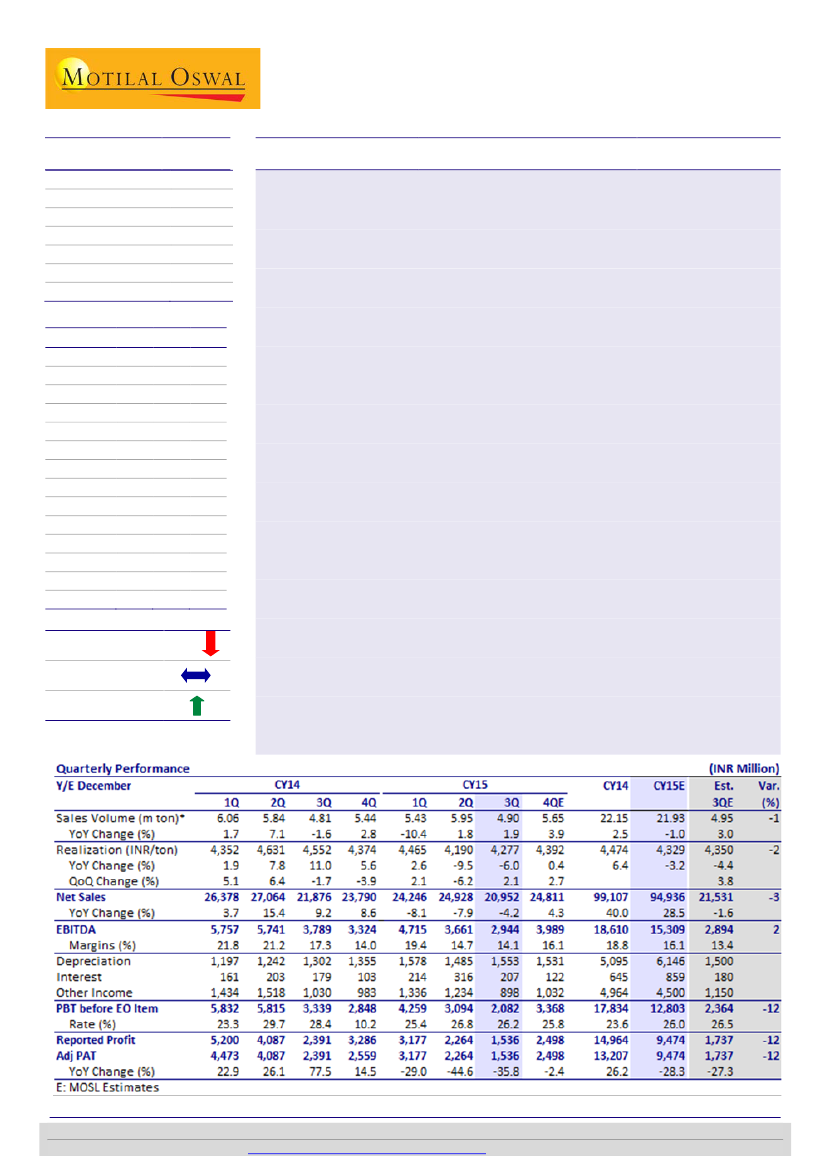
Volume growth dichotomy declined:
ACEM’s 3QCY15 revenue was marginally
below estimate at INR20.9b (-4.2% YoY). Volume growth was in line at 4.9mt
(+2% YoY v/s UTCEM at +4% YoY). Uptick in realizations (+2% QoQ) was below
expectation and was largely contributed by north and west.
Cost moderation boosts EBITDA (in line):
EBITDA de-grew 22% YoY to
~INR2.94b (in line), translating into EBITDA margin of 14.1% (-3.2pp QoQ and -
0.6pp YoY). Lower uptick in realizations was offset by cost savings in RM and
other expenses (decline in gypsum and packaging cost) and moderation in
freight cost (benefits of softening diesel price). PAT was down 35.8% YoY to
INR1.53b (v/s est. of INR1.73b), led by lower other income.
DMF-adjusted EBITDA up 7% QoQ:
EBITDA/ton stood at INR601 (v/s est. of
INR585). In 3QCY15, ACEM provided for DMF of INR82/ton (including prior
period impact of INR55/ton); adjusted for the same, EBITDA/ton stood at
INR656 (-17% YoY, +7% QoQ).
Valuation comfort improves; upgrade to Buy
ACEM corrected 27% from the peak versus average correction of 13% in large
caps, led by muted earnings (weak north and west) and elusive timeline over
corporate restructuring.
We expect ACEM to lag volume growth leaders due to limited expansion, but
profitability is likely to normalize on the back of better pricing and demand
outlook in north and west (Gujarat). While there is little clarity on timeline and
form of restructuring (with ACC and Lafarge) at present, ACEM will be
considered on its strength (strong B/S, cost leadership, and healthy capital
efficiency) once it is resolved.
Post the recent corrections, valuation comfort in ACEM is higher than peers.
ACEM at 10.9x 1-year forward EV/EBITDA is 12% below the 5-year average.
EV/ton basis is at USD130/ton—11% discount to 5-year average (only large cap
trading below the 5-year average EV/EBITDA). We value ACEM at USD160/ton
(10x CY17E EV/EBITDA) at INR245/share (18% upside). Upgrade to
Buy.
Sandipan Pal
(Sandipan.Pal@MotilalOswal.com); +91 22 3982 5436
Investors are advised to refer through disclosures made at the end of the Research Report.
Motilal Oswal research is available on
www.motilaloswal.com/Institutional-Equities,
Bloomberg, Thomson Reuters, Factset and S&P Capital.

Ambuja Cements
Volume, realizations marginally below
ACEM’s 3QCY15 cement volume grew 1.9% YoY (-18% QoQ) at 4.90mt (v/s est of
3% YoY growth). Realizations were below expectation with 2.1% QoQ (-6% YoY)
to INR4,277/ton v/s est of 3.8% QoQ.
Growth in realizations was led by sharp QoQ price improvement in north and
moderate uptick in west in August and September, albeit the quantum of
realizations improvement lagged price trends.
Net sales de-grew by 4.2% YoY (-16% QoQ) to INR20.9b (v/s INR21.5b).
Cost moderation boost EBITDA; EBITDA/ton up 7% QoQ
EBITDA de-grew 22% YoY (-20% QoQ) to ~INR2.94b (in line with est), translating
into EBITDA margin of 14.1% (-3.2pp QoQ and -0.6pp YoY) v/s est of 13.4%.
EBITDA/ton stood at INR601 (v/s est of INR 585). In 3QCY15, ACEM provided for
DMF of INR82/ton (including prior period impact of INR55/ton). Adjusted for the
same, EBITDA/ton stood at INR656 (-17% YoY, +7% QoQ)
While realizations uptick disappoints, lower RM and other expenses (ex DMF
impact) driven by further sequential dip in packaging and gypsum cost and
moderation in freight cost (benefits of softening diesel price) resulted into beat
in profitability.
PAT down 35.8% YoY to INR1.53b (v/s est of INR1.73b), led by lower other
income.
Exhibit 2:
Margins dipped, but better than expectation
EBITDA (INR m)
28.4 28.2
26.2
EBITDA Margin (%)
Exhibit 1:
Volumes and realizations marginally below est
Volume (MT)
Net Realization (INR/ton)
21.0
21.821.2
19.4
18.5 20.1
17.3
14.714.1
14.0
12.6 13.2
6.2 5.6 4.8 5.4 6.0 5.5 4.9 5.3 6.1 5.8 4.8 5.4 5.4 6.0 4.9
Source: Company, MOSL
Exhibit 3: DMF-adjusted EBITDA at INR655/ton, driven by lower cost
EBITDA (INR/Ton)
Source: Company, MOSL
28 October 2015
2

Ambuja Cements
Exhibit 4: Income statement (INR/ton)
3QCY15
Net Realization
Raw Material
Staff Cost
Power & Fuel
Freight
Other exp
Total Cost
EBITDA
4,277
222
309
992
1,131
1,021
3,676
601
3QCY14
4,552
309
296
1,061
1,141
956
3,763
788
YoY (%)
-8.0
-3.2
-14.8
-7.4
5.3
-12.3
-5.0
-22.0
2QCY15
4,190
300
252
982
1,202
838
3,574
615
QoQ (%)
2.1
-25.7
22.5
1.0
-5.9
21.8
2.8
-2.3
Source: MOSL, Company
Other updates and management outlook
In 3QCY15, ACEM commissioned waste heat recovery system of 6.5MW in
Rabriyawas unit in Rajasthan.
Management outlook on demand remains positive with government’s focus on
housing, concrete road, and infrastructure development.
EBITDA largely intact; cutting EPS by 4-5% due to lower other income
We are cutting EPS for CY15 by 5-6%, to factor in for lower other income;
EBITDA estimates remain unchanged.
We factor in for 4% volume CAGR and 7% realizations CAGR in CY15-17.
Exhibit 5: Revised estimates
(INR b)
Volumes (MT)
Realizations (INR/Ton)
Net Sales
EBITDA (INR/Ton)
Net Profit
Rev
21.9
4,329
94.9
698
9.5
CY15E
Old
22.0
4,379
96.5
710
10.0
Chg (%)
-0.5
-1.1
-1.6
-1.7
-5.2
Rev
23.2
4,659
108.3
933
14.9
CY16E
Old
23.4
4,779
111.7
955
15.5
Chg (%)
-0.5
-2.5
-3.0
-2.0
-4.1
Source: MOSL
Exhibit 6: Cost Analysis (INR/ton)
CY14
Cost Analysis (INR/ton)
Realization
Raw Material
Staff Cost
Power & fuel
Freight
Other expenditure
Total Cost per ton
EBITDA
1Q
4,352
433
213
954
1,088
714
3,402
950
2Q
4,631
298
241
1,068
1,165
876
3,649
982
3Q
4,552
309
296
1,061
1,141
956
3,763
788
4Q
4,374
488
311
1,017
1,032
915
3,763
611
1Q
4,465
391
273
989
1,143
802
3,597
868
2Q
4,190
300
252
982
1,202
838
3,574
615
CY15
3Q
4,277
222
309
992
1,131
1,021
3,676
601
4QE
4,392
383
306
974
1,143
881
3,686
706
Source: MOSL, Company
28 October 2015
3

Ambuja Cements
Valuation discount offers comfort; Upgrade to buy
Stock posted massive underperformance
ACEM corrected 27% from the peak of March-15 v/s average correction in large
caps of 13%. Reasons are (a) market share loss (delayed expansion), (b)
demand-pricing weakness in north & west regions and no benefits of south price
increase (ACEM’s market mix in north & west is 78% v/s 60% for ACC and
UTCEM ) and (c) delay in restructuring process – awaits FIPB clearance, along
with new MMDR act pushing back divestment time line of Lafarge assets.
Factoring in sub-normal volume growth, but profitability to normalize
We expect ACEM to underperform growth volume due to limited expansion.
However, better utilization headroom in faster growing regions viz. north and
east (60-70% which is lower than regional utilizations) should offer resilience.
Volume underperformance (v/s UTCEM) has reduced in recent quarters with
better growth in key operating region viz. north, east and Gujarat. Nonetheless,
we factor in for 4% CAGR in volume over FY15-18 v/s 10% for UTCEM. Due to
better demand outlook, we expect north and Gujarat to post stronger
realization growth, aiding normalization of profitability for ACEM with peers
Exhibit 7:
Growth gap (%) contracted in recent quarters
23%
15%
8%
0%
-8%
-15%
Ambuja
UTCEM
Source: Company, MOSL
Core strength intact, could emerge stronger once overhangs eases
ACEM has historically generated superior RoCE due to better capital discipline
(lower plough back) and top quartile EBITDA/ton. Cost efficiency is still one of
the best among peers. ACEM’s balance sheet strength with ~INR45b of net cash
(net cash even after INR35b payment for restructuring) and annual OCF visibility
of INR15-30b over CY15-17, offer comforts on future scalability.
While there is little clarity on the timelines and form of the restructuring (with
ACC and Lafarge), but once it is resolved, ACEM will be considered on its
strength. Group consolidation will lead synergy benefits (via cement-clinker
swaps, market segmentations, marketing team alliance, supply chain
management and fixed cost rationalizations). Management earlier guided for
INR7-9b synergies between ACC-ACEM
(not factored in estimates).
28 October 2015
4

Ambuja Cements
Upgrade to buy
Post recent corrections, valuation comfort in ACEM are higher compared to
peers. ACEM at 10.9x one year forward EV/EBITDA is 12% below 5-years (v/s
UTCEM and ACC at 13-14.5x 1-year forward EV/EBITDA). EV/ton basis, ACEM
trades at US$130/ton, 11% discount to 5-years’ average and ~30% discount to
UTCEM – Only large cap trading below 5-years average EV/EBITDA. We value
ACEM at US$160/ton (10x CY17E EV/EBITDA) at INR245/share (18% upside).
Upgrade to buy.
Exhibit 8:
Comparative EV/EBITDA (x) 1 –years forward
3-Year Avg
5-Year Avg
10-Year Avg
Current multiple
22
Exhibit 9:
1-yr forward EV/ton (US$)
3-Year Avg
5-Year Avg
10-Year Avg
180
146
117
104
Current
196
16
15
10
14
13
12
9
14
11
13
9
15
14
12
7
SRCM
ACC
117117116
107
152147145
132
168
151
126
ACC
ACEM
UltraTech
ACEM
UltraTech
SRCM
Source: Company, MOSL
28 October 2015
5

Ambuja Cements
Story in charts
Exhibit 10: Growth
expansion
Capacity (MT)
95
75
18
19
25
19
25
20
27
21
28
22
81
78
79
75
29
75
30
74
30
76
30
79
to
underperform
Dispatches (MT)
due
to
limited
Exhibit 11: Expect better realizations in north-west to
benefit
28.4
EBITDA (INR b)
26.4
24.7
22.8
Margin (%)
23.8
Cap. Util (%)
25.5
20.0
18.8
17.0
16.1
24.7
21.7
15.5 18.6 15.3
22
22
22
23
32
30.4
25
17.6 18.7 18.2 19.4
CY08 CY09 CY10 CY11 CY12 CY13 CY14 CY15E CY16E CY17E
Source: Company, MOSL
CY08 CY09 CY10 CY11 CY12 CY13 CY14 CY15E CY16E CY17E
Source: Company, MOSL
Exhibit 12: EBITDA/ton has upside potential from synergies
EBITDA/ton
Exhibit 13: Trend in EPS
EPS (INR)
8.1
8.2
10.0
6.8
22.4
-32.4
EPS Growth (%)
8.5
25.9
6.1
7.5
10.6
41.2
22.6
7.6
7.8
0.0
2.1
4.3
0.6
-28.3
CY08 CY09 CY10 CY11 CY12 CY13 CY14 CY15E CY16E CY17E
Source: Company, MOSL
Exhibit 14: High mix of north and west
Exports
Central 3%
South 2%
2%
North
37%
Exhibit 15: B/S strength to address cash outgo on merger
CFO (INR m)
CAPEX (INR m)
14
11
17
9
13
22
19
12
8
17
6
21
7
14
9
9
19
14
7
7
16
9
23
12
30
11
FCF (INR m)
19
11
West
38%
East
18%
Source: Company, MOSL
-3
12
CY08 CY09 CY10 CY11 CY12 CY13 CY14E CY15E CY16E CY17E
Source: Company, MOSL
28 October 2015
6

Ambuja Cements
Financials and valuations
Income Statement (INR Million)
)Y/E December
Net Sales
Change (%)
Total Expenditure
% of Sales
EBITDA
Change (%)
Margin (%)
Depreciation
EBIT
Interest
Other Income - Rec.
PBT before EO Exp.
EO Exp/(Inc)
PBT after EO Exp.
Current Tax
Deferred Tax
Tax Rate (%)
Reported PAT
PAT Adj for EO Items
Change (%)
Balance Sheet
Y/E December
Equity Share Capital
Total Reserves
Net Worth
Def. Liabilities
Total Loans
Capital Employed
Gross Block
Less: Accum. Depn.
Net Fixed Assets
Capital WIP
Investments
Curr. Assets
Inventory
Debtors
Cash & Bank Bal
Others
Curr. Liability & Prov.
Creditors
Provisions
Net Current Assets
Appl. of Funds
E: MOSL Estimates
2011
85,043
15.1
65,656
77.2
19,387
6.3
22.8
4,452
14,935
526
2,978
17,387
358
17,029
3,613
1,127
27.8
12,289
12,547
0.9
2011
3,069
77,626
80,694
6,436
466
87,597
97,023
35,158
61,865
4,868
8,643
40,043
9,250
2,409
20,691
7,694
27,822
15,909
11,913
12,221
87,597
2012
96,749
13.8
72,074
74.5
24,675
27.3
25.5
5,373
19,302
757
4,042
22,588
3,570
19,018
6,048
0
31.8
12,971
15,435
23.0
2012
3,084
84,966
88,051
5,483
395
93,929
101,836
43,213
58,624
5,201
16,558
43,864
9,839
2,134
22,537
9,353
30,318
15,904
14,414
13,545
93,929
2013
90,868
-6.1
75,386
83.0
15,482
-37.3
17.0
4,901
10,581
651
4,349
14,280
-3,269
17,549
4,603
0
26.2
12,946
10,464
-32.2
2013
3,092
91,764
94,855
5,643
292
100,790
108,262
47,637
60,625
6,949
17,885
44,187
9,339
2,315
23,411
9,122
28,856
17,845
11,011
15,332
100,790
2014
99,107
9.1
80,497
81.2
18,610
20.2
18.8
5,095
13,515
645
4,964
17,834
-1,757
19,591
4,627
0
23.6
14,964
13,207
26.2
2014
3,100
97,934
101,033
5,890
191
107,115
118,711
52,732
64,173
5,000
21,727
48,108
8,884
2,280
24,581
12,364
31,894
19,806
12,088
16,215
107,115
2015E
94,936
-4.2
79,628
83.9
15,309
-17.7
16.1
6,146
9,162
859
4,500
12,803
0
12,803
3,073
256
26.0
9,474
9,474
-28.3
2015E
3,100
98,653
101,752
6,146
191
108,090
124,711
58,878
65,832
6,000
20,727
48,043
9,884
2,471
23,204
12,485
32,513
20,289
12,225
15,530
108,090
2016E
108,303
14.1
86,610
80.0
21,693
41.7
20.0
6,108
15,585
691
5,200
20,094
0
20,094
5,024
201
26.0
14,870
14,870
56.9
2016E
3,966
186,873
190,839
6,347
500
197,686
135,211
64,986
70,224
7,500
118,572
36,098
10,385
2,522
10,729
12,462
34,708
21,356
13,352
1,390
197,686
2017E
127,511
17.7
97,153
76.2
30,358
39.9
23.8
6,338
24,020
850
6,000
29,170
0
29,170
7,584
583
28.0
21,002
21,002
41.2
2017E
3,966
199,409
203,375
6,931
500
210,806
146,461
71,324
75,137
7,500
118,572
49,273
10,480
2,969
20,802
15,022
39,676
23,956
15,721
9,597
210,806
28 October 2015
7

Ambuja Cements
Financials and valuations
Ratios
Y/E December
Basic (INR)
EPS
Cash EPS
BV/Share
DPS
Payout (%)
Valuation (x)
P/E
Cash P/E
P/BV
EV/Sales
EV/EBITDA
EV/Ton (Cap) - US$
Dividend Yield (%)
Return Ratios (%)
RoE
RoCE
Working Capital Ratios
Asset Turnover (x)
Debtor (Days)
Inventory (Days)
Work Cap (Days)
Leverage Ratio (x)
Current Ratio
Debt/Equity
Cash Flow Statement
Y/E December
Op. Profit before Tax
Interest/Div. Recd.
Direct Taxes Paid
(Inc)/Dec in WC
CF from Operations
EO Income
CF from Op. incl EO Exp
(inc)/dec in FA
Free Cash Flow
(Pur)/Sale of Invest.
CF from Investments
Issue of Shares
(Inc)/Dec in Debt
Interest Paid
Dividend Paid
CF from Fin. Activity
Inc/Dec of Cash
Add: Beginning Bal.
Closing Balance
E: MOSL Estimates
2011
8.2
11.1
53.0
3.2
46.4
2012
10.0
13.5
57.5
3.6
49.5
2013
6.8
9.9
61.8
3.6
49.9
2014
8.5
11.8
65.6
5.0
61.8
2015E
6.1
10.1
66.1
5.0
92.4
2016E
7.5
10.6
96.6
3.9
57.6
2017E
10.6
13.8
102.9
3.9
40.3
25.5
18.8
3.9
3.4
14.8
161
1.5
20.9
15.5
3.6
2.9
11.3
153
1.7
30.8
21.0
3.4
3.0
17.7
147
1.7
24.5
17.7
3.2
2.7
14.6
142
2.4
34.1
20.7
3.2
2.9
17.9
142
2.4
16.6
11.8
1.3
2.5
12.2
134
1.9
11.8
9.0
1.2
2.0
8.4
123
1.9
16.2
22.9
18.1
27.3
11.4
16.1
13.4
18.7
9.3
13.4
10.1
14.1
10.6
15.1
1.0
10
40
52
1.0
8
37
51
0.9
9
38
62
0.9
8
33
60
0.9
9.5
38
59.7
0.5
8.5
35
4.7
0.6
8.5
30
27.5
1.4
0.0
2011
20,260
1,555
-4,722
-203
16,890
0
16,890
-6,233
10,657
-1,700
-7,933
462
738
-251
-5,697
-4,748
4,209
16,482
20,690
1.4
0.0
2012
25,393
2,340
-6,399
-417
20,917
0
20,917
-6,870
14,047
-7,157
-14,027
831
-636
-275
-4,964
-5,044
1,846
20,691
22,537
1.5
0.0
2013
15,482
4,349
-4,603
-913
14,316
3,269
17,585
-8,650
8,935
-1,326
-9,976
322
57
-651
-6,462
-6,735
874
22,537
23,411
1.5
0.0
2014
18,610
4,964
-4,627
287
19,234
1,757
20,991
-6,694
14,297
-3,843
-10,537
455
147
-645
-9,241
-9,284
1,170
23,411
24,581
1.5
0.0
2015E
15,309
4,500
-3,329
-693
15,787
0
15,787
-8,806
6,981
1,000
-7,806
0
256
-859
-8,755
-9,358
-1,377
24,581
23,204
1.0
0.0
2016E
21,693
5,200
-5,225
1,665
23,334
0
23,334
-12,000
11,334
-97,845
-109,845
82,779
510
-691
-8,563
74,036
-12,475
23,204
10,729
1.2
0.0
2017E
30,358
6,000
-8,168
1,866
30,056
0
30,056
-11,250
18,806
0
-11,250
0
583
-850
-8,466
-8,733
10,073
10,729
20,802
28 October 2015
8

Ambuja Cements
Corporate profile
Company description
Ambuja Cement, a part of the Holcim group, is the
third largest cement company in India with total
capacity of 28.8mt under its control. It is one of the
lowest cost producers of cement, with focus on
structurally sound markets of North, West and East.
It is also the largest exporter of cement from India.
Exhibit 17: Sensex rebased
310
270
230
190
150
Oct-14
Jan-15
Apr-15
Jul-15
Oct-15
Ambuja Cements
Sensex
Source: MOSL/Bloomberg
Exhibit 18: Shareholding pattern (%)
Sep-15
Promoter
DII
FII
Others
50.3
29.1
12.8
7.9
Jun-15
50.3
28.4
13.6
7.8
Sep-14
50.4
31.6
10.1
8.0
Source: Capitaline
Exhibit 19: Top holders
Holder Name
Life Insurance Corporation Of India
Aberdeean Global Indian Equity ( Mautiritus)
Oppenheiner Developing Markets Find
Jpmorgan Sicav Investment Company (
Mauritius)
NA
Capitaline
% Holding
7.3
3.0
1.7
1.0
0.0
Source:
Note: FII Includes depository receipts
Exhibit 20: Top management
Name
N S Sekhsaria
Bernard Terver
Suresh Neotia
Ajay Kapur
Rajiv Gandhi
Designation
Chairman
Vice Chairman
Chairman Emeritus
Managing Director & CEO
Company Secretary
Exhibit 21: Directors
Name
Haigreve Khaitan
Omkar Goswami
Shailesh Haribhakti
Eric Olsen
Name
Nasser Munjee
Rajendra P Chitale
B L Taparia
Usha Sangwan
Source: Capitaline
*Independent
Exhibit 22: Auditors
Name
P M Nanabhoy & Co
S R B C & Co LLP
Type
Cost Auditor
Statutory
Exhibit 23: MOSL forecast v/s consensus
EPS
(INR)
FY15
FY16
FY17
MOSL
forecast
6.1
9.0
13.7
Consensus
forecast
7.8
10.1
12.1
Variation (%)
-21.8
-10.6
13.3
Source: Bloomberg
Source: Capitaline
28 October 2015
9

REPORT GALLERY
SECTOR UPDATES

Ambuja Cements
NOTES
28 October 2015
11

This document has been prepared by Motilal Oswal Securities Limited (hereinafter referred to as Most) to provide information about the company(ies) and/sector(s), if any, covered in the report and may be distributed by it and/or its
Ambuja Cements
affiliated company(ies). This report is for personal information of the selected recipient/s and does not construe to be any investment, legal or taxation advice to you. This research report does not constitute an offer, invitation or
inducement to invest in securities or other investments and Motilal Oswal Securities Limited (hereinafter referred as MOSt) is not soliciting any action based upon it. This report is not for public distribution and has been furnished to
you solely for your general information and should not be reproduced or redistributed to any other person in any form. This report does not constitute a personal recommendation or take into account the particular investment
objectives, financial situations, or needs of individual clients. Before acting on any advice or recommendation in this material, investors should consider whether it is suitable for their particular circumstances and, if necessary, seek
professional advice. The price and value of the investments referred to in this material and the income from them may go down as well as up, and investors may realize losses on any investments. Past performance is not a guide for
future performance, future returns are not guaranteed and a loss of original capital may occur.
MOSt and its affiliates are a full-service, integrated investment banking, investment management, brokerage and financing group. We and our affiliates have investment banking and other business relationships with a some
companies covered by our Research Department. Our research professionals may provide input into our investment banking and other business selection processes. Investors should assume that MOSt and/or its affiliates are
seeking or will seek investment banking or other business from the company or companies that are the subject of this material and that the research professionals who were involved in preparing this material may educate investors
on investments in such business. The research professionals responsible for the preparation of this document may interact with trading desk personnel, sales personnel and other parties for the purpose of gathering, applying and
interpreting information. Our research professionals are paid on the profitability of MOSt which may include earnings from investment banking and other business.
MOSt generally prohibits its analysts, persons reporting to analysts, and members of their households from maintaining a financial interest in the securities or derivatives of any companies that the analysts cover. Additionally, MOSt
generally prohibits its analysts and persons reporting to analysts from serving as an officer, director, or advisory board member of any companies that the analysts cover. Our salespeople, traders, and other professionals or affiliates
may provide oral or written market commentary or trading strategies to our clients that reflect opinions that are contrary to the opinions expressed herein, and our proprietary trading and investing businesses may make investment
decisions that are inconsistent with the recommendations expressed herein. In reviewing these materials, you should be aware that any or all of the foregoing among other things, may give rise to real or potential conflicts of interest.
MOSt and its affiliated company(ies), their directors and employees and their relatives may; (a) from time to time, have a long or short position in, act as principal in, and buy or sell the securities or derivatives thereof of companies
mentioned herein. (b) be engaged in any other transaction involving such securities and earn brokerage or other compensation or act as a market maker in the financial instruments of the company(ies) discussed herein or act as an
advisor or lender/borrower to such company(ies) or may have any other potential conflict of interests with respect to any recommendation and other related information and opinions.; however the same shall have no bearing
whatsoever on the specific recommendations made by the analyst(s), as the recommendations made by the analyst(s) are completely independent of the views of the affiliates of MOSt even though there might exist an inherent
conflict of interest in some of the stocks mentioned in the research report
Reports based on technical and derivative analysis center on studying charts company's price movement, outstanding positions and trading volume, as opposed to focusing on a company's fundamentals and, as such, may not match
with a report on a company's fundamental analysis. In addition MOST has different business segments / Divisions with independent research separated by Chinese walls catering to different set of customers having various objectives,
risk profiles, investment horizon, etc, and therefore may at times have different contrary views on stocks sectors and markets.
Unauthorized disclosure, use, dissemination or copying (either whole or partial) of this information, is prohibited. The person accessing this information specifically agrees to exempt MOSt or any of its affiliates or employees from, any
and all responsibility/liability arising from such misuse and agrees not to hold MOSt or any of its affiliates or employees responsible for any such misuse and further agrees to hold MOSt or any of its affiliates or employees free and
harmless from all losses, costs, damages, expenses that may be suffered by the person accessing this information due to any errors and delays. The information contained herein is based on publicly available data or other sources
believed to be reliable. Any statements contained in this report attributed to a third party represent MOSt’s interpretation of the data, information and/or opinions provided by that third party either publicly or through a subscription
service, and such use and interpretation have not been reviewed by the third party. This Report is not intended to be a complete statement or summary of the securities, markets or developments referred to in the document. While we
would endeavor to update the information herein on reasonable basis, MOSt and/or its affiliates are under no obligation to update the information. Also there may be regulatory, compliance, or other reasons that may prevent MOSt
and/or its affiliates from doing so. MOSt or any of its affiliates or employees shall not be in any way responsible and liable for any loss or damage that may arise to any person from any inadvertent error in the information contained in
this report. MOSt or any of its affiliates or employees do not provide, at any time, any express or implied warranty of any kind, regarding any matter pertaining to this report, including without limitation the implied warranties of
merchantability, fitness for a particular purpose, and non-infringement. The recipients of this report should rely on their own investigations.
This report is intended for distribution to institutional investors. Recipients who are not institutional investors should seek advice of their independent financial advisor prior to taking any investment decision based on this report or for
any necessary explanation of its contents.
Most and it’s associates may have managed or co-managed public offering of securities, may have received compensation for investment banking or merchant banking or brokerage services, may have received any compensation for
products or services other than investment banking or merchant banking or brokerage services from the subject company in the past 12 months.
Most and it’s associates have not received any compensation or other benefits from the subject company or third party in connection with the research report.
Subject Company may have been a client of Most or its associates during twelve months preceding the date of distribution of the research report
MOSt and/or its affiliates and/or employees may have interests/positions, financial or otherwise of over 1 % at the end of the month immediately preceding the date of publication of the research in the securities mentioned in this
report. To enhance transparency, MOSt has incorporated a Disclosure of Interest Statement in this document. This should, however, not be treated as endorsement of the views expressed in the report.
Motilal Oswal Securities Limited is registered as a Research Analyst under SEBI (Research Analyst) Regulations, 2014. SEBI Reg. No. INH000000412
There are no material disciplinary action that been taken by any regulatory authority impacting equity research analysis activities
The views expressed in this research report accurately reflect the personal views of the analyst(s) about the subject securities or issues, and no part of the compensation of the research analyst(s) was, is, or will be directly or
indirectly related to the specific recommendations and views expressed by research analyst(s) in this report. The research analysts, strategists, or research associates principally responsible for preparation of MOSt research receive
compensation based upon various factors, including quality of research, investor client feedback, stock picking, competitive factors and firm revenues
Disclosures
Analyst Certification
Disclosure of Interest Statement
Analyst ownership of the stock
Served as an officer, director or employee
AMBUJA CEMENT
No
No
A graph of daily closing prices of securities is available at www.nseindia.com and http://economictimes.indiatimes.com/markets/stocks/stock-quotes
Regional Disclosures (outside India)
For U.S.
This report is not directed or intended for distribution to or use by any person or entity resident in a state, country or any jurisdiction, where such distribution, publication, availability or use would be contrary to law, regulation or which
would subject MOSt & its group companies to registration or licensing requirements within such jurisdictions.
Motilal Oswal Securities Limited (MOSL) is not a registered broker - dealer under the U.S. Securities Exchange Act of 1934, as amended (the"1934 act") and under applicable state laws in the United States. In addition MOSL is not a
registered investment adviser under the U.S. Investment Advisers Act of 1940, as amended (the "Advisers Act" and together with the 1934 Act, the "Acts), and under applicable state laws in the United States. Accordingly, in the
absence of specific exemption under the Acts, any brokerage and investment services provided by MOSL, including the products and services described herein are not available to or intended for U.S. persons.
This report is intended for distribution only to "Major Institutional Investors" as defined by Rule 15a-6(b)(4) of the Exchange Act and interpretations thereof by SEC (henceforth referred to as "major institutional investors"). This
document must not be acted on or relied on by persons who are not major institutional investors. Any investment or investment activity to which this document relates is only available to major institutional investors and will be
engaged in only with major institutional investors. In reliance on the exemption from registration provided by Rule 15a-6 of the U.S. Securities Exchange Act of 1934, as amended (the "Exchange Act") and interpretations thereof by
the U.S. Securities and Exchange Commission ("SEC") in order to conduct business with Institutional Investors based in the U.S., MOSL has entered into a chaperoning agreement with a U.S. registered broker-dealer, Motilal Oswal
Securities International Private Limited. ("MOSIPL"). Any business interaction pursuant to this report will have to be executed within the provisions of this chaperoning agreement.
The Research Analysts contributing to the report may not be registered /qualified as research analyst with FINRA. Such research analyst may not be associated persons of the U.S. registered broker-dealer, MOSIPL, and therefore,
may not be subject to NASD rule 2711 and NYSE Rule 472 restrictions on communication with a subject company, public appearances and trading securities held by a research analyst account.
For Hong Kong:
This report is distributed in Hong Kong by Motilal Oswal capital Markets (Hong Kong) Private Limited, a licensed corporation (CE AYY-301) licensed and regulated by the Hong Kong Securities and Futures Commission (SFC)
pursuant to the Securities and Futures Ordinance (Chapter 571 of the Laws of Hong Kong) “SFO”. As per SEBI (Research Analyst Regulations) 2014 Motilal Oswal Securities (SEBI Reg No. INH000000412) has an agreement with
Motilal Oswal capital Markets (Hong Kong) Private Limited for distribution of research report in Kong Kong. This report is intended for distribution only to “Professional Investors” as defined in Part I of Schedule 1 to SFO. Any
investment or investment activity to which this document relates is only available to professional investor and will be engaged only with professional investors.”
Nothing here is an offer or solicitation of these securities, products and services in any jurisdiction where their offer or sale is not qualified or exempt from registration. The Indian Analyst(s) who compile this report is/are not located in
Hong Kong & are not conducting Research Analysis in Hong Kong.
Motilal Oswal Capital Markets Singapore Pte Limited is acting as an exempt financial advisor under section 23(1)(f) of the Financial Advisers Act(FAA) read with regulation 17(1)(d) of the Financial Advisors Regulations and is a
subsidiary of Motilal Oswal Securities Limited in India. This research is distributed in Singapore by Motilal Oswal Capital Markets Singapore Pte Limited and it is only directed in Singapore to accredited investors, as defined in the
Financial Advisers Regulations and the Securities and Futures Act (Chapter 289), as amended from time to time.
In respect of any matter arising from or in connection with the research you could contact the following representatives of Motilal Oswal Capital Markets Singapore Pte Limited:
Kadambari Balachandran
Email : kadambari.balachandran@motilaloswal.com
Contact : (+65) 68189233 / 65249115
Office Address : 21 (Suite 31),16 Collyer Quay,Singapore 04931
For Singapore
28 October 2015
Motilal Oswal Tower, Level 9, Sayani Road, Prabhadevi, Mumbai 400 025
Phone: +91 22 3982 5500 E-mail: reports@motilaloswal.com
Motilal Oswal Securities Ltd
12