4 November 2015
3QCY15 Results Update | Sector: Technology
BSE SENSEX
26,553
Bloomberg
Equity Shares (m)
M.Cap. (INR b) / (USD b)
52-Week Range (INR)
1, 6, 12 Rel. Per (%)
Avg Val (INR m)
Free float (%)
S&P CNX
8,040
HEXW IN
300.9
74.0/1.2
335/131
-4/1/30
406
28.7
Hexaware Technologies
CMP: INR246
TP: INR250 (2%)
Upgrade to Neutral
Revenue growth bogged down by 6.5% decline in top client
Revenue growth back on track:
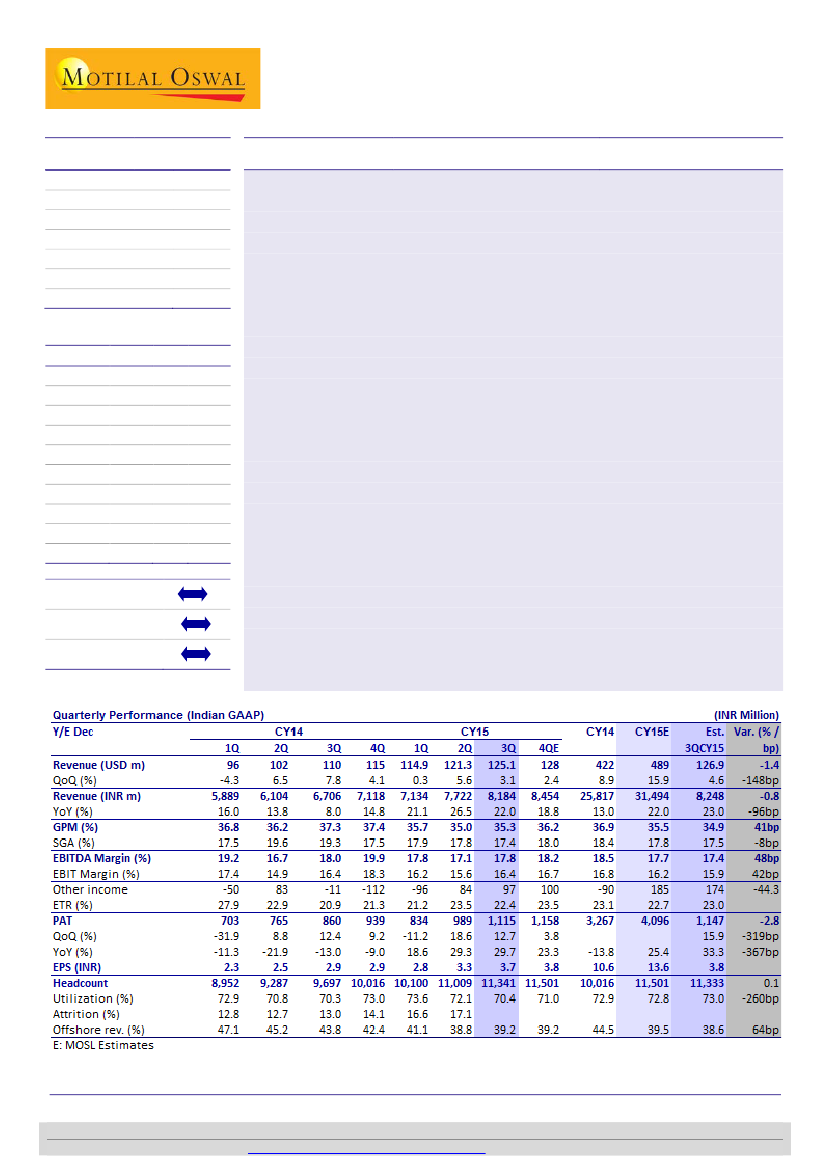
HEXW’s 3QCY15 revenues grew 3.1% QoQ to
USD125.1m, below our estimate of 4.6% growth. Revenue growth was weighed
upon by weakness in the top account (-6.5% QoQ). In the last four quarters,
growth has been mainly driven by top 10 accounts, led by HEXW’s client mining
efforts (74% of incremental revenues).
Margin expansion despite partial wage hikes:
EBITDA margin grew 80bp to
17.8%, marginally ahead of our estimate of 17.4%. Factors affecting gross margin:
[1] Calendar days (72bp), [2] Utilization (-132bp), [3] One time 2Q termination
cost (+82bp), [4] One time 2Q H1B visa cost (+59bp), [5] Currency (+56bp), [6]
Offshore wage hike (-38bp), and [7] Gratuity and other cost increase (-39bp).
SG&A costs were 40bp lower QoQ despite an addition of 30 marketing personnel.
Strong deal wins from new accounts:
While the growth in HEXW has largely been
driven by top accounts so far, it announced deals wins from new accounts at a
TCV of USD100m in 9MCY15. These are expected to ramp up largely in CY16; thus
adding to prospective growth, apart from traction in top accounts.
Upgrade to Neutral after valuation correction:
Post 3Q, our estimates change
marginally, to account for the revenue growth miss and beat on margins. Earnings
estimates have changed by -1.8% and -0.3% for CY15 and CY16 respectively.
HEXW has corrected by ~20% in the last quarter, and currently trades at 15.2x
CY16E, thereby eliminating the downside implied to our price target of INR250.
HEXW enjoys a premium to most tier-II peers, primarily supported by healthy
dividend payout (dividend yield of 4% on CY16E earnings), and above-industry-
average growth rates (16.1% revenue CAGR and 23% EPS CAGR over CY14-16E).
Our target price discounts CY16E EPS by 15x. Upgrade to
Neutral.
Financials & Valuation (INR b)
Y/E DEC
Sales
EBITDA
PAT
EPS (INR)
EPS Gr. (%)
RoE (%)
RoCE (%)
Payout (%)
P/E (x)
EV/EBITDA(x)
2014 2015E 2016E
25.8
4.8
3.3
10.6
-15.6
25.7
28.2
77.4
23.1
14.1
31.5
5.6
4.1
13.6
27.9
29.9
28.8
61.1
18.1
12.2
38.0
7.0
4.9
16.2
19.0
32.3
33.5
57.9
15.2
9.8
Estimate change
TP change
Rating change
Ashish Chopra
(Ashish.Chopra@MotilalOswal.com); +91 22 3982 5424
Sagar Lele
(Sagar.Lele@MotilalOswal.com); +91 22 3982 5585
Investors are advised to refer through disclosures made at the end of the Research Report.
Motilal Oswal research is available on
www.motilaloswal.com/Institutional-Equities,
Bloomberg, Thomson Reuters, Factset and S&P Capital.