9 November 2015
2QFY16 Results Update | Sector:
Capital Goods
Voltas
BSE SENSEX
26,121
Bloomberg
Equity Shares (m)
M.Cap. (INR b) / (USD b)
52-Week Range (INR)
1, 6, 12 Rel. Per (%)
12M Avg Val (INR M)
Free float (%)
S&P CNX
7,915
VOLT IN
330.7
98.9/1.5
360 / 227
3/3/17
712
69.7
CMP: INR275
TP: INR345 (+25%)
Buy
Financials & Valuation (INR Billion)
Y/E MAR
Net Sales
EBITDA
Adj PAT
EPS (INR)
EPS Gr. (%)
BV/Sh. (INR)
RoE (%)
RoCE (%)
P/E (x)
P/BV (x)
2015 2016E 2017E
51,831 54,657 63,207
4,100 4,216 5,972
3,381 3,512 4,826
10.2
37.5
64
16
21.9
22.6
3.6
10.6
3.9
71
16
15.2
26.2
3.9
14.6
37.4
82
19
18.1
18.8
3.3
Estimate change
TP change
Rating change
Operating performance below expectations; UCP sales disappoint
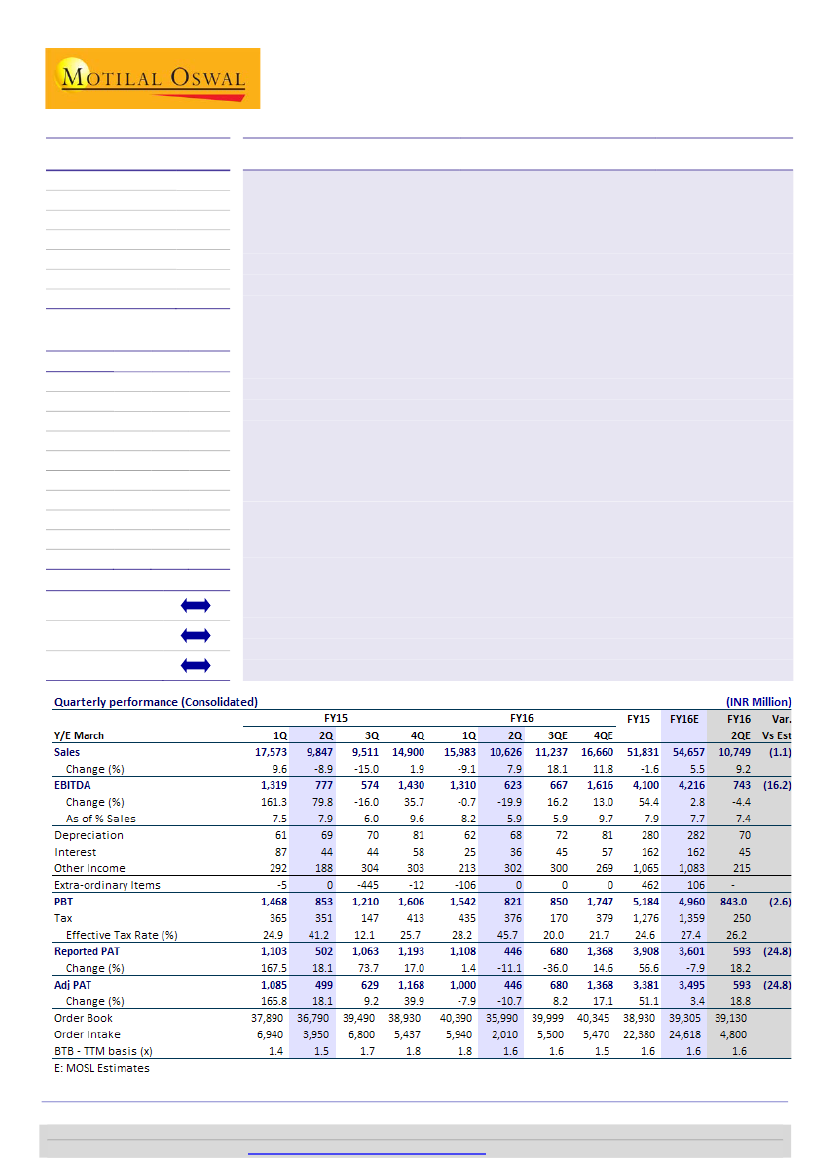
2QFY16 performance below expectations:
Revenue grew 7.9% YoY to INR10.6b (our
estimate: INR10.7b). EBITDA declined 20% YoY to INR623b (our estimate: INR743m).
Adjusted net profit declined 11% YoY to INR446m (our estimate: INR593m).
UCP
segment reported revenue decline of 9% YoY to INR3.1b. Room air conditioner
volumes were weak due to erratic weather and the commercial refrigeration
segment too was subdued. Adjusted for one large order in commercial refrigeration
(Rs0.15b), UCP sales were down 5% YoY. EBIT margin was 11.3% v/s 12.4% in
2QFY15. VOLT maintains its market leadership, with 20.8% share.
EMP
segment reported revenue of INR6.2b, up 18% YoY led by improvement in pace
of execution of three large projects (two international and one domestic). EBIT
margin was 1.7%; this is the sixth consecutive quarter of positive EBIT in the EMP
business. Importantly, capital employed corrected meaningfully from INR8b in
2QFY15 to INR5.8b in 2QFY16 (stable QoQ). Thus, asset turn improved from the lows
of 3.1x in 2QFY15 to the present 3.9x.
Project business witnesses weak order intake; book-to-bill ratio at 1.6x:
Order inflow
was down 49% YoY at INR2b. Drop in oil prices, increased competition, unviable
commercial terms and muted business environment have impacted order inflow. Order
book stands at INR36.6b and is down 2% YoY. Book-to-bill stands at 1.6x down from
1.9x in 1QFY16.
Maintain earnings; retain Buy:
We maintain Buy with a revised SOTP-based price
target of INR345 (UCP business at 25x FY17E EPS, MEP at 20x, and engineering products
at 20x). We expect growth rates in UCP business to rebound in the medium term, led
by (i) possible inflexion point in the AC segment, (ii) pent-up demand in FY16, and (iii)
incremental growth from air coolers. VOLT trades at 26x FY16E and 19x FY17E EPS.
Ankur Sharma
(ankur.vsharma@motilaloswal.com); +91 22 3982 5449
Amit Shah
(amit.shah@motilaloswal.com); +91 22 3029 5126
Investors are advised to refer through disclosures made at the end of the Research Report.
Motilal Oswal research is available on
www.motilaloswal.com/Institutional-Equities,
Bloomberg, Thomson Reuters, Factset and S&P Capital.

Voltas
Consolidated Performance below estimates; UCP segment disappoints
2QFY16 performance was below estimates: Revenue up 7.9% YoY to INR10.6b
(estimate of INR10.7b) and EBIDTA down 20.0% YoY to INR623b (below estimate
of INR743m). Adjusted net profit stood at INR446m, down 11% YoY (below
estimate of INR593m).
Unitary Cooling Products (UCP)
reported revenue decline of 9.0% YoY to
INR3.1b; weak volumes in room air conditioners due to erratic weather while
the commercial refrigeration market also remained subdued. Moreover last
year’s revenue included large one time order (INR150m) for the commercial
refrigeration products. Room aircon industry volumes have seen a growth of just
2% in 1H16 vs. 19.4% in 1H15. EBIT margins stood at 11.3% v/s 12.4% in 2QFY15
down 90bp YoY was impacted by negative operating leverage. VOLT has
maintained the market leadership positioning in this segment with 20.8%
market share in Q216.
EMP
business reported revenues of INR6.2b, improvement of 18% YoY—led by
improvement in pace of execution of three projects (two international and one
domestic). EBIT margins stood at 1.7%—this is the sixth consecutive quarter of
positive EBIT in the EMP business. Margins continue to remain weak (below 4-
5% margin guidance) impacted by several factors including i) new project wins
(at better commercial terms) yet to reach the threshold completion level of 20%
ii) time and cost overruns on ongoing projects, etc.
Engineering products
reported revenue improvement of 10.3%, as the revenues
in mining and construction business as well as the textile machinery business
witnessed demand improvement as compared to last year. EBIT margins
declined 130bps YoY to 35.3%.
Tax rates
have increased to 46% in 2QFY16, vs 41% YoY. Higher tax rate has
been primarily on account of dividend Voltas has received from it subsidiary. For
FY16 management has guided for a tax rate of 28%.
Exhibit 2: EBITDA decline on adverse mix and fall in product
margins
EBITDA (INR b)
EBITDA (%)
Exhibit 1: Revenue growth impacted by weak UCP sales
partially offsetting strong EMP sales
Revenues (INR b)
Growth (%)
Source: MOSL, Company
9 November 2015
2

Voltas
Exhibit 3: Quarterly performance (INR m)
Segmental Revenues
EMP & Services
Engineering products and services
Unitary cooling business
Others
Total
Segment PBIT
EMP & Services
Engineering products and services
Unitary cooling business
Others
Total PBIT
Segment PBIT (%)
EMP & Services
Engineering products and services
Unitary cooling business
Others
Total PBIT
Capital Employed
EMP & Services
Engineering products and services
Unitary cooling business
Others
Unallocated
Total Capital Employed
3QFY14
6,429
1,118
3,470
134
11,151
4QFY14
6,857
988
6,543
125
14,512
1QFY15
6,222
1,109
10,014
181
17,526
2QFY15
5,253
872
3,449
117
9,690
3QFY15
4,613
810
3,835
134
9,392
4QFY15
5,997
811
7,807
229
14,844
1QFY16
5,559
700
9,490
205
15,954
2QFY16
6,208
961
3,141
289
10,599
FY14
26,924
4,482
20,524
520
52,451
FY15
22,085
3,601
25,105
661
51,452
(42)
361
450
1
770
(139)
302
1,102
1
1,266
44
240
1,163
31
1,478
49
319
427
7
802
92
235
510
5
842
43
287
1,391
28
1,749
75
239
1,132
16
1,461
141
247
496
4
888
(396)
1,414
2,567
6
3,592
228
1,081
3,491
70
4,871
(0.7)
32.2
13.0
1.0
6.9
(2.0)
30.6
16.8
0.8
8.7
0.7
21.6
11.6
17.0
8.4
0.9
36.6
12.4
6.3
8.3
2.0
29.0
13.3
3.4
9.0
0.7
35.4
17.8
12.0
11.8
1.3
34.2
11.9
7.7
9.2
2.3
25.7
15.8
1.5
8.4
(1.5)
31.6
12.5
1.1
6.8
1.0
30.0
13.9
10.6
9.5
5,793
1,068
2,678
289
8,264
18,092
6,237
1,073
2,747
249
8,025
18,331
6,897
895
(703)
286
11,985
19,361
8,041
846
2,577
234
8,167
19,864
6,653
800
3,963
236
9,301
20,953
5,264
668
2,900
301
12,048
21,181
5,410
759
1,373
312
14,430
22,284
5,802
747
3,818
231
12,261
22,858
Source: MOSL, Company
Project business reports weak order intake; Book-to-bill ratio at 1.6x;
Capital Employed has corrected – a positive surprise
Order inflow for 2QFY16 stood at INR2.0bn down 49% YoY. . Drop in oil prices,
increased competition, unviable commercial terms and a muted business
environment have impacted the order inflow for the company. Order book stands at
INR36b and is down 2% YoY. Book-to-bill stands at 1.6x down from 1.9x in 1QFY16.
Exhibit 4: BTB has improved from lows
Order Book (INR b)
Book to Bill (x)
Exhibit 5: Project business EBIT margins at breakeven levels
Revenues (INR b)
PBIT (%)
Source: MOSL, Company
9 November 2015
3

Voltas
Capital employed has corrected meaningfully from INR8.0b in 2QFY15 to INR5.8b in
2QFY16 (stable QoQ). Thus, asset turn has improved from lows of 3.1x in 2QFY15 to
3.9x now. We understand that the normative asset turn in the business stands at
~5x, and thus the current levels are a positive surprise, given that a substantial part
of the capital employed continue to be locked as claims on legacy projects.
Exhibit 6: Order book composition
International (%)
Domestic (%)
Exhibit 7: CE has corrected in 4QCY15, positive surprise
Capital Employed (INR b)
Asset Turn (x)
40 42 41 38 46 48
53 54 58 60 52 54 56 57 60 53 52 50 52
60 58 59 62 54 52
47 46 42 40 48 46 44 43 40 47 48 50 48
Source: MOSL, Company
UCP business margins stable, maintains Number 1 position
Q216 was another weak quarter for the room air conditioner industry as a result of
the poor summers and erratic weather. 1H16 industry volumes were up just 2% YoY
vs. 19.4% growth seen in 1H15.
More importantly, the Northern market (45% of sales for Voltas) was down 10%
YoY. This had led to an inventory buildup in the channel and lead to industry
participants offering discounts and freebies to clear channel inventory. Voltas has
refrained from offering discounts and therefore been able to largely maintain
margins at 11.3% in 2Q16 (down 110bps YoY).
Exhibit 8: EBIT margins near to high levels
Revenues (INR b)
PBIT (%)
Exhibit 9: Market share gains have been sustained
Market Share (%)
Source: MOSL, Company
9 November 2015
4

Voltas
Valuation and view
We model PAT CAGR of 12% over FY15-17, largely led by profitability improvement
in MEP business, 12% EBIT CAGR in UCP business and 1.4% EBIT CAGR in Engineering
Products business.
We maintain
Buy,
with a revised SOTP-based price target of INR345 (UCP business at
25x FY17E EPS, MEP at 20x, and Engineering Products at 20x. We expect growth
rates in UCP business to bounce back in the medium term, led by i) possible
inflexion point in AC segment ii) pent up demand in FY16 and iii) incremental growth
from air coolers. At CMP, VOLT trades at 25.8x/18.8x its FY16E/FY17E EPS.
Key triggers / risks
Projects business:
Negotiations with customers on time / cost overruns; pick-up
in ordering will be important monitorables. Further provisions on the Sidra /
other legacy projects remain a key risk.
UCP business:
Maintaining the number-1 position in India and expanding the
market share gap is a challenge. Success in air-coolers would an important
driver.
Key Result Highlights:
Secondary sales of AC business have witnessed 2% growth in 1HFY16 as compared
to 19.4% growth in 1HFY15. Muted growth has been primarily on account of de-
growth of 10% in northern market in 1HFY16 as compared to 20.4% growth in
1HFY15. For Voltas Northern market contributes 45% of the revenue.
During the quarter, AC pricing has been marginally negative. 20% of the revenue
contribution in the UCP business comes from commercial refrigeration
Post the test launch of air coolers, VOLT is currently ramping up its product portfolio
and dealership network for the upcoming season.
On the EMP business front, drop in the oil prices has led to delay in muted capex in
the Saudi Arabia, Oman. However project in Qatar are witnessing traction and 7
projects of the total 17 projects planned are on track. commercial terms continue to
remain tight.
Voltas continue to bid projects at a threshold margin of 4-5% in the international
market and 7-8% in the domestic market. Aggregate margins for EMP business are
5%.
9 November 2015
5

Voltas
Exhibit 10: Operating Metrics
INR M
Order Book
Domestic
International
YoY
Order Inflows
Revenues
India Contract
ME Contract
Products / Services
EMP Revenues
India Contract, % YoY
ME Contract, % YoY
Segmental Revenues
Electro mechanical projects
Engineering Products
Unitary Cooling products
Others
Total Revenues
EMP, % YoY
Engg Products, % YoY
UCP, % YoY
Segmental PBIT
Electro mechanical projects
Engineering Products
Unitary Cooling products
Others
Total PBIT
EPS (INR/sh)
NWC (Days)
EPS Composition (INR/sh)
Electro mechanical projects
Engineering Products
Unitary Cooling products
FY10
46,780
15,000
31,780
-1.7%
30,730
9,513
17,483
4,134
31,130
17.1%
15.9%
31,130
4,680
11,860
390
48,060
12.8%
-13.7%
28.9%
3,091
768
1,203
72
5,134
10.3
8.2
FY11
48,870
19,630
29,240
4.5%
32,501
10,053
15,843
4,515
30,411
5.7%
-9.4%
30,411
5,638
15,608
126
51,783
-2.3%
20.5%
31.6%
2,393
1,031
1,599
16
5,039
9.5
30.4
FY12
42,920
19,560
23,360
-12.2%
25,882
9,511
17,627
4,695
31,832
-5.4%
11.3%
31,832
4,121
15,388
427
51,768
4.7%
-26.9%
-1.4%
-1,042
687
1,298
42
985
9.5
55.9
FY13
37,190
21,610
15,580
-13.4%
26,265
8,634
18,381
4,980
31,995
-9.2%
4.3%
31,995
4,311
18,356
502
55,163
0.5%
4.6%
19.3%
-491
821
1,655
3
1,988
5.9
53.4
FY14
36,120
20,200
15,920
-2.9%
22,410
7,213
14,408
5,302
26,924
-16.5%
-21.6%
26,924
4,482
20,524
520
52,451
-15.8%
4.0%
11.8%
-396
1,414
2,567
6
3,592
6.8
52.5
6.8
-2.2
2.8
6.2
FY15
38,930
20,220
18,710
7.8%
22,380
5,169
11,293
5,623
22,085
-28.3%
-21.6%
22,085
3,601
25,105
661
51,452
-18.0%
-19.7%
22.3%
231
1,081
3,491
70
4,874
10.2
40.7
10.2
-0.3
2.1
8.4
FY16E
39,305
25,549
13,757
3.6%
20,110
5,944
11,067
7,231
24,243
15.0%
-2.0%
24,243
3,529
25,607
900
57,088
9.8%
-2.0%
2.0%
485
1,059
3,355
108
5,007
10.6
46.3
10.6
0.4
2.1
8.1
FY17E
44,859
29,906
14,953
15.7%
24,531
7,133
9,491
9,500
26,124
20.0%
-14.2%
26,124
3,705
32,009
990
65,626
7.8%
5.0%
25.0%
1,306
1,112
4,353
119
6,891
14.6
51.3
14.6
1.9
2.2
10.5
Source: Company, MOSL
9 November 2015
6

Voltas
Financials and valuations
Income Statement
Y/E March
Total Revenues
Change (%)
Raw Materials
Staff Cost
Other Expenses
EBITDA
% of Total Revenues
Other Income
Depreciation
Interest
Exceptional Items
PBT
Tax
Rate (%)
Adjusted PAT
Extra-ordinary Income (net)
Reported PAT
Change (%)
Adj. Consolidated PAT
Change (%)
Balance Sheet
Y/E March
Share Capital
Reserves
Net Worth
Minority Intetest
Loans
Deferred Tax Liability
Capital Employed
Gross Fixed Assets
Less: Depreciation
Net Fixed Assets
Capital WIP
Investments
Goodwill
Curr. Assets
Inventory
Debtors
Cash & Bank Balance
Loans & Advances
Current Liab. & Prov.
Creditors
Other Liabilities
Net Current Assets
Application of Funds
E: MOSL Estimates
2010
48,059
11.1
32,992
5,357
5,118
4,592
9.6
214
98
250
4,529
1,472
32.5
3,057
-
3,057
93.1
3,397
51.5
2011
51,914
8.0
36,808
5,563
4,914
4,629
8.9
210
165
402
4,656
1,725
37.0
2,931
-
2,931
(4.1)
3,147
(7.3)
2012
51,857
(0.1)
37,800
5,995
4,698
3,365
6.5
985
340
314
(1,505)
2,191
571
26.1
1,620
-
1,620
(44.7)
3,126
(0.7)
2013
55,310
6.7
41,670
6,325
4,934
2,380
4.3
901
278
326
121
2,798
728
26.0
2,070
-
2,070
27.8
1,955
(37.5)
2014
52,660
(4.8)
38,543
5,947
5,515
2,656
5.0
1,002
248
225
215
3,399
941
27.7
2,458
-
2,458
18.7
2,238
14.5
2015
51,831
-2
35,974
5,899
5,857
4,100
7.9
1,087
280
233
462
5,136
1,276
25
3,860
0
3,860
57
3,381
51
2016E
54,657
5
38,247
6,165
6,029
4,216
7.7
1,083
282
162
0
4,855
1,359
28
3,512
0
3,512
-9
3,512
4
(INR Million)
2017E
63,207
16
44,476
6,442
6,316
5,972
9.4
1,217
288
198
0
6,703
1,877
28
4,826
0
4,826
37
4,826
37
2010
331
10,521
10,852
139
352
(202)
11,140
3,890
1,821
2,069
193
2,339
764
28,267
11,441
10,060
4,689
2,078
22,493
19,848
2,645
5,774
11,140
2011
331
13,287
13,618
196
1,367
(152)
15,029
4,198
1,987
2,211
10
2,686
894
35,475
8,215
19,948
4,890
2,422
26,246
23,084
3,163
9,228
15,029
2012
331
14,469
14,800
170
2,214
(242)
16,941
4,451
2,448
2,003
46
3,116
890
35,271
8,334
20,977
2,710
3,249
24,384
14,730
9,654
10,887
16,941
2013
331
15,926
16,256
118
2,612
(222)
18,765
4,678
2,568
2,110
0
4,074
888
38,352
9,784
21,927
3,498
3,142
26,658
17,191
9,186
11,694
18,766
2014
331
17,862
18,193
138
2,629
(239)
20,721
4,198
2,113
2,086
18
7,320
798
36,974
9,010
22,039
2,818
3,108
26,476
16,267
10,208
10,499
20,721
2015
331
20,690
21,021
161
1,217
(349)
22,049
4,114
2,223
1,891
44
10,939
798
34,844
8,671
21,051
2,516
2,606
26,466
15,414
11,051
8,378
22,050
(INR Million)
2016E
2017E
331
331
23,303
26,895
23,634
27,226
161
161
1,717
2,217
(349)
(349)
25,163
29,255
4,649
2,941
1,708
44
10,939
814
38,817
9,143
14,116
4,727
2,748
27,160
15,506
11,654
11,657
25,163
4,749
3,229
1,520
44
10,939
814
46,480
10,574
16,324
7,057
3,178
30,543
17,066
13,477
15,937
29,254
9 November 2015
7

Voltas
Financials and valuations
Ratios
Y/E March
Basic (INR)
Adj EPS
Cash EPS
Book Value
DPS
Payout (incl. Div. Tax.)
Valuation (x)
P/E
Cash P/E
EV/EBITDA
EV/Sales
Price/Book Value
Dividend Yield (%)
Profitability Ratios (%)
RoE
RoCE
Turnover Ratios
Debtors (Days)
Inventory (Days)
Creditors. (Days)
Asset Turnover (x)
Leverage Ratio
Debt/Equity (x)
Cash Flow Statement
Y/E March
PBT before EO Items
Add : Depreciation
Interest
Less : Direct Taxes Paid
(Inc)/Dec in WC
CF from Operations
(Inc)/Dec in FA
Free Cash Flow
Investment in liquid assets
CF from Investments
(Inc)/Dec in Debt
Less : Interest Paid
Dividend Paid
CF from Fin. Activity
Inc/Dec of Cash
Add: Beginning Balance
Closing Balance
E: MOSL Estimates
2010
10.3
9.2
10.9
32.8
2.0
20.3
2011
9.5
8.9
10.2
41.2
2.0
21.5
2012
9.5
4.9
10.5
44.7
1.6
38.0
2013
5.9
6.3
6.8
49.2
1.6
29.8
2014
6.8
7.4
7.5
55.0
1.9
29.2
2015
10.2
10.2
11.1
63.6
2.3
23.3
2016E
10.6
10.6
11.5
71.5
2.3
25.6
2017E
14.6
14.6
15.5
82.3
3.2
25.6
23.8
34.2
20.0
1.0
2.9
1.1
22.6
20.9
18.3
1.5
3.6
1.0
26.2
24.2
21.1
1.6
3.9
0.8
18.0
16.9
13.7
1.3
3.2
1.2
31.3
39.3
23.1
29.4
21.1
23.3
12.0
15.8
12.3
16.3
16.1
21.9
15.7
15.2
19.0
18.1
76
87
151
4.3
140
58
162
3.5
148
59
152
3.1
145
65
158
2.9
153
62
164
2.5
148.2
61.1
161.4
2.4
94.3
61.1
103.6
2.2
94.3
61.1
98.6
2.2
0.0
0.1
0.1
0.2
0.1
0.1
0.1
0.1
2010
5,318
214
98
(1,472)
(965)
3,193.0
3,193
35
3,228
(777)
(741.6)
(1,463)
(98)
(772)
(2,333)
119
4,571
4,689
2011
5,240
210
165
(1,725)
(3,300)
590.9
591
(125)
466
(346)
(471.4)
1,016
(165)
(769)
81
201
4,689
4,890
2012
2,191
340
314
(571)
(3,651)
(1,378)
(289)
(1,666)
(430)
(719)
847
(314)
(615)
(83)
(2,179)
4,890
2,710
2013
2,798
278
326
(728)
(202)
2,472
(181)
2,291
(957)
(1,139)
399
(326)
(619)
(546)
787
2,710
3,497
2014
3,399
248
225
(941)
98
3,030
462
3,492
(3,247)
(2,785)
17
(225)
(716)
(925)
(679)
3,497
2,818
2015
5,136
280
233
(1,276)
1,425
5,798
58
5,856
(3,619)
(3,561)
(1,412)
(233)
(894)
(2,539)
(302)
2,818
2,516
2016E
4,855
282
-
(1,359)
(1,068)
2,709
(100)
2,609
-
(100)
500
-
(898)
(398)
2,211
2,516
4,727
2017E
6,703
288
-
(1,877)
(1,950)
3,164
(100)
3,064
-
(100)
500
-
(1,234)
(734)
2,330
4,727
7,057
9 November 2015
8

Voltas
Corporate profile: Voltas
Company description
Voltas (VOLT) is a Tata group company and is
India's largest air conditioning company and is one
of the leading engineering solution provider across
GCC nations as well. VOLT’s business portfolio
comprises of providing HVaC & MEP solutions.
VOLT has a proven track record of delivering MEP /
HVaC solution across iconic projects like Burj Al
Arab, F1 track in Bahrain etc. VOLT’s product
business comprises of unitary cooling division, in
which VOLT is the market leader with ~20% market
share. Other product business would include,
marketing of textile machinery.
Exhibit 11: Sensex rebased
Exhibit 12: Shareholding pattern (%)
Sep-15
Promoter
DII
FII
Others
30.3
26.8
21.1
21.8
Jun-15
30.3
25.5
23.3
20.8
Sep-14
30.3
28.1
19.8
21.9
Exhibit 13: Top holders
Holder Name
LIFE INSURANCE CORPORATION OF INDIA *
FRANKLIN TEMPLETON INVESTMENT FUNDS
HDFC MUTUAL FUND *
HASHAM INVESTMENT AND TRADING COMPANY
FRANKLIN TEMPLETON MUTUAL FUND *
% Holding
7.5
3.8
3.2
2.5
2.3
Note: FII Includes depository receipts
Exhibit 14: Top management
Name
Ishaat Hussain
Sanjay Johri
Designation
Chairman
Managing Director
Exhibit 15: Directors
Name
Ishaat Hussain
Sanjay Johri
N N Tata
R N Mukhija*
Nani Javeri*
*Independent
Name
Vinayak Deshpande
Bahram Navroz Vakil*
Debendranath Sarangi*
Anjali Bansal*
Exhibit 16: Auditors
Name
Deloitte Haskins & Sells LLP
Sagar & Associates
Type
Statutory
Cost Auditor
Exhibit 17: MOSL forecast v/s consensus
EPS
(INR)
FY16
FY17
MOSL
forecast
10.6
14.6
Consensus
forecast
10.5
13.3
Variation
(%)
0.6
9.7
9 November 2015
9

Disclosures
This document has been prepared by Motilal Oswal Securities Limited (hereinafter referred to as Most) to provide information about the company(ies) and/sector(s), if any, covered in the report and may be distributed by it and/or its
affiliated company(ies). This report is for personal information of the selected recipient/s and does not construe to be any investment, legal or taxation advice to you. This research report does not constitute an offer, invitation or
inducement to invest in securities or other investments and Motilal Oswal Securities Limited (hereinafter referred as MOSt) is not soliciting any action based upon it. This report is not for public distribution and has been furnished to
Voltas
you solely for your general information and should not be reproduced or redistributed to any other person in any form. This report does not constitute a personal recommendation or take into account the particular investment
objectives, financial situations, or needs of individual clients. Before acting on any advice or recommendation in this material, investors should consider whether it is suitable for their particular circumstances and, if necessary, seek
professional advice. The price and value of the investments referred to in this material and the income from them may go down as well as up, and investors may realize losses on any investments. Past performance is not a guide for
future performance, future returns are not guaranteed and a loss of original capital may occur.
MOSt and its affiliates are a full-service, integrated investment banking, investment management, brokerage and financing group. We and our affiliates have investment banking and other business relationships with a some
companies covered by our Research Department. Our research professionals may provide input into our investment banking and other business selection processes. Investors should assume that MOSt and/or its affiliates are
seeking or will seek investment banking or other business from the company or companies that are the subject of this material and that the research professionals who were involved in preparing this material may educate investors
on investments in such business. The research professionals responsible for the preparation of this document may interact with trading desk personnel, sales personnel and other parties for the purpose of gathering, applying and
interpreting information. Our research professionals are paid on the profitability of MOSt which may include earnings from investment banking and other business.
MOSt generally prohibits its analysts, persons reporting to analysts, and members of their households from maintaining a financial interest in the securities or derivatives of any companies that the analysts cover. Additionally, MOSt
generally prohibits its analysts and persons reporting to analysts from serving as an officer, director, or advisory board member of any companies that the analysts cover. Our salespeople, traders, and other professionals or affiliates
may provide oral or written market commentary or trading strategies to our clients that reflect opinions that are contrary to the opinions expressed herein, and our proprietary trading and investing businesses may make investment
decisions that are inconsistent with the recommendations expressed herein. In reviewing these materials, you should be aware that any or all of the foregoing among other things, may give rise to real or potential conflicts of interest.
MOSt and its affiliated company(ies), their directors and employees and their relatives may; (a) from time to time, have a long or short position in, act as principal in, and buy or sell the securities or derivatives thereof of companies
mentioned herein. (b) be engaged in any other transaction involving such securities and earn brokerage or other compensation or act as a market maker in the financial instruments of the company(ies) discussed herein or act as an
advisor or lender/borrower to such company(ies) or may have any other potential conflict of interests with respect to any recommendation and other related information and opinions.; however the same shall have no bearing
whatsoever on the specific recommendations made by the analyst(s), as the recommendations made by the analyst(s) are completely independent of the views of the affiliates of MOSt even though there might exist an inherent
conflict of interest in some of the stocks mentioned in the research report
Reports based on technical and derivative analysis center on studying charts company's price movement, outstanding positions and trading volume, as opposed to focusing on a company's fundamentals and, as such, may not match
with a report on a company's fundamental analysis. In addition MOST has different business segments / Divisions with independent research separated by Chinese walls catering to different set of customers having various
objectives, risk profiles, investment horizon, etc, and therefore may at times have different contrary views on stocks sectors and markets.
Unauthorized disclosure, use, dissemination or copying (either whole or partial) of this information, is prohibited. The person accessing this information specifically agrees to exempt MOSt or any of its affiliates or employees from, any
and all responsibility/liability arising from such misuse and agrees not to hold MOSt or any of its affiliates or employees responsible for any such misuse and further agrees to hold MOSt or any of its affiliates or employees free and
harmless from all losses, costs, damages, expenses that may be suffered by the person accessing this information due to any errors and delays. The information contained herein is based on publicly available data or other sources
believed to be reliable. Any statements contained in this report attributed to a third party represent MOSt’s interpretation of the data, information and/or opinions provided by that third party either publicly or through a subscription
service, and such use and interpretation have not been reviewed by the third party. This Report is not intended to be a complete statement or summary of the securities, markets or developments referred to in the document. While we
would endeavor to update the information herein on reasonable basis, MOSt and/or its affiliates are under no obligation to update the information. Also there may be regulatory, compliance, or other reasons that may prevent MOSt
and/or its affiliates from doing so. MOSt or any of its affiliates or employees shall not be in any way responsible and liable for any loss or damage that may arise to any person from any inadvertent error in the information contained in
this report. MOSt or any of its affiliates or employees do not provide, at any time, any express or implied warranty of any kind, regarding any matter pertaining to this report, including without limitation the implied warranties of
merchantability, fitness for a particular purpose, and non-infringement. The recipients of this report should rely on their own investigations.
This report is intended for distribution to institutional investors. Recipients who are not institutional investors should seek advice of their independent financial advisor prior to taking any investment decision based on this report or for
any necessary explanation of its contents.
Most and it’s associates may have managed or co-managed public offering of securities, may have received compensation for investment banking or merchant banking or brokerage services, may have received any compensation for
products or services other than investment banking or merchant banking or brokerage services from the subject company in the past 12 months.
Most and it’s associates have not received any compensation or other benefits from the subject company or third party in connection with the research report.
Subject Company may have been a client of Most or its associates during twelve months preceding the date of distribution of the research report
MOSt and/or its affiliates and/or employees may have interests/positions, financial or otherwise of over 1 % at the end of the month immediately preceding the date of publication of the research in the securities mentioned in this
report. To enhance transparency, MOSt has incorporated a Disclosure of Interest Statement in this document. This should, however, not be treated as endorsement of the views expressed in the report.
Motilal Oswal Securities Limited is registered as a Research Analyst under SEBI (Research Analyst) Regulations, 2014. SEBI Reg. No. INH000000412
There are no material disciplinary action that been taken by any regulatory authority impacting equity research analysis activities
Analyst Certification
The views expressed in this research report accurately reflect the personal views of the analyst(s) about the subject securities or issues, and no part of the compensation of the research analyst(s) was, is, or will be directly or
indirectly related to the specific recommendations and views expressed by research analyst(s) in this report. The research analysts, strategists, or research associates principally responsible for preparation of MOSt research receive
compensation based upon various factors, including quality of research, investor client feedback, stock picking, competitive factors and firm revenues
Disclosure of Interest Statement
Analyst ownership of the stock
Served as an officer, director or employee
VOLTAS
No
No
A graph of daily closing prices of securities is available at www.nseindia.com and http://economictimes.indiatimes.com/markets/stocks/stock-quotes
Regional Disclosures (outside India)
For U.S.
This report is not directed or intended for distribution to or use by any person or entity resident in a state, country or any jurisdiction, where such distribution, publication, availability or use would be contrary to law, regulation or which
would subject MOSt & its group companies to registration or licensing requirements within such jurisdictions.
Motilal Oswal Securities Limited (MOSL) is not a registered broker - dealer under the U.S. Securities Exchange Act of 1934, as amended (the"1934 act") and under applicable state laws in the United States. In addition MOSL is not a
registered investment adviser under the U.S. Investment Advisers Act of 1940, as amended (the "Advisers Act" and together with the 1934 Act, the "Acts), and under applicable state laws in the United States. Accordingly, in the
absence of specific exemption under the Acts, any brokerage and investment services provided by MOSL, including the products and services described herein are not available to or intended for U.S. persons.
This report is intended for distribution only to "Major Institutional Investors" as defined by Rule 15a-6(b)(4) of the Exchange Act and interpretations thereof by SEC (henceforth referred to as "major institutional investors"). This
document must not be acted on or relied on by persons who are not major institutional investors. Any investment or investment activity to which this document relates is only available to major institutional investors and will be
engaged in only with major institutional investors. In reliance on the exemption from registration provided by Rule 15a-6 of the U.S. Securities Exchange Act of 1934, as amended (the "Exchange Act") and interpretations thereof by
the U.S. Securities and Exchange Commission ("SEC") in order to conduct business with Institutional Investors based in the U.S., MOSL has entered into a chaperoning agreement with a U.S. registered broker-dealer, Motilal Oswal
Securities International Private Limited. ("MOSIPL"). Any business interaction pursuant to this report will have to be executed within the provisions of this chaperoning agreement.
The Research Analysts contributing to the report may not be registered /qualified as research analyst with FINRA. Such research analyst may not be associated persons of the U.S. registered broker-dealer, MOSIPL, and therefore,
may not be subject to NASD rule 2711 and NYSE Rule 472 restrictions on communication with a subject company, public appearances and trading securities held by a research analyst account.
For Hong Kong:
This report is distributed in Hong Kong by Motilal Oswal capital Markets (Hong Kong) Private Limited, a licensed corporation (CE AYY-301) licensed and regulated by the Hong Kong Securities and Futures Commission (SFC)
pursuant to the Securities and Futures Ordinance (Chapter 571 of the Laws of Hong Kong) “SFO”. As per SEBI (Research Analyst Regulations) 2014 Motilal Oswal Securities (SEBI Reg No. INH000000412) has an agreement with
Motilal Oswal capital Markets (Hong Kong) Private Limited for distribution of research report in Kong Kong. This report is intended for distribution only to “Professional Investors” as defined in Part I of Schedule 1 to SFO. Any
investment or investment activity to which this document relates is only available to professional investor and will be engaged only with professional investors.”
Nothing here is an offer or solicitation of these securities, products and services in any jurisdiction where their offer or sale is not qualified or exempt from registration. The Indian Analyst(s) who compile this report is/are not located in
Hong Kong & are not conducting Research Analysis in Hong Kong.
Motilal Oswal Capital Markets Singapore Pte Limited is acting as an exempt financial advisor under section 23(1)(f) of the Financial Advisers Act(FAA) read with regulation 17(1)(d) of the Financial Advisors Regulations and is a
subsidiary of Motilal Oswal Securities Limited in India. This research is distributed in Singapore by Motilal Oswal Capital Markets Singapore Pte Limited and it is only directed in Singapore to accredited investors, as defined in the
Financial Advisers Regulations and the Securities and Futures Act (Chapter 289), as amended from time to time.
In respect of any matter arising from or in connection with the research you could contact the following representatives of Motilal Oswal Capital Markets Singapore Pte Limited:
Kadambari Balachandran
Email : kadambari.balachandran@motilaloswal.com
Contact : (+65) 68189233 / 65249115
Office Address : 21 (Suite 31),16 Collyer Quay,Singapore 04931
For Singapore
Motilal Oswal Securities Ltd
9 November 2015
Motilal Oswal Tower, Level 9, Sayani Road, Prabhadevi, Mumbai 400 025
Phone: +91 22 3982 5500 E-mail: reports@motilaloswal.com
10