26 November 2015
Dr. Reddy’s Lab
BSE Sensex
25,776
S&P CNX
7,832
Update | Sector: Healthcare
CMP: INR3,388
TP: INR3,500 (+3%)
Downgrade to Neutral
Stock Info
Bloomberg
Equity Shares (m)
M.Cap. (INR b)/(USD b)
52-Week Range (INR)
1, 6, 12 Rel. Per (%)
AvgVal,(INR m)
Free float (%)
Warning letters observations on US FDA website
DRRD IN
170.4
560.1/8.5
4383/3010
-19/-2/1
1,391
74.5
Observations include data integrity and quality control issues at these plants
which increases the probability of warning letter getting converted into import
alert.
Remediation plan to include third party audit which would entail additional cost.
Apart from this corrective measures may lead to supply disruption in near term.
Financial Snapshot (INR Billion)
Y/E Mar
2015 2016E 2017E
Sales
EBITDA
Net Profit
Adj. EPS (INR)
EPS Gr. (%)
BV/Sh. (INR)
RoE (%)
RoCE (%)
P/E (x)
P/BV (x)
148.2 162.4 175.5
33.5
22.2
4.5
19.9
16.9
26.0
5.2
41.9
27.3
22.9
20.3
19.7
21.2
4.3
41.8
27.3
0.0
17.4
17.0
21.2
3.7
FDA released the warning letter given to DRRD on the three plants (US
FDA
Link).
Notably, observations at the three facilities include CGMP deviations and
violations. Concerns cited by FDA include issues related to data integrity and
quality control which enhances the risk of import alert on these plants. The
agency has questioned the effectiveness of the current corporate quality
system and has asked DRRD to take global corrective action.
Key concerns raised by US FDA:
FDA highlighted that the processes
implemented at these facilities do not conform to CGMP. One of the key
observations raised at the Srikakulam facility was that US FDA found existence
of an uncontrolled ‘Custom QC laboratory’. Presence of this lab was unknown to
US FDA. These concerns along with other issues raised by US FDA (see
subsequent pages for detail related to other observations) enhance the risk of
products supplied from these facilities to be adulterated.
Remediation plan would entail additional cost and risk of supply disruption:
FDA has asked DRRD to put in place a remediation plan which should ensure
direct corporate oversight over the quality and operations functions of this
facility. They have recommended that DRRD hire a third-party auditor to assist
DRRD regarding overall compliance with CGMP. We think this will entail
additional cost and time to get the facilities fully FDA complaint.
Lower probability of adverse action at Bachupalli plant:
Though it cannot be
ruled but probability of adverse action at Bachupally plant (which got inspected
by US FDA in Jun-15 with some 483 observations) is low now as it did not
receive warning letter along with above mentioned facilities. This is a key
facility for DRRD as it contributes >50% to current US sales.
Regulatory concerns caps upside potential; Downgrading to Neutral:
Sales
contribution from these facilities to US market is ~10-12% of total sales
(~USD250m). We believe the speed with which DRRD is able to resolve these
issues with the FDA is going to be critical (unlikely before FY18, in our view).
Though long term fundamental remain intact, the stock will remain range
bound in the near term due to regulatory concerns. We downgrade the stock to
Neutral with TP of Rs3,500 (@ 20x 1HFY18E PER) and have cut our FY17/18E
EPS by 11-14%. The cut in EPS is attributed to higher remediation cost and
supply disruptions required to take corrective actions.
130.2 160.0 160.0
653.2 789.8 921.7
Shareholding pattern (%)
As on
Sep-15 Jun-15 Sep-14
Promoter
DII
FII
Others
25.5
5.2
55.0
14.4
25.5
5.9
54.8
13.8
25.5
5.4
55.5
13.7
Note: FII includes depository receipts
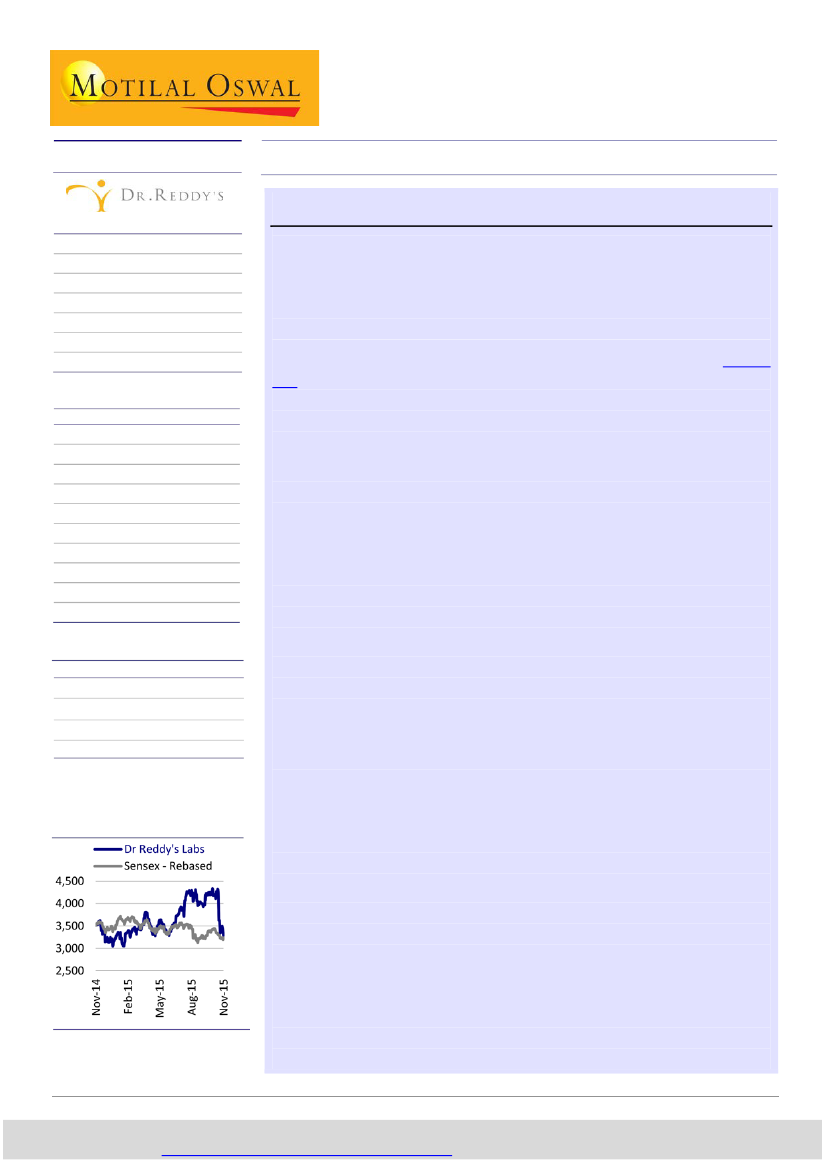
Stock Performance (1-year)
Kumar Saurabh
(Kumar.Saurabh@MotilalOswal.com); +91 22 3982 5584
Amey Chalke
(Amey.Chalke@MotilalOswal.com); +91 22 3982 5423
Investors are advised to refer through important disclosures made at the last page of the Research Report, Motilal Oswal
research is available on
www.motilaloswal.com/Institutional-Equities,
Bloomberg, Thomson Reuters, Factset and S&P Capital.

Dr. Reddy’s Lab
Exhibit 1: Warning letter details ( API Facility – Srikakulam)
Observations
1. Failed to maintain complete data
derived from all laboratory tests.
Details
Guidance
1. To ensure the reliability and completeness of
1. During the inspection unknown Custom QC
all records.
laboratory was discovered.
2. To specify the measures DRRD has
2. Sample tested by CQC failed various tests in year
implemented to ensure quality unit monitors
2012.
documentation procedures and reviews.
1. HPLC system in PD lab had no passwords to log
in.
2. Software also lacked an audit trail feature to
document all activities.
3. Access was given to unknown person to
performed injections and deletions of data.
1. Employee did not complete batch production
and control records immediately after activities
were performed.
2. Missing information was recorded on
uncontrolled sheets of paper instead of in official
document.
1. To explain how DRRD will insure that all
analyses related to product disposition and
other CGMP activities will be reviewed.
2. Provide details of the steps DRRD has taken
to prevent unauthorized access.
1. Provide an assessment of the effects of
DRRD's poor documentation practices.
2. Specify when DRRD discontinued using
unofficial poor records.
3. How to prevent the practice of maintaining
unofficial data.
1. Provide specific changes made to DRRD's
procedures and how DRRD intend to ensure
oversight from quality unit over management
of batch records.
2. Provide How DRRD will implement a reliable
document control system
Source: MOSL, Company
2.Failed to prevent unauthorized access
or changes to data
3. Failed to record activities at the time
they are performed
1. Observer found copies of unused/partially used
4. Failure to control the issuance, revision,
records and raw data in the waste areas. These
superseding and withdrawal of all
controlled documents had not been completed or
documents with maintenance of revision
archived in accordance with SOP on
histories.
documentation practices.
Exhibit 2: Warning letter details ( API Facility – Miryalguda)
Observations
Details
Guidance
1. Failure to adequately investigate out-of-
1. DRRD's response on establishing root causes for 1. Explain plans to revalidate the
specification results and implement
the batch failures were inadequate.
manufacturing process for API
appropriate corrective actions
1. Found prefilled and photocopies labels for API
in the garbage.
2. DRRD's response related to Photocopying was
inadequate.
1. Provide improved procedures to reconcile
the quantities of label issued and for ensuring
that DRRD use the correct labels in
manufacturing operations.
2. Failure to maintain all quality-related
documents appropriately
3.Failure to prevent unauthorized access
or changes to data
1. Explain the discrepancy between the report
of QC analyst and DRRD's assertion that no
1. QC analysts were authorized to release product such deviations occurred.
in SAP inventory management system.
2. Explain the improvements made to SAP
2. These responsibilities can’t be shared with QC system.
laboratory analysts.
3. Explain how SAP system has been re-
configured to reflect the quality unit's
monitoring of QC decisions.
1. DRRD had not recorded identification numbers
1. Provide data to demonstrate that sample
4. Failure to identify storage containers for in product batch records.
bags DRRD has substituted do not affect quality
intermediates in batch production records. 2. DRRD had not implemented necessary controls
of intermediates.
to prevent mix-ups and contamination.
Source: MOSL, Company
26 November 2015
2

Dr. Reddy’s Lab
Exhibit 3: Warning letter details (Formulation facility – Duvvada)
Observations
Details
Guidance
1. The management failed to intervene and
allowed the filing process to continue
uninterrupted – where it observed malfunction in
the transport mechanism of vials.
1. Failed to thoroughly investigate any
2. Investigator observed manual intervention on
unexplained discrepancy a batch or any of conveyor belt as it was not operational.
its components.
3. Failed to simulate these interventions during
media fills. Did not initiate incident report to
investigate malfunction.
4. DRRD response was inadequate and it is a
repeat violation from 2008 inspection.
1. Provide plan to improve DRRD's
investigations of critical process deviations.
2. Give details how the critical interventions
that may compromise the sterility of a product
will be minimized in your aseptic processing
operations.
2. Failed to follow appropriate written
procedures designed to prevent
microbiological contamination of drug
products purporting to be sterile.
1. Provide the findings of a risk assessment to
determine the effects of DRRD's exclusion
1. Media fill record reconciliation documentation criteria on all products manufactured during
failed to include accounting of rejected units from reference period.
each batch.
2. Provide revised media fill procedures to
2. DRRD response was inadequate.
demonstrate how DRRD's have modified
exclusion criteria and ensured that media fills
accurately.
1. Assess the effects of lack of adequate visual
inspection procedures and training on all the
3. Failed to establish adequate written
1. Procedures for qualifying the operators that
quality of all batches inspected by operators.
procedures for production and process
perform visual inspection are unacceptable.
2. Provide summary of findings – noting
controls designed to assure that the drug 2. The challenge test set vials used to qualify
whether each affected produt was distributed
products you manufacture have the
operators were inadequate because particle size in
or rejected.
identity, strength, quality, and purity they the kits is not specified.
3. Describe action DRRD has taken to insure
purport.
3. DRRD's response was inadequate.
parental rug does not include particulate
matter.
Source:
Key highlights
Warning letters:
The company’s facilities based in Srikakulam, Duvvada and
Miryalaguda were inspected in November 2014, February 2015 and January
2015 respectively. The inspection culminated into several 483 observations in
OAI categories. However, as response given by the DRRD to US FDA related to
these observations was found unsatisfactory, the US FDA has issued warning
letters to all three facilities. The company will respond to the FDA warning letter
within the next 15 days. The company’s response will likely highlight the
remediation steps already taken since the inspections.
Priorities post warning letters:
1) to maintain adequate product supply in the
market. 2) Remediation of all facilities and 3) to file for site transfer for key
products. However, DRRD has already de-risked some of the key products from
Srikakulam facility.
Gleevec:
API is outsourced from the third party and the company is expected to
launch this product post Sun pharma’s exclusivity.
Guidance by US FDA:
US FDA needs DRRD to focus on third party verification
and implementation across the manufacturing network. The company has not
done any third party verification till date.
26 November 2015
3

Dr. Reddy’s Lab
Site transfer:
It is a cumbersome activity that includes lot of work related to
filings. However, in some cases, DRRD can take different strategy of API
outsourcing which is easier.
Impact on Injectables:
Currently, injectable contribute 20% of total sales and
much higher in terms of profitability. However, very large part of injectable
manufacturing is already outsourced. So the impact on injectable’s sales and
profitability would be minimal.
Other inspections:
Bachupally was inspected in June’2015 has also received
some 483 observations. However, these observations are minor.
Oncology approvals:
Pending approvals from Duvvada facility are in the range of
4-5. However, only 1-2 product approvals are expected in the near term.
Warning letters are divided into following categories:
Documentation control,
practices & control, laboratory testing procedures, Adequacy of standard
operating procedures and incident investigating practices.
Filing and launch timelines delayed:
The company indicated that ANDAs filing
and launches will be delayed until the resolution is achieved. However, the
company could continue filing oncology products with partner (in the near
term).
26 November 2015
4

Dr. Reddy’s Lab
Story in charts
Exhibit 4: Formulation led sales growth (INR b)
Formulations (INR b)
API (INR b)
Exhibit 5: India formulation business
19.8
15.1
25
25
28
31
10.6
DF Revenue (INR b)
YoY Growth (%)
16.5
12.6
7.9
160
13.7
16.0
18.0
20
49
20
53
24
70
31
83
24
105
121
133
142
10
FY10
12
FY11
13
FY12
15
FY13
16
FY14
18
21
24
28
FY10 FY11 FY12 FY13 FY14 FY15 FY16E FY17E FY18E
Source: Company, MOSL
FY15 FY16E FY17E FY18E
Source: Company, MOSL
Exhibit 6: US Sales to grow at 7-8% CAGR over FY15-18E
Core US sales (INR b)
77
56
32
11
7
FY10
FY11
FY12
FY13
FY14
18
1
10
YoY Growth (%)
Exhibit 7: PSAI business to see moderate growth ahead
PSAI Sales (INR b)
21
9
-4
-22
20
FY10
20
FY11
24
FY12
31
25
25
28
31
29
24
6
-1
YoY Growth (%)
11
11
18
FY15 FY16E FY17E FY18E
Source: Company, MOSL
FY13 FY14E FY15 FY16E FY17E FY18E
Source: Company, MOSL
Exhibit 8: EBITDA margins to bounce back in FY18E
Gross Margin (%)
EBITDA Margin (%)
Exhibit 9: EBITDA growth to improve in FY18E
EBITDA (INR b)
52
28
25
6
32
FY14
33
42
0
42
Growth (%)
61.3 59.5 60.0
55.5 57.9 58.9 55.4 58.2 57.6
24.5 21.3 24.0 22.6 25.8 23.8 24.8
20.2 21.0
-6
14
FY10 FY11 FY12 FY13 FY14 FY15 FY16E FY17E FY18E
Source: Company, MOSL
FY10
10
16
FY11
24
FY12
18
49
4
25
FY13
FY15 FY16E FY17E FY18E
Source: Company, MOSL
26 November 2015
5

Dr. Reddy’s Lab
Exhibit 10: Earnings growth to recover in FY18E
Core EPS (INR/ share)
0
0
0
Exhibit 11: Rich ANDA pipeline
ANDA filed
170
187
ANDA pending
193
209
220
227
138
158
66
FY11
73
FY12
81
FY13
125
FY14
130
FY15
160
160
190
68
FY09
73
FY10
75
FY11
80
FY12
65
FY13
62
FY14
73
FY15
76
YTD
FY16E FY17E FY18E
Source: Company, MOSL
Exhibit 12: R&D expense higher due to NCE research
R&D expense (INR b)
11.8
9.4
5.4
6.8
6.1
6.7
% of sales
11.5
11.7
11.5
Exhibit 13: OTC share growing in Russia sales
Rx (USD m)
OTC (USD m)
67
88
OTC ( % of sales )
105
39
36
88
27
18
12
FY14
17
19
21
23
51
26
4
FY10
5
FY11
6
FY12
8
FY13
125
FY10
145
FY11
29
165
FY12
34
170
FY13
165
FY14
157
FY15
FY15 FY16E FY17E FY18E
Source: Company, MOSL
Exhibit 14: Return ratios lower with lower margins
RoE (%)
24.1
21.6
19.7
23.3
18.7
17.2
18.7
RoCE (%)
Exhibit 15: Fixed asset turnover (x)
Gross block (INR b)
2.4
2.2
1.9
2.2
Fixed Asset turnover
19.9
16.9
20.3
19.7
17.4
17.0
17.5
18.0
30
2.1
2.1
1.9
1.8
96
1.8
107
3.1
16.8
38
44
53
63
72
85
FY10
2.5
FY11
FY12
FY13 FY14
FY15 FY16E FY17E FY18E
Source: Company, MOSL
FY10 FY11 FY12 FY13 FY14 FY15 FY16E FY17E FY18E
Source: Company, MOSL
26 November 2015
6

Dr. Reddy’s Lab
Financials and valuations
Key assumptions
Segment growth (%)
USA
India
Europe
Russia
Others
PSAI
Innovative products
Total Sales
Expenses
Cost of sales (%)
EBITDA Margin (%)
2011
13.0
15.1
(12.6)
19.1
17.3
(3.7)
34.6
6.3
42.1
21.0
2011
74,693
6.3
1,118
15,660
10.3
21.0
4,147
11,513
0
189
0
12,442
506.0
12,442
1,403
11.3
11,099
939.2
2012
67.9
10.6
(2.0)
22.1
16.0
21.2
57.3
29.5
41.1
24.5
2012
96,738
29.5
1,669
23,742
51.6
24.5
6,254
17,488
0
0
19,157
54.0
19,157
4,204
21.9
12,428
12.0
2013
18.7
12.6
(6.6)
27.5
41.7
28.9
11.9
20.2
44.6
21.3
2013
116,266
20.2
3,634
24,763
4.3
21.3
6,237
18,526
0
118
365
21,677
13.2
21,677
4,900
22.6
13,682
10.1
2014
46.1
7.9
(9.7)
17.2
33.0
(21.9)
1.1
13.7
41.8
24.0
2014
132,171
13.7
2,411
31,699
28.0
24.0
7,085
24,614
0
79
329
26,616
22.8
26,616
5,093
19.1
21,188
54.9
2015E
17.0
13.7
3.2
(10.6)
77.4
6.2
(28.2)
12.1
42.4
22.6
2015
148,189
12.1
2,871
33,472
5.6
22.6
8,103
25,369
0
77
0
28,163
5.8
28,163
5,984
21.2
22,179
4.7
2016E
17.7
16.5
21.5
(20.8)
0.5
(1.3)
100.0
9.6
38.7
25.8
2016E
162,376
9.6
1,756
41,893
25.2
25.8
9,418
32,475
0
362
-337
34,207
21.5
34,207
6,944
20.3
27,263
22.9
2017E
0.5
16.0
15.6
15.6
15.6
10.5
25.0
8.1
40.5
23.8
2017E
175,454
8.1
2,270
41,758
-0.3
23.8
9,738
32,020
0
217
0
34,073
-0.4
34,073
6,815
20.0
27,259
0.0
2018E
10.0
18.0
15.0
15.0
15.0
10.9
25.0
12.9
40.0
24.8
2018E
198,064
12.9
2,650
49,120
17.6
24.8
11,092
38,028
0
202
0
40,476
18.8
40,476
8,095
20.0
32,381
18.8
Income Statement
Y/E March
Net Sales
Change (%)
Other Income
EBITDA
Change (%)
Margin (%)
Depreciation & Amort.
EBIT
Int. and Finance Charges
Net Interest Exp
Forex (Gains)/Losses
PBT & EO Expense
Change (%)
PBT after EO Expense
Tax
Tax Rate (%)
Adjusted Net Profit
Change (%)
(INR Million)
Balance Sheet
Y/E March
Equity Share Capital
Reserves
Net Worth
Loans
Deferred Liabilities/Tax
Capital Employed
Gross Block
Less: Accum. Deprn.
Net Fixed Assets
Investments
Goodwill/Intangibles
Curr. Assets
Inventory
Account Receivables
Cash and Bank Balance
Others
Curr. Liability & Prov.
Account Payables
Other Current Liabilities
Net Current Assets
Appl. of Funds
E: MOSL Estimates
2011
846
45,144
45,990
23,503
87
69,580
38,359
14,714
29,642
622
15,246
47,560
16,059
17,615
5,729
8,157
23,490
8,480
15,010
24,070
69,580
2012
848
56,596
57,444
32,210
-833
88,821
44,064
18,086
33,246
11,558
13,529
59,179
19,352
25,339
7,379
7,109
28,691
9,502
19,189
30,488
88,821
2013
849
72,256
73,105
36,678
-1,669
108,114
52,958
21,213
37,814
18,131
14,021
68,751
21,600
31,972
5,136
10,043
30,603
11,862
18,741
38,148
108,114
2014
851
89,950
90,801
44,742
-3,310
132,233
63,444
25,695
44,424
26,384
14,697
78,664
23,992
33,037
8,451
13,184
31,936
10,503
21,433
46,728
132,233
2015
852
110,450
111,302
43,126
-4,013
150,414
72,011
30,040
48,090
38,871
16,430
85,580
25,529
40,755
5,394
13,901
38,556
10,660
27,896
47,024
150,415
2016E
852
133,733
134,585
36,164
-4,013
166,736
85,071
35,543
55,646
30,262
16,227
98,148
29,220
39,990
12,701
16,238
33,548
12,007
21,541
64,600
166,736
2017E
852
156,207
157,059
36,164
-4,013
189,210
96,130
41,602
60,647
30,262
16,227
119,620
33,042
43,210
25,822
17,545
37,547
13,577
23,969
82,074
189,210
(INR Million)
2018E
852
183,804
184,656
31,164
-4,013
211,807
107,190
48,161
65,148
30,262
16,228
141,843
36,840
48,779
34,437
21,787
41,674
15,138
26,536
100,169
211,807
26 November 2015
7

Dr. Reddy’s Lab
Financials and valuations
Ratios
Y/E March
Basic (INR)
EPS
Cash EPS
BV/Share
DPS
Payout (%)
Valuation (x)
P/E
PEG (x)
P/BV
EV/Sales
EV/EBITDA
Dividend Yield (%)
Return Ratios (%)
RoE
RoCE
Working Capital Ratios
Fixed Asset Turnover (x)
Debtor (Days)
Inventory (Days)
Working Capital (Days)
Leverage Ratio
Current Ratio (x)
Debt/Equity (x)
2011
65.6
90.1
271.8
11.2
20.2
2012
73.3
110.2
338.7
13.7
18.2
0.56302
2013
80.6
117.3
430.5
13.8
16.3
0.5375
2014
124.6
166.2
533.8
18.0
16.6
2015
130.2
177.7
653.2
20.0
17.9
2016E
160.0
215.3
789.8
24.0
17.6
2017E
160.0
217.1
921.7
24.0
17.6
2018E
190.0
255.1
1,083.7
28.5
17.6
0.0
46.2
3.9
10.0
6.1
24.9
0.4
42.0
4.2
7.9
5.1
23.9
0.4
27.2
0.5
6.3
4.4
18.5
0.5
26.0
5.6
5.2
3.9
17.2
0.6
21.2
0.9
4.3
3.5
13.6
0.7
21.2
NA
3.7
3.2
13.3
0.7
17.8
0.9
3.1
2.7
11.1
0.8
24.1
16.8
21.6
19.7
18.7
17.2
23.3
18.7
19.9
16.9
20.3
19.7
17.4
17.0
17.5
18.0
2.2
86
78
90
2.3
96
73
87
2.4
100
68
104
2.3
91
66
106
2.2
100
63
103
2.1
90
66
117
1.9
90
69
117
1.9
90
68
121
2.0
0.5
2.1
0.6
2.2
0.5
2.5
0.5
2.2
0.4
2.9
0.3
3.2
0.2
3.4
0.2
Cash Flow Statement
Y/E March
Op. Profit/(Loss) before Tax
Interest/Dividends Recd.
Direct Taxes Paid
(Inc)/Dec in WC
CF from Operations
(inc)/dec in FA
Free Cash Flow
(Pur)/Sale of Investments
CF from Investments
Change in net worth
(Inc)/Dec in Debt
Other Items
Dividend Paid
CF from Fin. Activity
Inc/Dec of Cash
Add: Beginning Balance
Closing Balance
2011
15,660
929
-1,403
-6,501
8,685
-12,603
-3,918
3,531
-9,072
-5,740
8,847
-1,351
-2,224
-468
-855
6,584
5,729
2012
23,742
1,669
-4,204
-4,768
16,439
-8,141
8,298
-10,936
-19,077
-780
8,707
-920
-2,719
4,288
1,650
5,729
7,379
2013
24,763
3,151
-4,900
-9,903
13,111
-11,297
1,814
-6,573
-17,870
1,620
4,468
-836
-2,736
2,516
-2,243
7,379
5,136
2014
31,699
2,003
-5,093
-5,265
23,344
-14,371
8,973
-8,253
-22,624
-247
8,064
-1,640
-3,581
2,596
3,315
5,136
8,451
2015
33,472
2,793
-5,984
-3,353
26,929
-13,502
13,427
-12,487
-25,989
2,302
-1,617
-704
-3,979
-3,998
-3,058
8,451
5,393
2016E
41,893
1,731
-6,944
-10,270
26,410
-16,771
9,639
8,609
-8,162
805
-6,962
0
-4,785
-10,941
7,307
5,394
12,702
(INR Million)
2017E
41,758
2,053
-6,815
-4,352
32,644
-14,738
17,906
0
-14,738
-1
0
0
-4,784
-4,785
13,121
12,701
25,822
2018E
49,120
2,448
-8,095
-9,481
33,992
-15,593
18,398
0
-15,593
899
-5,000
0
-5,683
-9,784
8,615
25,822
34,437
26 November 2015
8

DR REDDY’S LAB GALLERY
DR REDDY’S LAB
OTHER COMPANIES
SECTOR UPDATES

Disclosures
This document has been prepared by Motilal Oswal Securities Limited (hereinafter referred to as Most) to provide information about the company(ies) and/sector(s), if any, covered in the report and
Dr.
be distributed by it and/or its
may
Reddy’s Lab
affiliated company(ies). This report is for personal information of the selected recipient/s and does not construe to be any investment, legal or taxation advice to you. This research report does not constitute an offer, invitation or
inducement to invest in securities or other investments and Motilal Oswal Securities Limited (hereinafter referred as MOSt) is not soliciting any action based upon it. This report is not for public distribution and has been furnished to
you solely for your general information and should not be reproduced or redistributed to any other person in any form. This report does not constitute a personal recommendation or take into account the particular investment
objectives, financial situations, or needs of individual clients. Before acting on any advice or recommendation in this material, investors should consider whether it is suitable for their particular circumstances and, if necessary, seek
professional advice. The price and value of the investments referred to in this material and the income from them may go down as well as up, and investors may realize losses on any investments. Past performance is not a guide for
future performance, future returns are not guaranteed and a loss of original capital may occur.
MOSt and its affiliates are a full-service, integrated investment banking, investment management, brokerage and financing group. We and our affiliates have investment banking and other business relationships with a some
companies covered by our Research Department. Our research professionals may provide input into our investment banking and other business selection processes. Investors should assume that MOSt and/or its affiliates are
seeking or will seek investment banking or other business from the company or companies that are the subject of this material and that the research professionals who were involved in preparing this material may educate investors
on investments in such business. The research professionals responsible for the preparation of this document may interact with trading desk personnel, sales personnel and other parties for the purpose of gathering, applying and
interpreting information. Our research professionals are paid on the profitability of MOSt which may include earnings from investment banking and other business.
MOSt generally prohibits its analysts, persons reporting to analysts, and members of their households from maintaining a financial interest in the securities or derivatives of any companies that the analysts cover. Additionally, MOSt
generally prohibits its analysts and persons reporting to analysts from serving as an officer, director, or advisory board member of any companies that the analysts cover. Our salespeople, traders, and other professionals or affiliates
may provide oral or written market commentary or trading strategies to our clients that reflect opinions that are contrary to the opinions expressed herein, and our proprietary trading and investing businesses may make investment
decisions that are inconsistent with the recommendations expressed herein. In reviewing these materials, you should be aware that any or all of the foregoing among other things, may give rise to real or potential conflicts of interest.
MOSt and its affiliated company(ies), their directors and employees and their relatives may; (a) from time to time, have a long or short position in, act as principal in, and buy or sell the securities or derivatives thereof of companies
mentioned herein. (b) be engaged in any other transaction involving such securities and earn brokerage or other compensation or act as a market maker in the financial instruments of the company(ies) discussed herein or act as an
advisor or lender/borrower to such company(ies) or may have any other potential conflict of interests with respect to any recommendation and other related information and opinions.; however the same shall have no bearing
whatsoever on the specific recommendations made by the analyst(s), as the recommendations made by the analyst(s) are completely independent of the views of the affiliates of MOSt even though there might exist an inherent
conflict of interest in some of the stocks mentioned in the research report
Reports based on technical and derivative analysis center on studying charts company's price movement, outstanding positions and trading volume, as opposed to focusing on a company's fundamentals and, as such, may not match
with a report on a company's fundamental analysis. In addition MOST has different business segments / Divisions with independent research separated by Chinese walls catering to different set of customers having various
objectives, risk profiles, investment horizon, etc, and therefore may at times have different contrary views on stocks sectors and markets.
Unauthorized disclosure, use, dissemination or copying (either whole or partial) of this information, is prohibited. The person accessing this information specifically agrees to exempt MOSt or any of its affiliates or employees from, any
and all responsibility/liability arising from such misuse and agrees not to hold MOSt or any of its affiliates or employees responsible for any such misuse and further agrees to hold MOSt or any of its affiliates or employees free and
harmless from all losses, costs, damages, expenses that may be suffered by the person accessing this information due to any errors and delays. The information contained herein is based on publicly available data or other sources
believed to be reliable. Any statements contained in this report attributed to a third party represent MOSt’s interpretation of the data, information and/or opinions provided by that third party either publicly or through a subscription
service, and such use and interpretation have not been reviewed by the third party. This Report is not intended to be a complete statement or summary of the securities, markets or developments referred to in the document. While we
would endeavor to update the information herein on reasonable basis, MOSt and/or its affiliates are under no obligation to update the information. Also there may be regulatory, compliance, or other reasons that may prevent MOSt
and/or its affiliates from doing so. MOSt or any of its affiliates or employees shall not be in any way responsible and liable for any loss or damage that may arise to any person from any inadvertent error in the information contained in
this report. MOSt or any of its affiliates or employees do not provide, at any time, any express or implied warranty of any kind, regarding any matter pertaining to this report, including without limitation the implied warranties of
merchantability, fitness for a particular purpose, and non-infringement. The recipients of this report should rely on their own investigations.
This report is intended for distribution to institutional investors. Recipients who are not institutional investors should seek advice of their independent financial advisor prior to taking any investment decision based on this report or for
any necessary explanation of its contents.
Most and it’s associates may have managed or co-managed public offering of securities, may have received compensation for investment banking or merchant banking or brokerage services, may have received any compensation for
products or services other than investment banking or merchant banking or brokerage services from the subject company in the past 12 months.
Most and it’s associates have not received any compensation or other benefits from the subject company or third party in connection with the research report.
Subject Company may have been a client of Most or its associates during twelve months preceding the date of distribution of the research report
MOSt and/or its affiliates and/or employees may have interests/positions, financial or otherwise of over 1 % at the end of the month immediately preceding the date of publication of the research in the securities mentioned in this
report. To enhance transparency, MOSt has incorporated a Disclosure of Interest Statement in this document. This should, however, not be treated as endorsement of the views expressed in the report.
Motilal Oswal Securities Limited is registered as a Research Analyst under SEBI (Research Analyst) Regulations, 2014. SEBI Reg. No. INH000000412
There are no material disciplinary action that been taken by any regulatory authority impacting equity research analysis activities
Analyst Certification
The views expressed in this research report accurately reflect the personal views of the analyst(s) about the subject securities or issues, and no part of the compensation of the research analyst(s) was, is, or will be directly or
indirectly related to the specific recommendations and views expressed by research analyst(s) in this report. The research analysts, strategists, or research associates principally responsible for preparation of MOSt research receive
compensation based upon various factors, including quality of research, investor client feedback, stock picking, competitive factors and firm revenues
Disclosure of Interest Statement
Analyst ownership of the stock
Served as an officer, director or employee
DR. REDDY’S LAB
No
No
A graph of daily closing prices of securities is available at www.nseindia.com and http://economictimes.indiatimes.com/markets/stocks/stock-quotes
Regional Disclosures (outside India)
For U.S.
This report is not directed or intended for distribution to or use by any person or entity resident in a state, country or any jurisdiction, where such distribution, publication, availability or use would be contrary to law, regulation or which
would subject MOSt & its group companies to registration or licensing requirements within such jurisdictions.
Motilal Oswal Securities Limited (MOSL) is not a registered broker - dealer under the U.S. Securities Exchange Act of 1934, as amended (the"1934 act") and under applicable state laws in the United States. In addition MOSL is not a
registered investment adviser under the U.S. Investment Advisers Act of 1940, as amended (the "Advisers Act" and together with the 1934 Act, the "Acts), and under applicable state laws in the United States. Accordingly, in the
absence of specific exemption under the Acts, any brokerage and investment services provided by MOSL, including the products and services described herein are not available to or intended for U.S. persons.
This report is intended for distribution only to "Major Institutional Investors" as defined by Rule 15a-6(b)(4) of the Exchange Act and interpretations thereof by SEC (henceforth referred to as "major institutional investors"). This
document must not be acted on or relied on by persons who are not major institutional investors. Any investment or investment activity to which this document relates is only available to major institutional investors and will be
engaged in only with major institutional investors. In reliance on the exemption from registration provided by Rule 15a-6 of the U.S. Securities Exchange Act of 1934, as amended (the "Exchange Act") and interpretations thereof by
the U.S. Securities and Exchange Commission ("SEC") in order to conduct business with Institutional Investors based in the U.S., MOSL has entered into a chaperoning agreement with a U.S. registered broker-dealer, Motilal Oswal
Securities International Private Limited. ("MOSIPL"). Any business interaction pursuant to this report will have to be executed within the provisions of this chaperoning agreement.
The Research Analysts contributing to the report may not be registered /qualified as research analyst with FINRA. Such research analyst may not be associated persons of the U.S. registered broker-dealer, MOSIPL, and therefore,
may not be subject to NASD rule 2711 and NYSE Rule 472 restrictions on communication with a subject company, public appearances and trading securities held by a research analyst account.
For Hong Kong:
This report is distributed in Hong Kong by Motilal Oswal capital Markets (Hong Kong) Private Limited, a licensed corporation (CE AYY-301) licensed and regulated by the Hong Kong Securities and Futures Commission (SFC)
pursuant to the Securities and Futures Ordinance (Chapter 571 of the Laws of Hong Kong) “SFO”. As per SEBI (Research Analyst Regulations) 2014 Motilal Oswal Securities (SEBI Reg No. INH000000412) has an agreement with
Motilal Oswal capital Markets (Hong Kong) Private Limited for distribution of research report in Kong Kong. This report is intended for distribution only to “Professional Investors” as defined in Part I of Schedule 1 to SFO. Any
investment or investment activity to which this document relates is only available to professional investor and will be engaged only with professional investors.”
Nothing here is an offer or solicitation of these securities, products and services in any jurisdiction where their offer or sale is not qualified or exempt from registration. The Indian Analyst(s) who compile this report is/are not located in
Hong Kong & are not conducting Research Analysis in Hong Kong.
For Singapore
Motilal Oswal Capital Markets Singapore Pte Limited is acting as an exempt financial advisor under section 23(1)(f) of the Financial Advisers Act(FAA) read with regulation 17(1)(d) of the Financial Advisors Regulations and is a
subsidiary of Motilal Oswal Securities Limited in India. This research is distributed in Singapore by Motilal Oswal Capital Markets Singapore Pte Limited and it is only directed in Singapore to accredited investors, as defined in the
Financial Advisers Regulations and the Securities and Futures Act (Chapter 289), as amended from time to time.
In respect of any matter arising from or in connection with the research you could contact the following representatives of Motilal Oswal Capital Markets Singapore Pte Limited:
Kadambari Balachandran
Email : kadambari.balachandran@motilaloswal.com
Contact : (+65) 68189233 / 65249115
Office Address : 21 (Suite 31),16 Collyer Quay,Singapore 04931
26 November 2015
Motilal Oswal Tower, Level 9, Sayani Road, Prabhadevi, Mumbai 400 025
Phone: +91 22 3982 5500 E-mail: reports@motilaloswal.com
Motilal Oswal Securities Ltd
10