7 December 2015
Metals Weekly
Valuations: Indian companies
Company
Steel
Price EV/EBITDA (x) P/B (x)
(INR) FY16E FY17E FY15
240 12.3
972 9.4
93 13.3
47 -42.1
79
41
92
335
147
92
8.3
4.3
7.1
7.1
4.0
5.7
9.9
7.2
11.1
31.3
6.7
3.2
6.7
6.1
4.4
7.4
1.3
1.1
0.4
0.4
0.8
0.8
0.5
5.2
1.4
1.1
Metal Prices
CMP
4-Dec
% 27-Nov
change since
%
1-Oct
%
1-Apr
Ta ta Steel
JSW Steel
JSPL
SAIL
Non-Ferrous
Hi nda l co
Na l co
Veda nta
Mining
Coa l Indi a
HZL
NMDC
TMT- Mumba i (INR/ton)
HRC- Mumba i (INR/ton)
HRC (USD/ton) fob CIS
24,700
21,577
263
0 24,600
-2 22,022
-2
268
-1 12,450
-4 16,900
-10
45
2
72
-6
193
2
2
-1
-1
-1
-2
0
1
-3
1,480
99
2,901
1,542
103
545
4,636
299
244
-8 26,800
-9 23,729
-13
300
-19 15,100
-17 19,600
-29
56
-7
79
1
180
-5
-4
-9
-10
-9
-10
-10
-11
-26
1,579
105
3,171
1,691
113
594
5,178
339
319
-23 31,900
-22 27,631
-33
390
-30 17,600
-19 20,000
-25
53
-24
97
-27
248
-15
-9
-27
-26
-21
4
-23
-20
-29
1,766
111
3,938
2,069
129
511
6,020
378
334
Sponge i ron - Ra i pur (INR/ton)
12,300
Pi g i ron - Ra i pur (INR/ton)
16,300
Iron ore s pot (USD/ton) cfr Chi na
40
Coki ng coa l (USD/ton) fob Aus .
74
Shred. s cra p (USD/ton) Rotterda m
182
LME Spot (USD/ton)
Indi a n pri ces (INR ‘000/ton)
LME i nventori es (‘000 ton)
LME Spot (USD/ton)
Indi a n pri ces (INR ‘000/ton)
LME i nventori es (‘000 ton)
LME Spot (USD/ton)
Indi a n pri ces (INR ‘000/ton)
LME i nventori es (‘000 ton)
1,503
100
2,879
1,529
102
532
4,637
303
238
Note: Detailed table on pg 24
Source: MOSL
Valuations: Global companies
Price
Mining
AUD 17.93
BHP
AUD 1.895
FMG
Ri o Ti nto
AUD 44.38
USD 9.99
Va l e
USD 4.11
Teck Res .
Steel
EUR 3.972
A. Mi tta l
KRW 170.5
Pos co
USD 7.77
US Steel
USD 41.1
Nucor
JPY 2008.5
JFE
BRL 5.44
Gerda u
CNY 5.53
Ba o Steel
Non Ferrous
USD 9.34
Al coa
NOK 31.6
Hydro
HKD 2.68
Rus a l
Note: Detailed on pg 24
EV/EBITDA (x) P/B (x)
CY15 CY16 CY15
6.7
4.3
6.1
5.9
5.6
5.0
6.5
15.3
8.8
8.0
6.4
9.0
6.8
4.9
6.6
5.7
4.6
6.7
5.8
5.7
4.6
6.3
6.6
6.9
6.9
5.9
7.7
7.2
6.1
9.6
NM
NM
NM
0.3
0.2
0.2
0.4
0.4
1.7
NM
1.1
0.8
1.0
0.9
NM
Gol d (INR/10gms )
25,143
Sl i ver (INR/1kg)
33,754
Lea d Spot LME (USD/ton)
1,669
FC 6-8% C ba s i s 60% Cr (USD/l b Cr)
1.11
INR/USD
BDI
0 25,049
0 33,683
3 1,614
-1
1.12
-2 25,754
-1 34,126
0 1,663
-1
1.12
-4 26,169
-9 36,916
-8 1,808
-1
1.12
66.7
0
66.9
2
65.6
7
62.3
563
-4
584
-37
888
-6
596
Source: Meta l Bul l eti n, Bl oomberg, Steel Mi nt, MOSL
NMDC cuts lump prices by ~INR300/t, second time in the week
India long product (TMT Mumbai) prices were flat WoW. Sponge iron
prices fell 1.2% WoW. Domestic scrap prices were up 3.7% WoW. Pellet
prices were unchanged.
India import parity HRC prices were down 2% WoW on lower import HRC
offers.
NMDC has cut iron ore lump prices by ~INR300/t, second time within a
week on fall in global iron ore prices and domestic over-supply.
Iron ore (China cfr) prices were down 10% WoW. Coking coal prices rose
2% WoW while thermal coal fell 2%.
EU HRC prices were down 1.4% WoW. CIS export HRC prices were down
1.9% WoW, benchmarking against Chinese export prices. China domestic
HRC prices fell 1.3% WoW while rebar prices fell by a sharp 6.3% WoW.
Rotterdam scrap prices were down 6% WoW.
Aluminum (cash LME) rose 2% WoW. US spot premiums are at higher
levels getting support from announcement of closure of a few local mills.
Alumina prices fell 6% WoW, following the 7% decline last week.
Copper (cash LME) was flat WoW. Zinc (cash LME) was down 1% WoW.
Lead was up 3% WoW.
Source: Bloomberg
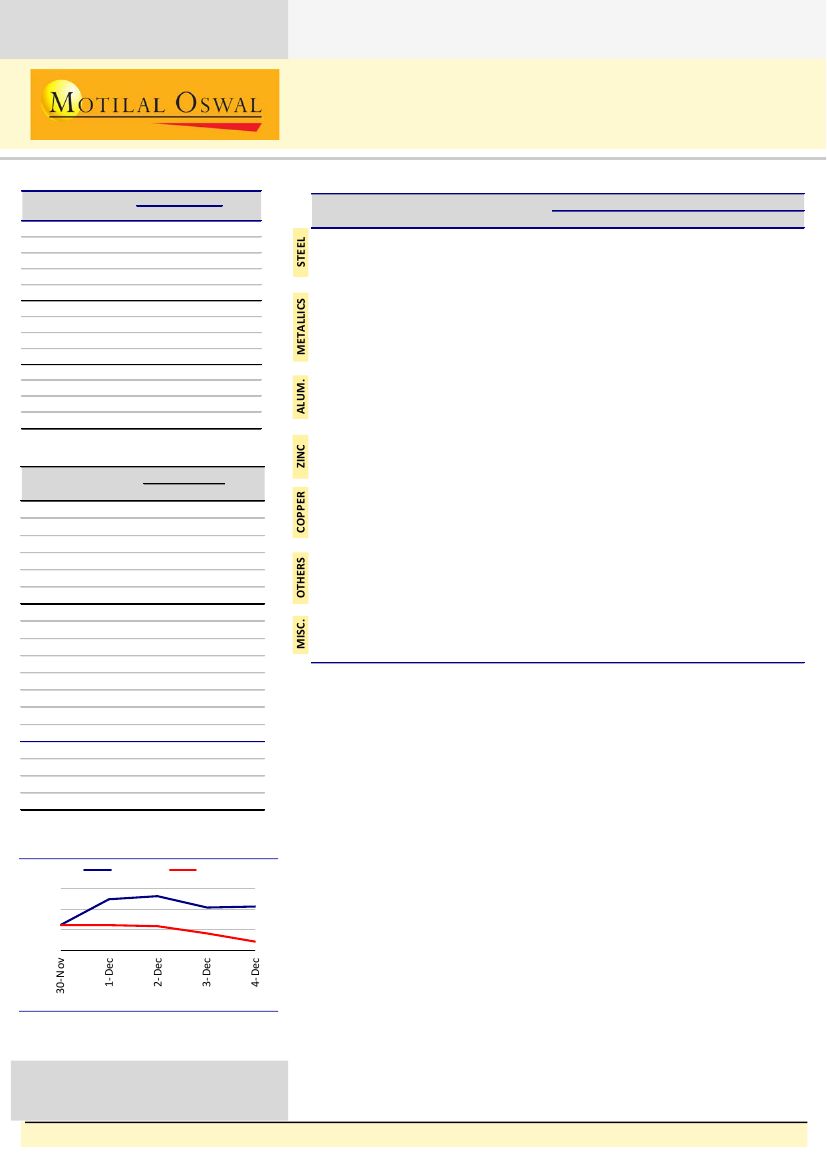
BSE Metals Index v/s Sensex
BSE Metal
105
102
100
97
Sensex
Source: Bloomberg
Note: Indexed to 100 on 30 November 2015
Stock performance table on pg 25
Investors are advised to refer through
important disclosures made at the last
page of the Research Report.
Sanjay Jain
(SanjayJain@MotilalOswal.com); +91 22 3982 5412 /
Dhruv Muchhal
(Dhruv.Muchhal@MotilalOswal.com)