Havells India
BSE Sensex
25,150
S&P CNX
7,650
14 December 2015
Update | Sector: Capital Goods
CMP: INR303
TP: INR340 (+12%)
Buy
Sylvania sales a positive
Stock Info
Bloomberg
Equity Shares (m)
M.Cap. (INR b)/(USD b)
52-Week Range (INR)
1, 6, 12 Rel. Per (%)
Avg Val (INR m)
Free float (%)
Management focus shifts to India
HAVL IN
623.9
189/2.8
316/236
21/18/22
478
38.4
Havells has signed a definitive agreement with Shanghai Feilo Accoustics to divest
80% stake in Sylvania for EUR149mn.
Sylvania performance since acquisition uninspiring; divestment by Havells
releases cash and management bandwidth.
Raise estimates and TP on higher other income and revised multiple (30x) for
standalone business; maintain Buy with a TP of INR340.
Financial Snapshot (INR Billion)
Y/E Mar
2015 2016E 2017E
Net Sales
85.7
85.7 65.3
EBITDA
Adj PAT
Adj EPS (INR)
EPS Gr. (%)
BV/Sh(INR)
RoE (%)
RoCE (%)
P/E (x)
P/BV (x)
7.2
5.2
8.3
-4.7
29.1
28.4
27.7
36.7
10.4
8.9
5.5
8.9
7.5
38.2
23.3
33.2
34.1
7.9
9.1
7.1
11.4
28.3
43.7
26.1
35.8
26.6
6.9
Havells signs a definitive agreement to divest 80% stake in Sylvania for an
equity value of EUR149m
:
Havells Holdings Limited (100% subsidiary of Havells)
will sell its stake in Havells Malta while Havells Ltd. will sell its stake in Havells
EXIM Limited to Shanghai Feilo Accoustics for EUR149mn, which corresponds to
80% of the stake sale to be received by February 2016 (the balance 20% in
Havells Malta to be sold over the next five years). EV of the deal is EUR263m
and implies an EV/EBITDA of 9.6x FY17E. Havells subsidiaries in the US, Chile,
Thailand and Brazil are not part of the sale—Chile subsidiary has been closed
down while Thailand and Brazil would be sold depending on their profitability.
S
ylvania performance since acquisition uninspiring:
Havells acquired Sylvania
to have a global presence in the lighting market; however, given the weakness
in European economy, the demand for Sylvania’ products remains muted; an
adverse cost structure further hurt performance. Havells tried to turn around
Sylvania performance by changing the top management and introducing
restructuring plans like Phoenix (FY08-09) and Prakaram (FY10-11). However,
operations have remained at breakeven levels; this, along with a shift globally
toward LEDs, forced management to look for an exit from this business.
Key takeaways from conference call with management
:
a) The four retained
subsidiaries incurred a loss of EUR13mn in CY15 and the management intent is
to turn around Brazil and Thailand, which would then be sold to Feilo (Chile has
already been closed). There would be a loss of EUR12m-15m if not sold while a
sale could fetch EUR8m. b) Brazil and Thailand are already at EBITDA breakeven
on cost cutting measures and improvement in sales. c) Looking at acquisitions in
the domestic market; the move complements Havells product portfolio,
distribution and brand image.
Shareholding pattern (%)
As on
Sep-15 Jun-15 Sep-14
Promoter
61.6
61.6
61.6
DII
3.6
3.1
0.4
FII
23.2
25.6
29.3
Others
11.6
9.6
8.7
FII Includes depository receipts
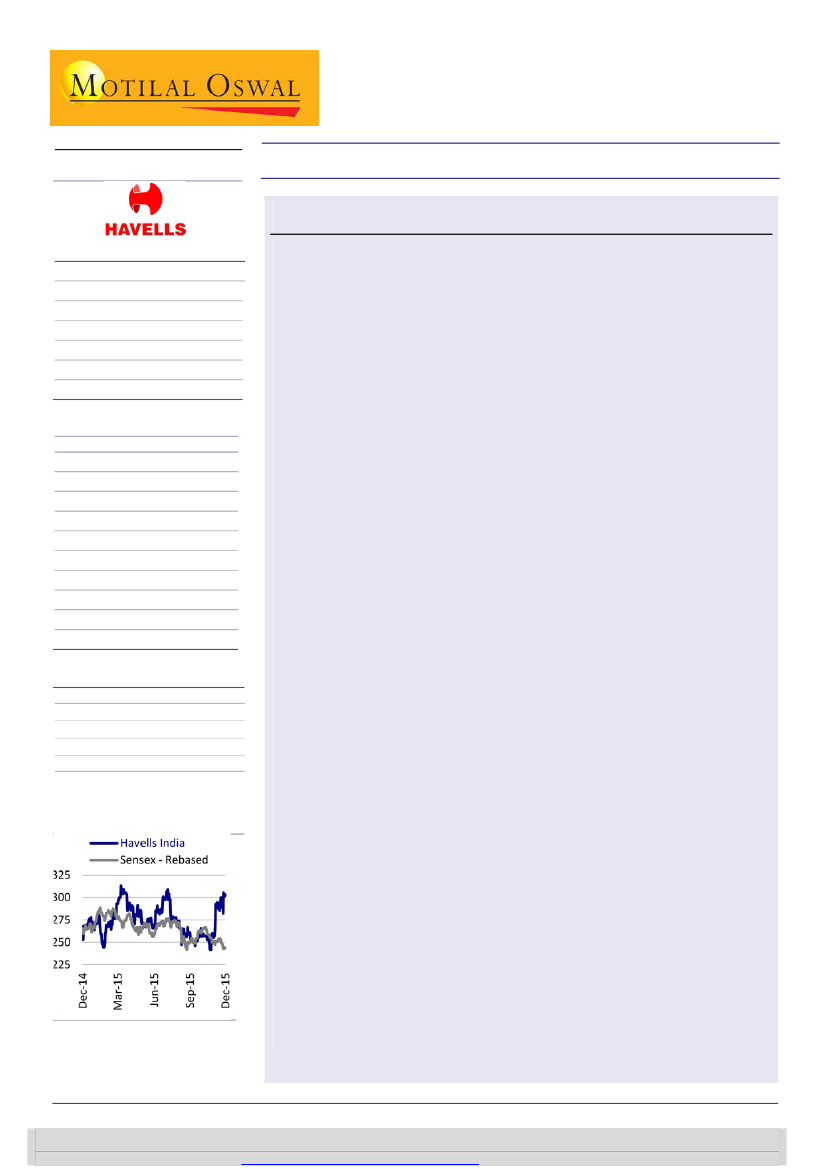
Stock Performance (1-year)
Valuation and view:
Maintain
Buy
with a revised target price of
INR340
We upgrade our standalone EPS by
13
%
to account for higher other
income and share of profit from Sylvania (20% stake retained). We apply a 30x
(28x earlier) multiple on our standalone EPS to get our target price of
INR340. We assign zero value to subsidiaries.
Ankur Sharma
(Ankur.vsharma@MotilalOswal.com); +91 22 3982 5449
Amit Shah
(Amit.Shah@MotilalOswal.com); +91 22 3029 5126
Investors are advised to refer through important disclosures made at the last page of the Research Report.
Motilal Oswal research is available on
www.motilaloswal.com/Institutional-Equities,
Bloomberg, Thomson Reuters, Factset and S&P Capital.

Havells India
Havells to divest 80% stake in Sylvania for an equity value of EUR149m
(implied valuation of EUR186m for Sylvania)
Havells has proposed to divest 80% stake in Havells Malta and Havells Exim at an
equity value of EUR149m to Chinese company Shanghai Feilo Acoustics limited; this
implies a valuation of EUR186m for Sylvania. Subsidiaries in the US, Chile, Brazil and
Thailand would not be part of the transaction (~EUR11m loss in CY16). Shanghai
Felio Accoustics would also take over the pension liabilities (EUR50m) and the net
debt on the books of Sylvania (EUR27m), implying an EV of EUR263m and an
EV/EBITDA of 9.6x for the deal. We note that Havells had bought Sylvania for an EV
of EUR227mn in FY08 and has made an equity investment of INR9.8b in in the
company over the last eight years.
Havells will divest 80% of the stake in both the entities by February 2016 and the
balance 20% in Havells Malta will be divested over the next five years, while Havells
Exim’s balance 20% stake would be divested by 2017. Havells will retain four units
(Brazil, Chile, Thailand and the US), which had cumulative sales of INR4b (~12% of
total sales of Sylvania) and reported net loss of INR1.3b in FY15. CY15 loss has
declined to EUR13m. Brazil and Chile subsidiaries are already breaking even at the
EBITDA level, driven by cost cuts and increased sales. Management aims to bring the
subsidiaries back to profitability and sell them to Feilo.
Feilo is amongst the top 10 lighting companies in China, with experience in large-
scale projects—including Shanghai Tower and Beijing Olympic Park. The company is
also the existing JV partner of Havells China venture. Felio is listed on Shanghai Stock
Exchange with current market capitalization of ~USD2b. The estimated revenue for
CY15 is ~EUR750 million, with EBDITA of ~EUR125m.
Shanghai Felio Acoustics Ltd. is principally engaged in the manufacturing and
distribution of lighting equipment. The company is involved in the manufacture and
sale of light source electrical appliances, lighting products, the sale and engineering
service of audio products and installation works of lighting equipment. Through its
subsidiaries, the company is also engaged in the manufacture and sale of lighting
electrical appliances, lamps, various pot light source products and automobile parts,
electronic products and electrical engineering supplies, as well as the operation of
securities business.
Shanghai Feilo amongst the top 10 lighting companies in China
Divestment of Sylvania stake to improve focus on better RoE generating
business
We believe that the Sylvania sale is positive for the company as it will improve focus
on the domestic business, which is a higher RoE generating business than Sylvania,
and free up the bandwidth of the top management—which can now focus on the
domestic business. The cash generated from the sale of Sylvania can be used to
expand the domestic business by organic/inorganic route or be paid out as dividend
to shareholders.
14 December 2015
2

Havells India
Exhibit 1: Havells investment in Sylvania over the last eight years
Investments in Sylvania
7,154
5,314
1,616
2,677
7,751
7,751
8,516
9,809
Source: MOSL, Company
Sylvania performance since the time of acquisition has not been very
inspiring
Havells acquired Sylvania in FY08 for an EV of EUR227m. EUR30m was a recourse
debt from Havells, a pat of which was repaid by Havells by selling stake of EUR50m
to Warbug Pincus. Over the past eight years, Havells has invested a total of
EUR141mn(INR9.8b). Sylvania has net debt of EUR26.6 m on the balance sheet as of
2QFY16.
Sylvania was acquired by Havells to have a global presence in the lighting segment.
However, given the weakness in European economy, demand for Sylvania’s products
remains muted and the adverse cost structure didn’t help performance either.
Havells tried to turn around Sylvania’s performance by taking steps like changing the
top management and introducing restructuring plans like Phoenix in FY08-09 and
Prakaram in FY10-11 to rationalize the cost structure.
Post management’s effort, Sylvania’s performance was stable but remained muted.
Revenue remained flat for the last five years and EBIDTA margin remained stable at
5% (excluding the unfunded pension liability). After adjusting for the pension liability
and forex loss, Sylvania was able to break even at PAT level
Exhibit 2: Net debt on the books of Sylvania (EUR m)
Debt in Sylvania (m Euro)
- Working Capital revolving facility
- Term loan
New Debt raised
- Guaranteed debt by Havells India
- Secured facility by Sylvania
Cash
Net Debt
FY11
37.2
78.4
30
0
30
0
145.6
FY12
67.4
64.1
117.5
40
77.5
-13
118.5
FY13
0
83.2
42.2
26
16.2
-31
94.4
FY14
0
72.5
31.5
17.5
14
-28.8
75.2
FY15 2QFY16
0
0
39.4
34.4
11
12.8
0
0
11
12.8
-33.2
-20.6
17.2
26.6
Source: MOSL, Company
14 December 2015
3

Havells India
Exhibit 3: Brief snapshot of Sylvania’s historical financial performance (EUR m)
Y/E March
Net Sales
Change (%)
Raw material
Staff cost
Other Mfg exp
EBITDA
% of Net Sales
Exceptional items
Adjusted EBITDA
Margin (%)
Depreciation
Interest Outflow
Non-operating income
PBT
Tax-Total
Tax Rate (%) - Total
Extraordinary Income
Extraordinary expenditure
Reported Net Profit
Adjusted PAT
Growth (%)
FY08
513
0
244
120
122
27
5
0
27
5
10
14
2
6
3
46
0
0
3
3
58
FY09
509
-1
244
116
128
21
4
0
21
4
11
15
0
-5
3
-62
0
30
-39
-8
66
FY10
413
-19
213
101
97
2
0
0
2
0
9
11
1
-17
5
-27
0
43
-65
-22
68
FY11
452
9
216
88
114
35
8
6
29
6
8
12
2
17
6
35
0
1
10
4
60
FY12
440
-3
203
98
109
30
7
-7
37
8
8
12
6
16
6
34
0
0
11
17
66
FY13
431
-2
216
100
95
20
5
-3
23
5
7
12
3
4
0
-14
28
0
32
8
70
FY14
FY15
427
430
-1
1
214
213
103
113
97
101
12
3
3
1
-12
-21
25
24
6
6
6
7
6
6
0
0
0
-10
4
0
-3,104
-3
0
0
0
0
-4
-10
4
4
81
77
Source: MOSL, Company
Valuation and view: Maintain Buy with a revised target price of INR340
Domestic revenue growth will be supported by consistent introduction of
booster categories (like appliances, Reo switches, pumps, solar lighting and
brand extensions).
We expect return ratios to improve with the divestment of Sylvania and refocus
on the core domestic business by the management.
We maintain
Buy
with a revised price target of INR340. We value standalone
business at 30x (versus 28x earlier). We believe that the premium valuations are
justified, given (i) demonstrated track record of accelerating growth through
new launches, (ii) robust dividend payout and (iii) robust return ratios.
Key triggers
A] Domestic: Near-term headwinds; long-term drivers intact
While the muted revenue de-growth of 1% in 1HFY16 is largely a function of the
constrained near-term environment and drop in commodity prices, we believe that
long-term drivers remain intact.
Havells
is being re-positioned as a ‘Household’
brand rather than a male-dominated brand. The key pillars of domestic growth
strategy are given below:
New product launches:
Over the last few years, HAVL has consistently added
new segments / product lines, which have become ~INR5b revenue categories.
Its new product portfolios (i) Appliances (FY15, INR2b), (ii) Reo (INR1b), (iii)
Pumps (INR0.2b) and (iv) Air Coolers have the potential to generate annual
revenue of INR5b+. The consistent introduction of booster categories will
support long-term growth.
4
14 December 2015

Havells India
Expanding channel reach, cementing relationships with dealers:
HAVL is the #1
FMEG brand in India, but does not dominate any business segment (except
MCBs). This is largely a part of its strategy centered on dealers (and not
products). The attempt is to capture an increasing pie of the dealer’s sales
through product diversification, brand extensions and product innovation. With
the launch of
Reo
switches, HAVL is expanding its distribution network to tier-
2/3 towns—which it intends to leverage for most products.
Galaxy
stores
contribute ~INR8.5b to revenue (20%+ of consumer sales) and HAVL is
attempting to ramp up the outlets from 270 to 400 in 2-3 years. The
Electrician
Connect
program now has a database of ~200k electricians, with 40-50%
redeeming points.
14 December 2015
5

Havells India
Havells: Operating metrics
Exhibit 4: Key operating metrics
INR M
Havells Standalone
Revenues
Swtichgear
Cables and wire
Consumer Durables
Lighting and Fixtures
Others
Total
Revenue Growth (% YoY)
Swtichgear
Cables and wire
Consumer Durables
Lighting and Fixtures
Total
EBIT
Swtichgear
Cables and wire
Consumer Durables
Lighting and Fixtures
Others
Less: Unallocable Expense
Standalone EBIT
EBIT Margin (%)
Swtichgear
Cables and wire
Consumer Durables
Lighting and Fixtures
Standalone EBIT (%)
Consolidated EPS (INR/sh)
Standalone
Sylvania
Total
FY10
FY11
FY12
FY13
FY14
FY15
FY16E
FY17E
6,941
10,686
3,372
3,569
339
24,907
7,344
12,318
4,692
4,447
16
28,817
8,962
10,781
15,930
16,925
5,721 7,893
5,544
6,652
-
-
36,156
42,250
12,192
19,264
8,534
7,207
-
47,197
12,790
21,904
10,283
7,410
-
52,387
13,174
22,342
11,517
7,706
-
54,739
15,150
24,577
14,051
8,669
-
62,446
11.4
-3.4
21.8
27.3
6.4
5.8
15.3
39.1
24.6
15.7
22.0
29.3
21.9
24.7
25.5
20.3
6.2
38.0
20.0
16.9
13.1
13.8
8.1
8.3
11.7
4.9
13.7
20.5
2.8
11.0
3.0
2.0
12.0
4.0
4.5
15.0
10.0
22.0
12.5
14.1
2,611
888
1,019
705
68
2,324
2,967
2,719
900
1,295
820
6
2,451
3,289
3,234
1,259
1,610
1,318
-
3,239
4,182
3,653
1,540
1,978
1,568
-
3,883
4,856
4,032
2,110
2,304
1,787
-
4,012
6,221
4,390
2,657
2,580
1,969
-
4,957
6,638
5,006
3,016
2,799
1,811
-
5,305
7,327
5,643
3,134
3,653
2,341
-
4,787
9,984
37.6
8.3
30.2
19.8
12.7
37.0
7.3
27.6
18.4
11.4
36.1
7.9
28.1
23.8
11.5
33.9
9.1
25.1
23.6
11.5
36.5
11.0
27.0
24.8
13.1
36.5
12.1
25.1
26.6
12.5
38.0
13.5
24.3
23.5
13.4
37.3
12.8
26.0
27.0
16.0
3.7
-2.5
1.1
3.7
0.4
4.1
5.1
1.8
6.8
6.0
0.9
6.9
8.2
0.5
8.7
7.7
8.2
11.4
0.5
0.6
0.0
8.3
8.9
11.4
Source: MOSL, Company
14 December 2015
6

Havells India
Financials and valuations
Income Statement (Consolidated)
Y/E March
Net Sales
Change (%)
Raw Materials
Staff Cost
Other Expenses
EBITDA
% of Net Sales
Depreciation
Interest
Other Income
PBT
Tax
Rate (%)
Extra-ordinary Inc.(net)
Reported PAT
Change (%)
Adjusted PAT
Change (%)
2010
51,626
-5.7
29,154
7,602
11,648
3,221
6.2
837
979
222
1,627
932
57.3
(2,935)
-2,240
nm
695
80.7
2011
56,126
8.7
31,925
6,405
12,226
5,570
9.9
804
902
237
4,101
1,031
25.1
(31)
3,036
nm
2,584
271.6
2012
65,182
16.1
36,272
7,904
14,432
6,573
10.1
949
1,281
414
4,757
1,058
22.2
0
3,699
21.9
4,252
64.6
2013
72,478
11.2
41,628
9,054
15,051
6,745
9.3
1,097
1,232
279
4,695
824
17.5
1,944
5,816
57.2
4,290
0.9
2014
81,858
12.9
46,398
10,869
17,167
7,425
9.1
1,155
741
413
5,941
1,478
24.9
0
4,463
-23.3
5,410
26.1
2015
85,694
4.7
48,292
11,875
18,316
7,211
8.4
1,387
640
504
5,689
1,836
32.3
0
3,853
-13.7
5,159
-4.6
(INR Million)
2016E
85,739
0.1
48,731
10,323
17,745
8,940
10.4
1,468
257
696
7,911
2,367
29.9
0
5,544
43.9
5,544
7.5
2017E
65,286
-23.9
39,314
4,556
12,278
9,138
14.0
1,124
50
1,937
9,901
2,868
29.0
0
7,113
28.3
7,113
28.3
Balance Sheet (Consolidated)
Y/E March
Share Capital
Reserves
Net Worth
Loans
Deffered Tax Liability
Minority Interest
Capital Employed
Gross Fixed Assets
Less: Depreciation
Net Fixed Assets
Capital WIP
Goodwill
Curr. Assets
Inventory
Debtors
Cash & Bank Balance
Loans & Advances
Other Current Assets
Current Liab. & Prov.
Creditors
Other Liabilities
Provisions
Net Current Assets
Application of Funds
E: MOSL Estimates
2010
312
3,690
4,002
10,664
266
2
14,934
26,963
18,089
8,874
336
3,212
18,389
8,246
6,982
1,481
1,578
102
15,876
6,147
9,408
321
2,512
14,934
2011
624
5,914
6,537
11,065
559
6
18,166
28,454
18,499
9,955
249
3,354
22,081
10,860
7,724
1,779
1,206
512
17,729
6,637
9,898
1,195
4,352
18,166
2012
624
8,932
9,556
9,795
556
6
19,913
27,577
17,293
10,284
663
3,625
27,187
13,678
8,905
2,336
1,682
585
21,846
6,953
12,816
2,076
5,341
19,913
2013
624
13,797
14,420
9,785
480
1
25,102
30,054
18,503
11,551
249
3,694
29,468
13,184
8,623
4,736
2,052
874
19,860
9,026
8,761
2,073
9,608
25,102
2014
624
16,036
16,660
10,506
517
1
27,687
32,075
20,451
11,624
444
4,380
36,929
14,934
10,005
8,819
2,114
1,057
25,690
9,988
12,684
3,018
11,239
27,687
2015
622
17,557
18,180
4,191
434
1
22,808
30,298
18,469
11,829
383
3,581
32,519
13,663
6,232
7,775
1,723
3,127
25,504
8,338
13,645
3,521
7,015
22,808
(INR Million)
2016E
624
23,205
23,830
500
250
1
24,581
16,261
6,171
10,090
288
0
27,955
7,340
1,873
17,012
807
923
13,752
4,549
5,467
3,736
14,203
24,581
2017E
624
26,666
27,290
500
0
1
27,791
17,261
7,236
10,025
326
0
33,183
8,290
2,084
20,959
852
997
15,743
5,312
5,905
4,526
17,440
27,791
14 December 2015
7

Havells India
Financials and valuations
Ratios
Y/E March
Basic (INR)
Adjusted EPS
Growth (%)
Cash EPS
Book Value
DPS
Payout (incl. Div. Tax.)
Valuation (x)
P/E (consolidated)
Cash P/E
EV/EBITDA
EV/Sales
Price/Book Value
Dividend Yield (%)
Profitability Ratios (%)
RoE
RoCE
Turnover Ratios
Debtors (Days)
Inventory (Days)
Creditors. (Days)
Asset Turnover (x)
Leverage Ratio
Debt/Equity (x)
2010
-3.6
1.1
80.7
2.5
6.4
0.4
38.9
266.5
120.9
9.8
0.6
46.3
0.1
17.4
17.5
49
58
43
3.5
2.7
39.5
27.5
50
71
43
3.1
1.7
2011
4.9
4.1
271.6
5.4
10.5
0.5
11.8
2012
5.9
6.8
64.6
8.3
15.3
1.3
25.5
43.6
35.6
8.9
0.9
19.4
0.4
44.5
30.3
50
77
39
3.3
1.0
29.7
24.0
43
66
45
2.9
0.7
2013
9.3
6.9
0.9
8.6
23.1
1.5
28.3
2014
7.2
8.7
26.1
10.5
26.7
3.0
49.1
34.3
28.2
12.4
1.1
11.1
1.0
32.5
24.1
45
67
45
3.0
0.6
2015
6.2
8.3
-4.7
10.5
29.1
2.9
57.6
35.9
28.3
21.6
1.8
10.2
1.0
28.4
27.7
27
58
36
3.8
0.2
2016E
8.9
8.9
7.5
11.2
38.2
4.0
52.7
33.4
26.4
18.9
2.0
7.8
1.3
23.3
33.2
8
31
19
3.5
0.0
2017E
11.4
11.4
28.3
13.2
43.7
5.0
51.4
26.1
22.5
18.1
2.5
6.8
1.7
26.1
35.8
12
46
30
2.3
0.0
Cash Flow Statement
Y/E March
PBT before EO Items
Add : Depreciation
Interest
Less : Direct Taxes Paid
(Inc)/Dec in WC
CF from Operations
EO Income
CF from Oper. incl. EO Items
(Inc)/Dec in FA
Free Cash Flow
(Pur)/Sale of Investments
CF from Investments
(Inc)/Dec in Net Worth
(Inc)/Dec in Debt
Less : Interest Paid
Dividend Paid
CF from Fin. Activity
Inc/Dec of Cash
Add: Beginning Balance
Closing Balance
E: MOSL Estimates
2010
1,627
837
871
932
2,403
4,806
-2,935
1,871
-1,205
666
0
-838
839
-1,615
979
271
-2,025
-992
2,473
1,481
2011
4,101
804
902
1,031
-1,542
3,234
-31
3,203
-1,799
1,404
0
-1,941
-101
401
902
363
-965
297
1,481
1,435
2012
4,757
949
1,281
1,058
-431
5,498
0
5,498
-1,691
3,807
0
-1,961
515
-1,270
1,281
943
-2,979
558
1,779
2,658
2013
4,695
1,097
1,644
824
-1,868
4,744
1,944
6,688
-1,950
4,738
0
-2,020
67
-10
1,232
1,095
-2,270
2,399
2,336
4,734
2014
5,941
1,155
741
1,891
2,453
8,399
0
8,399
-1,424
6,975
0
-2,109
3
722
741
2,190
-2,206
4,084
4,736
8,822
2015
5,689
1,387
639
1,836
3,180
9,058
0
9,058
-1,531
7,528
0
-732
-198
-6,315
640
2,219
-9,372
-1,045
8,819
7,776
(INR Million)
2016E
7,911
1,468
255
2,367
2,049
9,316
0
9,316
367
9,683
0
3,947
2,844
-3,691
257
2,922
-4,026
9,237
7,775
17,014
2017E
9,901
1,124
130
2,868
710
8,998
0
8,998
-1,098
7,900
0
-1,098
-250
0
50
3,653
-3,953
3,947
17,012
20,961
14 December 2015
8

| CAPITAL GOODS INSIGHTS
CAPITAL GOODS GALLERY
Detailed Sector Updates
Special Reports
Initiating Coverage
Spotlights
Fulcrum (Capital Goods Insights)
19 November 2015
6

Disclosures
This document has been prepared by Motilal Oswal Securities Limited (hereinafter referred to as Most) to provide information about the company(ies) and/sector(s), if any, covered in the report and may be distributed
by it and/or its affiliated company(ies). This report is for personal information of the selected recipient/s and does not construe to be any investment, legal or taxation advice to you. This
Havells India
not
research report does
constitute an offer, invitation or inducement to invest in securities or other investments and Motilal Oswal Securities Limited (hereinafter referred as MOSt) is not soliciting any action based upon it. This report is not for
public distribution and has been furnished to you solely for your general information and should not be reproduced or redistributed to any other person in any form. This report does not constitute a personal
recommendation or take into account the particular investment objectives, financial situations, or needs of individual clients. Before acting on any advice or recommendation in this material, investors should consider
whether it is suitable for their particular circumstances and, if necessary, seek professional advice. The price and value of the investments referred to in this material and the income from them may go down as well as
up, and investors may realize losses on any investments. Past performance is not a guide for future performance, future returns are not guaranteed and a loss of original capital may occur.
MOSt and its affiliates are a full-service, integrated investment banking, investment management, brokerage and financing group. We and our affiliates have investment banking and other business relationships with a
some companies covered by our Research Department. Our research professionals may provide input into our investment banking and other business selection processes. Investors should assume that MOSt and/or
its affiliates are seeking or will seek investment banking or other business from the company or companies that are the subject of this material and that the research professionals who were involved in preparing this
material may educate investors on investments in such business. The research professionals responsible for the preparation of this document may interact with trading desk personnel, sales personnel and other
parties for the purpose of gathering, applying and interpreting information. Our research professionals are paid on the profitability of MOSt which may include earnings from investment banking and other business.
MOSt generally prohibits its analysts, persons reporting to analysts, and members of their households from maintaining a financial interest in the securities or derivatives of any companies that the analysts cover.
Additionally, MOSt generally prohibits its analysts and persons reporting to analysts from serving as an officer, director, or advisory board member of any companies that the analysts cover. Our salespeople, traders,
and other professionals or affiliates may provide oral or written market commentary or trading strategies to our clients that reflect opinions that are contrary to the opinions expressed herein, and our proprietary
trading and investing businesses may make investment decisions that are inconsistent with the recommendations expressed herein. In reviewing these materials, you should be aware that any or all of the foregoing
among other things, may give rise to real or potential conflicts of interest. MOSt and its affiliated company(ies), their directors and employees and their relatives may; (a) from time to time, have a long or short position
in, act as principal in, and buy or sell the securities or derivatives thereof of companies mentioned herein. (b) be engaged in any other transaction involving such securities and earn brokerage or other compensation
or act as a market maker in the financial instruments of the company(ies) discussed herein or act as an advisor or lender/borrower to such company(ies) or may have any other potential conflict of interests with
respect to any recommendation and other related information and opinions.; however the same shall have no bearing whatsoever on the specific recommendations made by the analyst(s), as the recommendations
made by the analyst(s) are completely independent of the views of the affiliates of MOSt even though there might exist an inherent conflict of interest in some of the stocks mentioned in the research report
Reports based on technical and derivative analysis center on studying charts company's price movement, outstanding positions and trading volume, as opposed to focusing on a company's fundamentals and, as
such, may not match with a report on a company's fundamental analysis. In addition MOST has different business segments / Divisions with independent research separated by Chinese walls catering to different set
of customers having various objectives, risk profiles, investment horizon, etc, and therefore may at times have different contrary views on stocks sectors and markets.
Unauthorized disclosure, use, dissemination or copying (either whole or partial) of this information, is prohibited. The person accessing this information specifically agrees to exempt MOSt or any of its affiliates or
employees from, any and all responsibility/liability arising from such misuse and agrees not to hold MOSt or any of its affiliates or employees responsible for any such misuse and further agrees to hold MOSt or any of
its affiliates or employees free and harmless from all losses, costs, damages, expenses that may be suffered by the person accessing this information due to any errors and delays. The information contained herein is
based on publicly available data or other sources believed to be reliable. Any statements contained in this report attributed to a third party represent MOSt’s interpretation of the data, information and/or opinions
provided by that third party either publicly or through a subscription service, and such use and interpretation have not been reviewed by the third party. This Report is not intended to be a complete statement or
summary of the securities, markets or developments referred to in the document. While we would endeavor to update the information herein on reasonable basis, MOSt and/or its affiliates are under no obligation to
update the information. Also there may be regulatory, compliance, or other reasons that may prevent MOSt and/or its affiliates from doing so. MOSt or any of its affiliates or employees shall not be in any way
responsible and liable for any loss or damage that may arise to any person from any inadvertent error in the information contained in this report. MOSt or any of its affiliates or employees do not provide, at any time,
any express or implied warranty of any kind, regarding any matter pertaining to this report, including without limitation the implied warranties of merchantability, fitness for a particular purpose, and non-infringement.
The recipients of this report should rely on their own investigations.
This report is intended for distribution to institutional investors. Recipients who are not institutional investors should seek advice of their independent financial advisor prior to taking any investment decision based on
this report or for any necessary explanation of its contents.
Most and it’s associates may have managed or co-managed public offering of securities, may have received compensation for investment banking or merchant banking or brokerage services, may have received any
compensation for products or services other than investment banking or merchant banking or brokerage services from the subject company in the past 12 months.
Most and it’s associates have not received any compensation or other benefits from the subject company or third party in connection with the research report.
Subject Company may have been a client of Most or its associates during twelve months preceding the date of distribution of the research report
MOSt and/or its affiliates and/or employees may have interests/positions, financial or otherwise of over 1 % at the end of the month immediately preceding the date of publication of the research in the securities
mentioned in this report. To enhance transparency, MOSt has incorporated a Disclosure of Interest Statement in this document. This should, however, not be treated as endorsement of the views expressed in the
report.
Motilal Oswal Securities Limited is registered as a Research Analyst under SEBI (Research Analyst) Regulations, 2014. SEBI Reg. No. INH000000412
There are no material disciplinary action that been taken by any regulatory authority impacting equity research analysis activities
Analyst Certification
The views expressed in this research report accurately reflect the personal views of the analyst(s) about the subject securities or issues, and no part of the compensation of the research analyst(s) was, is, or will be
directly or indirectly related to the specific recommendations and views expressed by research analyst(s) in this report. The research analysts, strategists, or research associates principally responsible for preparation
of MOSt research receive compensation based upon various factors, including quality of research, investor client feedback, stock picking, competitive factors and firm revenues
Disclosure of Interest Statement
Analyst ownership of the stock
Served as an officer, director or employee
HAVELLS INDIA
No
No
A graph of daily closing prices of securities is available at www.nseindia.com and http://economictimes.indiatimes.com/markets/stocks/stock-quotes
Regional Disclosures (outside India)
For U.S.
This report is not directed or intended for distribution to or use by any person or entity resident in a state, country or any jurisdiction, where such distribution, publication, availability or use would be contrary to law,
regulation or which would subject MOSt & its group companies to registration or licensing requirements within such jurisdictions.
Motilal Oswal Securities Limited (MOSL) is not a registered broker - dealer under the U.S. Securities Exchange Act of 1934, as amended (the"1934 act") and under applicable state laws in the United States. In
addition MOSL is not a registered investment adviser under the U.S. Investment Advisers Act of 1940, as amended (the "Advisers Act" and together with the 1934 Act, the "Acts), and under applicable state laws in the
United States. Accordingly, in the absence of specific exemption under the Acts, any brokerage and investment services provided by MOSL, including the products and services described herein are not available to or
intended for U.S. persons.
This report is intended for distribution only to "Major Institutional Investors" as defined by Rule 15a-6(b)(4) of the Exchange Act and interpretations thereof by SEC (henceforth referred to as "major institutional
investors"). This document must not be acted on or relied on by persons who are not major institutional investors. Any investment or investment activity to which this document relates is only available to major
institutional investors and will be engaged in only with major institutional investors. In reliance on the exemption from registration provided by Rule 15a-6 of the U.S. Securities Exchange Act of 1934, as amended (the
"Exchange Act") and interpretations thereof by the U.S. Securities and Exchange Commission ("SEC") in order to conduct business with Institutional Investors based in the U.S., MOSL has entered into a chaperoning
agreement with a U.S. registered broker-dealer, Motilal Oswal Securities International Private Limited. ("MOSIPL"). Any business interaction pursuant to this report will have to be executed within the provisions of this
chaperoning agreement.
The Research Analysts contributing to the report may not be registered /qualified as research analyst with FINRA. Such research analyst may not be associated persons of the U.S. registered broker-dealer, MOSIPL,
and therefore, may not be subject to NASD rule 2711 and NYSE Rule 472 restrictions on communication with a subject company, public appearances and trading securities held by a research analyst account.
For Singapore
Motilal Oswal Capital Markets Singapore Pte Limited is acting as an exempt financial advisor under section 23(1)(f) of the Financial Advisers Act(FAA) read with regulation 17(1)(d) of the Financial Advisors
Regulations and is a subsidiary of Motilal Oswal Securities Limited in India. This research is distributed in Singapore by Motilal Oswal Capital Markets Singapore Pte Limited and it is only directed in Singapore to
accredited investors, as defined in the Financial Advisers Regulations and the Securities and Futures Act (Chapter 289), as amended from time to time.
In respect of any matter arising from or in connection with the research you could contact the following representatives of Motilal Oswal Capital Markets Singapore Pte Limited:
Kadambari Balachandran
Email : kadambari.balachandran@motilaloswal.com
Contact : (+65) 68189233 / 65249115
Office Address : 21 (Suite 31),16 Collyer Quay,Singapore 04931
14 December 2015
Motilal Oswal Tower, Level 9, Sayani Road, Prabhadevi, Mumbai 400 025
Phone: +91 22 3982 5500 E-mail: reports@motilaloswal.com
Motilal Oswal Securities Ltd
10