Crystal
Ball gazing
2016
Quantitative Research
Crystal Ball Gazing: Past performance & Future Expectation
Nifty : 7946
1
st
January 2016
Nifty continues to oscillate
Sector
Media
Pharma
Small-Cap
Mid-Cap
FMCG
IT
Auto
Energy
Infra
Bank
Realty
Metals
YoY (%)
10.30
9.26
7.21
6.46
0.33
-0.03
-0.32
-0.66
-8.91
-9.68
-15.02
-31.35
Potential Outperformers
Dish TV, ZEE Ltd
Dr Reddy
Wonderla
Arvind
Jublfoods
Tata Elexi
Bosch
Petronet LNG, IGL
Cromp Greav
ICICI Bank
HDIL
JSW Steel
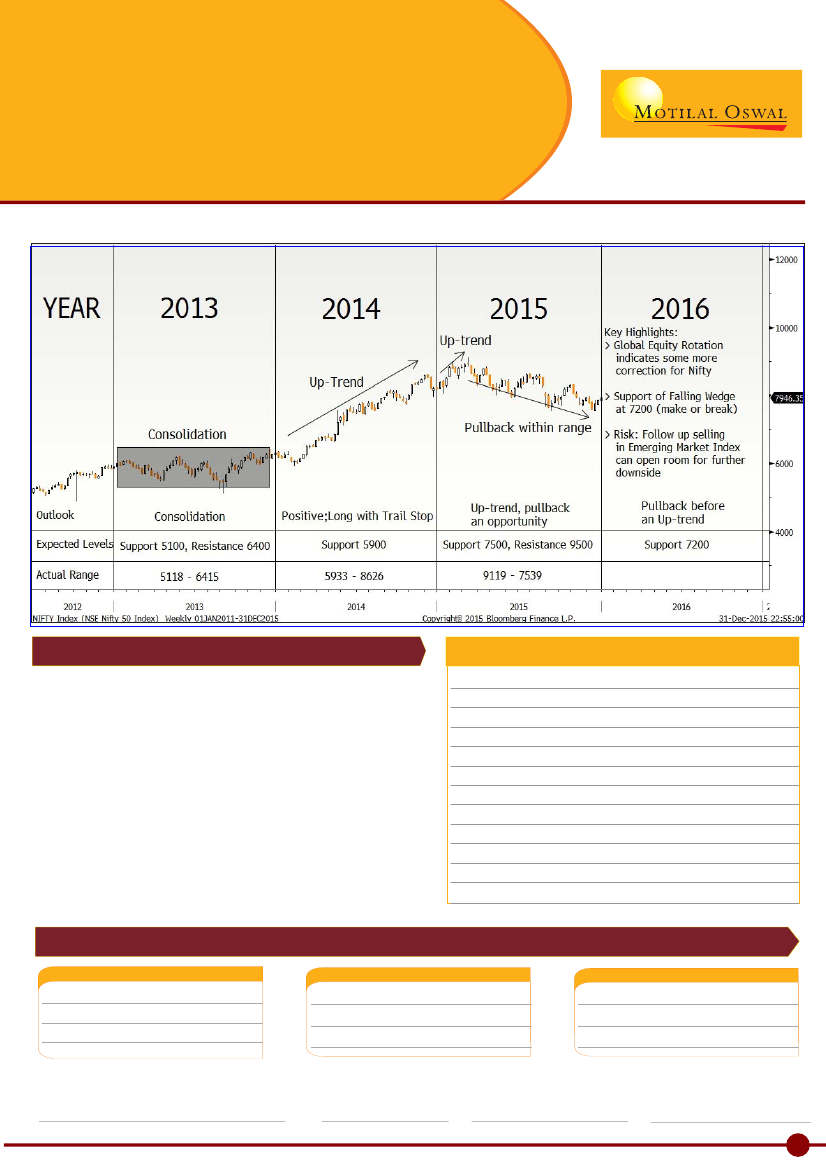
Nifty's Outlook
-
Nifty remains consolidating within the Falling
Wedge pattern with support at 7200 and breakout point being
8200. The range is expected to contract with time before a
directional move. 7200 remains a make or break point and
positions can be created once Index is around the same with a
stop marginally below it. Upside remains open and can be traded
with trailing stops later.
Key Risks
-
Follow up selling in Emerging Market Index (below
750) followed by a slide below 7200 can negate the outlook and
open more downside.
Top Picks - 2016
Stock Name
Arvind
Bajaj Fin
Bosch
CMP
358
6009
18647
Target
430
7400
23500
Stock Name
DishTV
Wonderla
TataElexi
CMP
101.5
397
2244
Target
140
490
2960
Stock Name
IGL
Petronet
PNB
CMP
529
256
116
Target
640
310
94
Shubham Agarwal, CMT, CFA, CQF
Head - Quantitative Research
Bhavin Desai
Head - Derivatives
Sacchitanand Uttekar
Technical Analyst
Pritika Poddar, CFA
Research Analyst
1
Note: To remain updated about the expected developments discussed in this Yearly report, please follow our MONTHLY QUANTITATIVE REPORT