Reliance Industries
BSE SENSEX
24,480
Bloomberg
Equity Shares (m)
M.Cap.(INRb)/(USDb)
52-Week Range (INR)
1, 6, 12 Rel. Per (%)
Avg Val, INRm/ Vol ‘000
Free float (%)
S&P CNX
7,435
RIL IN
3,239.2
3,375 / 50.4
1,090/797
9/13/32
418.9 / 0.4
54.8
20 January 2016
Q3FY16 Results Update | Sector: Oil & Gas
CMP: INR1,044
TP: INR1,092(+5%)
Neutral
Financials & Valuation (INR b)
Y/E Mar
2015 2016E
Net Sales
3,291
2,701
EBITDA
316.0
406.3
PAT
227.2
276.8
EPS (INR)
70.2
85.4
Gr. (%)
3.2
21.7
BV/Sh INR
738.5
819.3
RoE (%)
11.0
12.1
RoCE (%)
10.2
11.5
P/E (x)
14.9
12.2
P/BV (x)
1.4
1.3
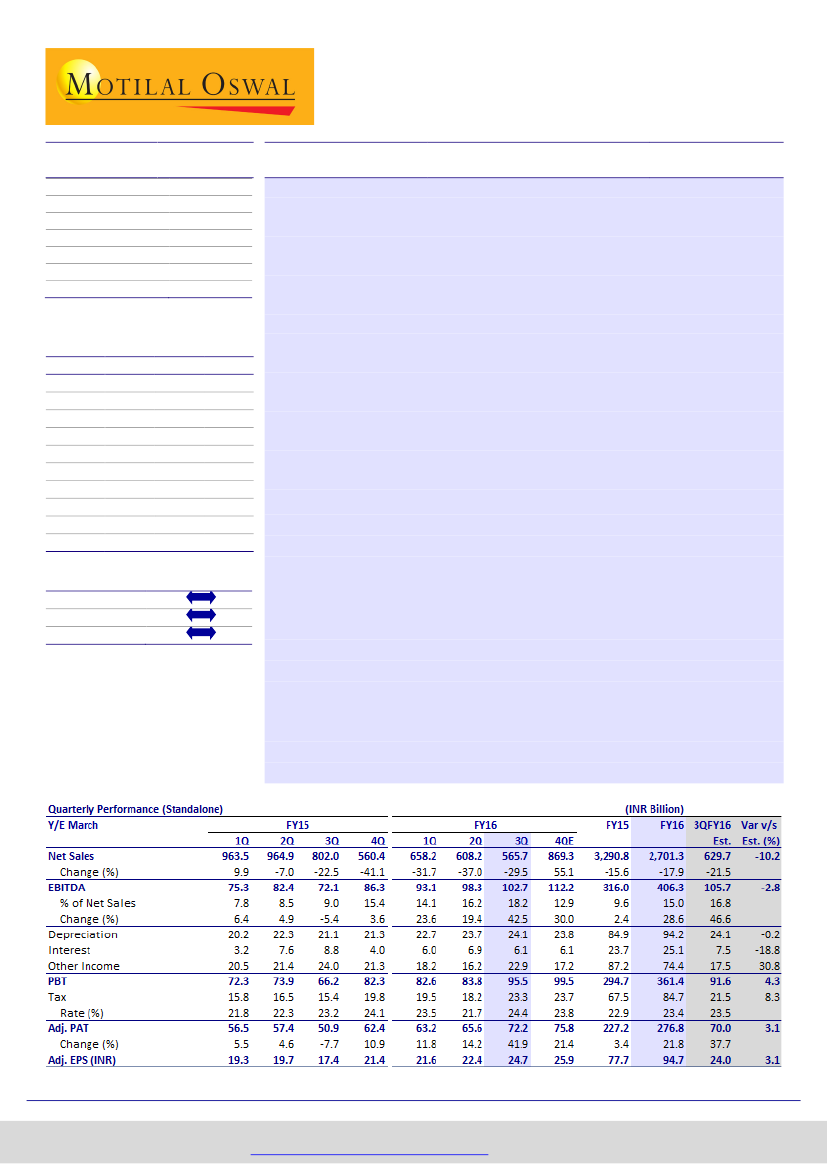
Reliance Industries’ (RIL) reported largely in-line 3QFY16 EBITDA at INR103b (43% YoY
and 5% QoQ), and PAT at INR72b (42% YoY and 10% QoQ). Higher other income at INR23b
(+42% QoQ) led by profit on sale of investments was partly negated by higher tax rate at
24.4%. GRM was in line at USD11.5 (v/s est 11.6), supported by efficient crude sourcing
and higher petchem margins. Core projects are largely on track for full commissioning in
FY17. RIL indicated that telecom business will be launched in next few weeks/months,
but did not give any specific timelines. Jio service trials are on full swing and indicate that
early feedback is positive. FY17 will be a big year for RIL with >USD34b core and non-core
projects start commissioning.
2017E
2,678
494.4
318.6
97.3
13.8
901.1
12.6
11.9
10.7
1.2
GRM in line; Petchem beats expectations:
3QFY16 GRM at USD11.5/bbl (+58%
YoY, +9% QoQ) boosted by shift in crude sourcing away from Brent-linked crude,
and higher product cracks. Refining EBIT stood at INR63b (+98% YoY, +17% QoQ).
Petchem EBIT at INR26b (+18% YoY, +3% QoQ) with EBIT margin at 14.4% was
supported by strong polymer segments and sale from polyester expansion. KG-D6
gas production declined ~7% QoQ to 10.6mmscmd.
Jio ready for roll out; Core projects largely on track
Full scale telecom commercial launch soon:
We are impressed by Jio
disclosures and believe it could disrupt data as well as voice market given its
non-legacy infrastructure (>INR1t capex) and zero dependence on voice. With
current trial runs with >60K RIL employees, expect full commercial launch soon.
Core USD17b capex largely are on track.
With 85% spent till date, core projects
largely on track for full commissioning by end 2016. RIL remains confident on
economics of petcoke gasification, ethane sourcing and off-gases cracker
projects.
Consolidated net debt stayed flat
at INR863b from INR870b in 2QFY16.
Organized retail
reached 3,043 stores in 371 cities. Sales at INR60b (+29% YoY,
+19% QoQ), EBITDA of INR2.4b (+7% YoY, +16% QoQ) and EBIT margin of 2.4%.
Valuation and view:
On FY17E basis, the stock trades at 9.7x adj. EPS of INR107
and EV/EBITDA of 7.5x. SOTP-based target price stands at INR1,092/share.
Estimate change
TP change
Rating change
Harshad Borawake
(HarshadBorawake@MotilalOswal.com); +91 22 3982 5432
Rajat Agarwal
(Rajat.Agarwal@MotilalOswal.com); +91 22 3982 5558
Investors are advised to refer through important disclosures made at the last page of the Research Report.
Motilal Oswal research is available on
www.motilaloswal.com/Institutional-Equities,
Bloomberg, Thomson Reuters, Factset and S&P Capital.

Reliance Industries
Exhibit 1: RIL segment wise performance snapshot (standalone)
In INRb
Segmental Revenues
Petchem
Refining
Oil & Gas
Others
Total
Segmental EBITDA
Petchem
Refining
Oil & Gas
Others
Total
EBITDA Margin (%)
Petchem
Refining
Oil & Gas
Others
Total
Segmental EBIT
Petchem
Refining
Oil & Gas
Others
Total
EBIT Margin (%)
Petchem
Refining
Oil & Gas
Others
Total
Operating Metrics
Refining (USD/bbl)
RIL GRM
Singapore GRM
Premium
Refinery Thr' put (mmt)
Utilization (%)
Petrochemicals
Total producton (mmt)
Polymer (TMT)
Polyester (TMT)
Polyester Int. (TMT)
E&P
Gross Oil Prodn (kbd)
PMT
KG-D6
Total*
Gross Gas Prodn (mmscmd)
PMT
KG-D6
Total
Gross Oil +Gas (mmboe)
Net Oil +Gas (mmboe)
FY13
2Q
3Q
4Q
1Q
FY14
2Q 3Q
4Q
1Q
FY15
2Q 3Q
FY16
4Q
1Q
196
614
12
2
823
33
59
7
0
99
17.0
9.7
57.3
12.1
25
51
1
1
77
12.6
8.4
6.9
32.1
9.4
2Q
199
513
12
3
726
35
62
7
0
104
17.6
12.0
59.6
14.3
25
54
1
1
80
12.7
10.6
4.8
20.1
11.1
3Q
180
496
10
3
688
36
71
6
0
110
20.0
14.4
62.7
16.5
26
63
0
1
91
14.4
12.8
3.9
34.9
13.2
18.0
98.0
-85.4
18.9
57.8
2.9
17.0
-30.4
57.1
12.5
3QFY16 (%)
YoY
QoQ
-15.4
-32.3
-26.4
-32.4
-28.4
22.7
76.4
-20.5
41.4
-9.2
-3.3
-14.9
-9.4
-5.1
3.3
15.6
-10.5
6.0
221 221 222 220
249 253 243 237 249 213 201
839 866 779 815
975 954 876 910 918 732 486
23
19
16
15
15 17 14 16 14 13 12
2
2
4
6
3
2
4
2
2
4
4
1,084 1,108 1,020 1,055 1,241 1,227 1,138 1,165 1,183 962 703
22
46
16
0
83
9.8
5.5
68.9
7.7
17
35
9
0
62
7.9
4.2
38.4
4.8
5.7
27
47
13
0
87
25
46
10
0
81
24
40
9
0
73
11.1
5.0
58.9
6.9
19
30
4
1
53
8.6
3.6
24.2
13.6
5.0
31
43
8
0
83
27
42
10
0
79
28
50
9
0
87
26
46
10
0
82
32
47
8
0
88
29
40
8
0
78
30
54
7
0
91
12.1 11.5
5.5 5.9
70.0 60.9
7.9
19
36
6
1
62
8.0
19
35
5
0
59
12.5 10.6 11.6 11.0 13.0 13.8 14.9
4.4 4.4 5.7 5.0 5.1 5.5 11.2
57.1 59.3 62.9 65.3 61.2 58.1 57.8
6.7
25
32
4
0
61
6.5
21
31
5
1
59
7.7
21
40
4
2
66
7.0
19
38
5
1
62
7.4
24
38
3
1
66
8.1 13.0
22
32
3
1
57
21
47
2
1
71
8.8 8.6
4.2 4.5
30.7 28.8
43.8 13.4
5.6 5.8
10.1 8.4 8.6 7.9 9.6 10.3 10.6
3.3 3.3 4.5 4.1 4.1 4.4 9.7
24.3 31.2 26.7 31.3 24.1 19.8 13.4
12.7 45.0 50.5 26.9 29.9 19.8 35.4
4.9 4.8 5.8 5.3 5.6 6.0 10.2
9.5
9.1
0.4
17.6
114
9.6 10.1
6.5 8.7
3.1 1.4
17.5 16.1
113 104
8.4
6.6
1.8
17.1
110
7.7 7.6 9.3 8.7 8.3 7.3 10.1
5.4 4.3 6.2 5.8 4.8 6.3 8.6
2.3 3.3 3.1 2.9 3.5 1.0 1.5
17.7 17.0 16.3 16.7 17.3 17.7 16.2
114 110 105 108 112 114 105
10.4
8.0
2.4
16.6
107
10.6
6.3
4.3
17.1
110
11.5
8.0
3.5
18.0
116
6.4
1,200
500
1,700
57.5
28.0
235.6
1.7
8.5
28.0
-19.6
5.3
5.5
5.5 5.4
5.3
5.7 5.6 5.4 5.4 5.7 5.3 5.6
5.8
6.2
1,101 1,098 1,100 1,100 1,093 1,196 1,111 1,082 1,191 993 1,034 1,080 1,220
420 365 430 411
528 272 419 411 405 577 454
512
543
1,197 1,200 1,170 1,100 1,304 1,154 1,212 1,156 1,158 1,318 1,246 1,452 1,475
20.8
20.8
-13.3
29.0
3.2
-1.6
-7.9
15.3
25.0
9.2
39.2
9.3
28.5
37.8
26.0
13.1
23.9 20.4
7.4 7.2
31.3 27.7
8.9 7.6
24.0 19.2
32.9 26.8
22.4 18.4
11.3 9.1
20.5
6.6
27.1
7.7
14.8
22.5
15.8
7.6
20.3 23.5 20.0 23.1 20.2 20.1 18.9
5.8 5.7 7.8 6.8 6.5 6.5 6.7
26.1 29.1 27.8 29.9 27.7 28.6 28.6
7.4
14.0
21.4
15.0
7.2
7.3 6.4 7.1 6.3 6.6 6.4
12.4 13.7 13.1 12.5 11.8 11.5
19.7 20.1 20.1 18.8 18.5 17.9
14.3 14.4 14.8 13.8 13.7 13.3
6.7 7.0 6.9 6.5 6.3 6.1
17.8
5.5
28.3
5.8
11.3
17.1
12.9
5.9
17.3
5.4
27.7
5.5
11.4
16.9
12.7
5.8
17.8
4.6
27.4
5.4
10.6
16.0
12.1
5.5
-11.4
-30.0
-4.3
-18.3
-10.3
-13.2
-11.5
-13.0
3.1
-16.0
-1.2
-1.3
-6.8
-5.0
-4.2
-5.5
*Q2FY13 includes 5,000barrels per day from Yemen; RIL has sold its stake
Source: Company, MOSL
20 January 2016
2

Reliance Industries
Key takeaways from analyst meet
Telecom Business
RIL indicated that the telecom ecosystem is almost ready. It is currently testing
its services through its 60,000 employees in 1,100 locations. The early feedback
and usage is very encouraging.
While the launch will be done in next few weeks to months, RIL did not commit
any specific date for the launch. Earlier RIL had indicated that it will go
commercial once they reach 1m users and full commercial launch only in FY17.
Telecom investment stands at INR1,090b including INR150b of spectrum
payables.
Its ‘LYF’ branded mobile handset will be made available through 40,000 outlets
throughout the country along with 120,000 retailers supported by zonal and
regional distributors.
It has also started connecting enterprises and has also identified few
pockets/cities to launch its FTTH (Fibre to the Home) service.
Petchem:
Domestic demand in polymers was strong at 15% in 9MFY16, while in
polyester anti-dumping duties helped to some extent.
Petroleum Marketing:
RIL has reopened its 762 outlets (v/s 600 in 2QFY16) and
and earlier guided to open all its 1,400 outlets by end FY17.
New Projects Update:
RIL has spent USD14.5b of the planned USD17b capex on its four key projects
(petcoke gasification, polyester expansion, off-gas cracker and ethane sourcing).
While the management indicated that all the projects are on track, we will not
be surprised by some minor delays given the large scale of these projects.
RIL reiterated its confidence on the good project economics in all the three core
projects – petcoke gasification, off-gases cracker and ethane sourcing.
Shale Gas:
RIL will cut its capex by 50-60% in 2016 over 2015, however
management indicated that despite lower prices, it will not take any write-offs.
In 2QFY16 it took an impairment of INR26b in shale gas.
Retail:
Plans to launch online e-commerce retail website focused on fashion
segment with largely in-house brands.
20 January 2016
3

Reliance Industries
Key financial highlights
3QFY16 interest cost is down 31%/12% YoY/QoQ to INR6b (v/s estimate of
INR7.5b). Despite INR/USD depreciation, reported interest was lower than
estimate due to higher capitalization led by ongoing project capex.
Adjusting for Its capitalized interest of INR6b and forex loss of INR2.9b, RIL’s
implied interest rate in 3QFY16 stood at 4%.
Exhibit 2: Reported interest cost implies gross level interest cost of 4% in 3QFY16 v/s 3% in FY15
On standalone basis (INR m)
Interest Expenses (A)
Other borrowing costs (B)
Applicable loss on foreign currency
transactions/translation ('C)
Reported Interest cost = (A + B + C)
Interest Capitalized (D)
Gross interest cost (E) = (A + B + D)
Standalone Gross Debt (F)
Average interest rate (%) = (E) / avg (F)
FY11
21,250
200
1,830
23,280
4,740
26,190
673,970
4.0%
FY12
19,660
180
6,830
26,670
4,300
24,140
682,590
3.6%
FY13
21,520
160
8,680
30,360
3,850
25,530
724,270
3.6%
FY14
18,670
140
13,250
32,060
7,010
25,820
899,680
3.2%
FY15
15,530
-
8,140
23,670
10,620
26,150
2,860
5,970
4,800
7,910
3,260
6,940
6,000
9,680
980,000
4.3%
2,950
6,940
6,000
9,990
980,000
4.0%
1QFY16
3,110
2QFY16
3,680
3QFY16
3,990
840,000 1,020,000
3.0%
3.2%
Source: Company, MOSL
Other income
at INR22.9b (v/s INR24.0b in 3QFY15 and INR16.2b in 2QFY16)
was higher than our estimate of INR17.5b. Other income was increased by
INR11b led by profits realized on sale.
D,D&A
was up 14% YoY and 1% QoQ to INR24.0b primarily due to capitalization
of Dahez projects.
Effective tax rate
stood at 24.4% in 3QFY16 (v/s 21.7% in 2QFY16).
Exhibit 3: Gain on sale of investments resulted in higher other income
Oth. Inc. (INRb)
OI as % of PBT
42
23
16
5 6
(0)
0
2
3
5
(2)
2
3
15 13
14 15 15
10 11 12 11 12
11
7 6
5 3
(0)
1 3 2 3
1
1
6
5
6
7
7
7
30
18
35
28
31
25
14
32
22
38
26
30
18
Net OI as % of PBT
33
22
36
28 28 29
17
24
23
19
26
24
21 22 19
15
11
18
21 20
(7)
2 7
10 7
3QFY09
9 11 11 17 23 19 21 17 22 25 21 23 20 20 21 24 21 18 16 23
3QFY12
3QFY13
3QFY14
3QFY15
3QFY16
3QFY08
3QFY10
3QFY11
Source: Company, MOSL
Standalone net debt
stood at INR170b (v/s INR200b in FY15) led by gross debt
of INR980b (v/s INR980b in FY15), and cash and equivalents at INR810b (v/s
INR780b in FY15).
Consolidated net debt
stood at IN863b (v/s INR870b in 2QFY16); net debt
declined even though gross debt increased to INR1,780b (v/s INR1,727b in
2QFY16) due to greater increase in cash and equivalents of INR917b (v/s
INR857b in 2QFY16)
4
20 January 2016

Reliance Industries
Consolidated capex in 3QFY16 stands at INR287b (v/s INR201b in 2QFY16) and
primarily includes INR130b for Jamnagar expansion, INR110b for telecom and
INR30b for shale
Exhibit 4:
Bulk of cons. and SA debt differential explained by shale gas and telecom debt
INR b
SA Net Debt
Cons. Net Debt
764
406 423
250
495
348
117
-20
FY10
FY11
FY12
200
54
18
200
170
870
863
-105
FY13
FY14
FY15
Sep-15
Dec-15
Source: Company, MOSL
Exhibit 5:
RIL SA net debt declined marginally QoQ (INRb)
Net Debt / (Cash)
Cash & Cash equiv.
734
264
Gross Debt
745
683
732 701 723 724
803 840 813
900
840 840 880
1,020 980
980
980
739 728 713 700
560
316
365 374 380
285
251 221 194 160
625
219
682 702 674 670 714
294 318
424 458
67 76 55 80
615 745
810 830
703 707 792
25
931 905 887 882 785 795
752
780 810 780 810
248 289 319 300 275 489 508 519 540 406 470 388 384 250 213 99
0 -20
3QFY08
3QFY09
3QFY10
3QFY11
3QFY12
18 55 45 128 200 210 200 170
-91 -87 -105-128 -66 -74
3QFY13
3QFY14
3QFY15
3QFY16
Source: Company, MOSL
Exhibit 6: SA and Cons BS: Higher consolidated debt led by borrowings for Shale gas and Telecom
In INRb
Shareholder Funds
Total Debt
Deferred tax Liability
Total Liabilities
NFA + CWIP
Investments
Net Current Assets
Total Assets
SA Net Debt
FY10
1,372
625
109
2,106
1,654
232
220
2,106
406
Standalone Balance Sheet
FY11 FY12 FY13 FY14
1,515 1,661 1,800 1,971
674
684
724
855
116
121
122
122
2,305 2,466 2,646 2,948
1,555
377
373
2,305
250
1,215
540
712
2,466
-20
1,289
525
832
2,646
-105
1,511
861
576
2,948
18
FY15 Sep-15
2,162 2,292
891
815
127
130
3,180 3,237
1,903
1,126
151
3,180
200
2,146
1,194
-89
3,251
200
FY10
1,416
646
107
2,169
1,772
131
265
2,169
423
Consolidated Balance Sheet
FY11
FY12 FY13
FY14
1,550 1,702 1,830 1,996
802
831
893 1,338
111
116
116
119
2,463 2,649 2,839 3,454
1,863
216
383
2,463
348
1,642
386
621
2,649
117
1,834
428
576
2,839
54
FY15 Sep-15
2,215 2,346
1,487 1,560
130
115
3,833 4,022
412
558
-504
466
870
2,329 3,229
613 765
511 -161
3,454 3,833
495
764
Source: Company, MOSL
20 January 2016
5

Reliance Industries
Exhibit 7: Refining share in overall standalone EBIT remains high at 70% led by higher GRM in 3QFY16
(%)
Petrochem
Refining
E&P
9
8
Others
7
6
9
6
8
5
5
2
1
1
0
14
15 11 23
26 30 29 32 28 24 23 21 22 25 20 20
56 52 53 60 61 57 56 66 66 67 70
45 47 29 28
38 37 46 44 33 35 44 58 58 59
28 34 34 36
41 36 32 30 36 38
40 41 48 46 42 38 34 36 38 39 32 34 42 45 36
30 32 31 29
28 31 32 36
Source: Company, MOSL
Exhibit 8: Comparing consolidated and standalone segmental EBIT: Shale EBIT turns negative
INR Billion
Segmental Revenues
Petchem
Refining
E&P
Org. Retail
Others
Total
Segmental EBIT
Petchem - Cons. includes Recron Malaysia
Refining - Cons. Includes GAPCO
E&P*
Org. Retail
Others
Total
Segmental Capital Employed
Petchem
Refining
E&P
Org. Retail
Others
Unallocated
Total
Consolidated Financials
3QFY15 2QFY16 3QFY16
266.5
1,035.9
30.0
41.7
24.6
1,398.7
23.6
38.4
8.2
1.0
2.7
73.9
501
722
667
61
580
1,144
3,676
212.4
607.7
20.7
50.9
28.7
920.3
25.3
54.6
(0.1)
1.2
2.3
83.3
484
984
755
63
761
1,143
4,190
194.0
573.9
17.7
60.4
31.3
877.2
26.4
64.9
0.9
1.5
2.9
96.5
448
1,056
764
63
826
1,184
4,341
Standalone (SA) Financials
3QFY15 2QFY16 3QFY16
213.1
731.5
13.5
-
3.7
961.8
22.0
32.0
2.7
-
0.7
57.4
468
791
315
-
390
1,175
3,138
198.5
512.7
11.7
2.8
725.6
25.2
54.1
0.6
0.6
80.5
462
968
334
454
1,185
3,403
180.3
495.5
9.9
2.5
688.3
25.9
63.3
0.4
0.9
90.5
424
1,036
335
456
1,227
3,477
Cons. less SA
3QFY15 2QFY16 3QFY16
17.0
86.3
14.9
46.9
30.7
195.7
(1.3)
0.7
5.7
1.3
1.7
8.1
30
14
384
62
218
(34)
674
13.9
95.0
9.0
50.9
25.9
194.7
0.1
0.5
(0.7)
1.2
1.7
2.8
23
15
421
63
306
(41)
787
13.7
78.3
7.7
60.4
28.8
188.9
0.5
1.6
0.5
1.5
2.0
6.0
24
19
430
63
371
(43)
863
*Cons. includes US shale business with 1 quarter lag
Source: Company, MOSL
New core projects largely on track
Core new projects are largely on track and indicated that the petcoke
gasification will start commissioning in phases from 1QCY16 and will fully
commission by end CY16.
Cumulatively RIL has spent INR14.5 (~85%) of the USD17b core refining and
petchem project capex.
ROGC startup scheduled at 3QFY17.
Expect first ethane shipment in 4QFY17.
20 January 2016
6

Reliance Industries
Exhibit 9: New projects to drive RIL’s next growth phase; capex estimate increase marginally
Capex (USD b)
~4.8
~4.8
Feedstock’s
Refinery off-gases
(From CDU, FCC etc.)
Petcoke
(From delayed coker unit)
Project
Refinery off-gases cracker (ROGC)
Integrated gasification
cycle (IGCC)
Polyester expansion
Ethane sourcing
Total
Key products
Petrochemicals (mainly ethylene chain)
Petrochemicals, Power, Steam, Chemicals
combined
~5
1.5
~17.0
PX, PFY, PSF, PET
Replacing domestic gas and high cost propane/naphtha
Source: Company, MOSL
Exhibit 10: Status update of ongoing core business capex plans
In KTPA
Refinery Off-gas Cracker
Ethylene
Propylene
LDPE
LLDPE
Benzene
PP
Polyesters
PFY
PTY
PSF
PET
Polyester Intermediates
Paraxylene
PTA
MEG
Rubber Division
PBR
SBR
Butyl Rubber
HPIB
Current
Capacity
1,883
759
190
928
419
2,100
670
153
692
290
1,830
2,050
733
74
Planned
Expansion
1,365
154
400
550
453
135
395
140
346
648
1,890
2,296
730
40
150
100
105
Total
3,248
913
590
1,478
872
2,235
1,065
293
1,038
938
3,720
4,346
1,463
114
150
100
105
Status /
Likely production start
3QFY17
3QFY17
3QFY17
3QFY17
Along with PX line
4QFY16
Commissioned
Commissioned
Phase 1 commissioned; Phase 2 in Dec 2015
Phase 1 in 2QCY16 (1 quarter delay) and Phase 2 after
3 months
Phase 1 commissioned; Phase 2 after 6 months
4QFY16, in interim could purchase feedstock
Commissioned in 4QFY14
July-Sept 2014 (2QFY15)
Commissioning by 2016
Source: Company, MOSL
20 January 2016
7

Reliance Industries
JIO: To introduce 4G handsets to build ecosystem
Capex till date stands at ~INR950b, full commercial launch in FY17
Telecom Analyst:
Shobhit Khare
(Shobhit.Khare@MotilalOs
wal.com);
+91 22 3982 5428
RIL management highlighted following key points on telecom: (a) more than INR1t
has already been invested (which includes ~INR150b of spectrum payables), (b) RIL
holds ~751Mhz of spectrum with atleast one high spectrum in 20 of the 22 circles
and (c) services have already been rolled out more than 60,000 employees in 1,100
cities.
Mobile devices available for purchase
RIL’s ‘LYF’ phone is already available for purchase by consumers, and is available
through ~40,000 retail outlets and channel partners. The handsets will have dual
sim capability and will be available in affordable to premium range.
These phones, we believe are exclusively developed for RIL and in case the sales
are lower than expected then the inventory impact will have to be borne by RIL.
Launch date yet to be finalized
RIL has not yet finalized exact launch date, but the launch can be expected soon.
Jio has already been rolled out to more than 60,000 employees, and is also
being tested by the vendors.
We expect Reliance JIO to disrupt data as well as voice market given its non-legacy
infrastructure and zero dependence on voice revenue.
Exhibit 11: India is moving up quickly in adopting LTE
Source: Company, MOSL
20 January 2016
8

Reliance Industries
Exhibit 12: Planning offerings across all the platforms for maximum impact
Source: Company, MOSL
Exhibit 13: Reliance Jio has already established substantial spectrum footprint
Source: Company, MOSL
20 January 2016
9

Reliance Industries
REFINING: GRM in line, EBIT at INR63b (70% of overall EBIT)
GRM at USD11.5/bbl; premium to Singapore at USD3.5/bbl
On a sequential basis, RIL’s GRM increased due to higher naphtha and middle
distillate cracks, efficient crude sourcing and robust demand growth supported
by the highest reported crude processing of 18MMT (116% utilization).
Driven by light distillates demand, RIL switched to sourcing lighter crudes linked
to Dubai from Brent linked Middle East producers.
Refining outlook:
Recent crude price fall is due to supply glut and not due to
product demand decline. In fact lower crude prices reduced product prices and
resulted in higher demand. This coupled with delays in the refinery capacity
addition has led to higher margins and expect margins to remain strong for next
few quarters. We model in GRM of USD11.3/11.5/bbl in FY17/18 for RIL.
Exhibit 14: RIL’s premium over benchmark declined in 3QFY16 to USD3.5/bbl
In USD/bbl
8
6
4
2
0
-2
RIL GRM Premium
Brent less Dubai
Arab L-H
Source: Bloomberg, Company, MOSL
20 January 2016
10

Reliance Industries
Exhibit 15: Refining EBIT up 98% YoY and 17% QoQ led by higher GRMs
Refining EBIT (INRb)
EBIT Margins (%)
26 28 30 28 19 20 13 13 14 20 20 22 24 25 32 31 17 17 22 35 36 35 30 32 31 40 38 38 32 47 51 54 63
Source: Company, MOSL
Exhibit 16: 3QFY16 GRM at USD11.5/bbl; premium of USD3.5/bbl (USD/bbl)
Singapore GRM
Premium / (Disc)
RIL GRM
7.7 8.5 7.6
1.5 2.4 4.3 3.5
3.1 2.9
0.1 0.9
1.8 2.3
3.5
6.4 4.4
3.5 1.0
2.6 2.4 3.7
3.3
3.4
2.8 4.0
8.6 8.0
7.7 7.0 8.1 5.8
7.4 8.6 9.1 7.9 7.5 6.7 9.1 6.5 8.7 6.6
6.3 8.0
5.5 4.1
5.4 4.3 6.2 5.8 4.8 6.3
4.9 4.9 4.2 5.5
3.6
3.2 1.9
-1.1
7.6
1.8
1.7 1.0
0.4
3.1
1.4
Source: Company, MOSL
Exhibit 17: Refinery throughput up 5.3% QoQ, utilization at 116%; highest ever throughput of 18mmt
Refinery Thr' put (mmt)
92 98 99 99 95 95
77
Utilization (%)
101 107 108 108
109 103 108 110 110 111 105 112 114 113 104 110 114 110 105 108 112 114 105 107 110 116
16.916.016.717.017.117.216.317.317.617.516.117.117.717.016.316.717.317.716.216.617.118.0
15.616.616.716.7
12.0
7.6 8.1 8.1 8.2 7.9 7.9
Source: Company, MOSL
Exhibit 18: Diesel cracks up 25% QoQ in 3QFY16 while
gasoline cracks flat (USD/bbl); Naphtha cracks turns positive
3QFY15
20
6
-8
-22
-36
4QFY15
1QFY16
2QFY16
3QFY16
Exhibit 19: Brent crude price was down 9%/43% QoQ/YoY to
average USD42.0/bbl in 3QFY16
Brent Crude Price (USD/bbl)
120
90
60
30
0
3QFY04 3QFY06 3QFY08 3QFY10 3QFY12 3QFY14 3QFY16
Source: Bloomberg, MOSL
20 January 2016
11

Reliance Industries
Exhibit 20: Premium of Brent over WTI down QoQ to
USD0.5/bbl in 3QFY16
25
15
5
(5)
Brent less WTI (USD/bbl)
Exhibit 21: Crude
(USD/bbl)
In USD/bbl
10
8
5
3
0
(3)
differentials
Brent - Dubai
increased
in
3QFY16
Arab L-H
Source: Bloomberg, MOSL
Exhibit 22: RIL refining outlook: Expects demand to outpace refinery capacity additions
Source: Company
20 January 2016
12

Reliance Industries
PETCHEM: Above est. helped by new capacity (29% of total EBIT)
Capacity additions on track, polymer margins have largely subsided in 3Q
RIL 3QFY16 petchem EBIT stood at INR25.9b (+18% YoY, +3% QoQ). Growth was
driven by increase in total production due to new capacity addition. PSF
production increased by 17% QoQ.
Over 9MFY16 polymer demand grew at 15% (3QFY16 growth at 20%: PE at 22%,
PP at 21%, PVC at 16%), while polyester demand grew at 4%. India’s polymers
demand growth driven by lower absolute prices surpassed that of China and is
expected to continue.
Overall, in 3QFY16 spreads declined due to relatively firm feedstock prices.
While Asian naptha costs only fell by 3%, ethylene prices were higher by 6% due
to cracker shutdowns.
Petchem outlook:
On the polymer front, while the near term outlook looks
stable, will have to watch out for impact of shale based US capacity additions in
the medium term (2018). India has surpassed China in demand growth this
quarter; expect demand to be robust in India due to its improving economy.
Further lower prices have supported demand growth.
Exhibit 23: EBIT up YoY and QoQ; margins expanded even though headline spreads were lower
Petchem EBIT (INRb)
17.7
14.0
10.6
12.2
10.4
13.1
18.0
16.5
14.4
14.8
13.9
14.6
15.2
14.4
12.1
EBIT Margins (%)
14.4
12.612.7
9.6 10.310.6
10.9
10.2
8.0
7.9
11.5
8.8
8.6
8.6
10.1
8.4 8.6 7.9
18 15 16 19 17 17 21 22 21 22 21 22 24 26 22 24 22 22 18 17 19 19 19 25 21 21 19 24 22 21 25 25 26
Source: Company, MOSL
Exhibit 24: Key Polymer and Polyster spreads largely decline QoQ in 3QFY16 (INR/kg)
75
60
45
30
15
0
PE
PP
PVC
POY
PSF
Source: Company, MOSL
20 January 2016
13

Reliance Industries
Exhibit 25: Petchem volumes up 3.2% QoQ and 20/8% YoY (mmt)
Polymer
4.8 5.1 5.0 5.0 4.6
1.1 1.2 1.2 1.2
1.1
0.4 0.4 0.4 0.4 0.4
0.9 0.9 0.8 0.8 0.7
Polyester
Polyester Interm.
Total
6.2 6.4
5.7 5.6 5.4 5.4 5.7
5.6 5.8
5.4 5.3
5.3
1.5 1.7
1.3
1.2 1.3 1.2 1.5
1.2 1.1
1.2 1.2 1.2
0.5 0.5
0.4 0.4 0.5 0.3 0.4 0.4 0.4 0.6 0.5 0.5
1.1 1.1 1.1 1.2 1.1 1.1 1.2 1.0 1.0 1.1 1.2 1.2
5.4 5.6 5.2 5.5 5.7 5.5 5.5 5.6 5.5 5.5
5.4 5.5 5.3
4.9
4.9
4.7
1.2
1.2 1.2 1.2 1.2 1.2 1.2
1.2 1.2 1.1
1.1 1.2
1.1 1.1
1.1
1.1
0.4 0.5 0.4 0.4 0.4 0.4 0.4 0.4 0.4 0.4 0.4 0.4 0.4 0.4
0.4
0.4
1.1 1.1 1.1 0.9 1.1 1.1 1.0 1.1 1.1 1.1 1.1 1.1 1.1 1.1
0.7 0.8
Source: Company, MOSL
Exhibit 26: Improving naphtha cracker economics and domestic demand to support
polymer margins
Source: Company, MOSL
20 January 2016
14

Reliance Industries
E
&P: KG-D6 production declines due to natural field declines
Domestic E&P program contingent on gas pricing and DGH approvals
Domestic E&P EBIT stood at just INR0.4b (v/s INR2.7b in 3QFY15 and INR0.6b in
2QFY16, now contributes less than 1% to the total EBIT v/s peak of 32% in
1QFY11) impacted by lower realization and lower production.
Production from Panna-Mukta was lower due to technical issues that resulted in
shutdown of a platform; Tapti field faced natural declines. Production from Tapti
is expected to cease by 4QFY16
Domestic conventional E&P has made some headway with RIL now moving
ahead with DST (well testing) as per DGH requirement. FDP for CB-10 block has
been submitted to the management committee, and Phase-II exploration
program is under progress
(refer exhibit ‘Exhibit 31: Status of RIL's key blocks’
for more details).
Incremental capex commitment will depend on outcome of
ongoing arbitration and possible de-regulation of gas prices.
CBM project on track for 2016 start:
Comissioning of the 302km Shahdol -
Phulpur pipeline has been delayed to 4QFY16. Phase -1 activities are near
completion which includes >200 wells, 2 gas and 8 water gathering stations.
KG-D6 production declines:
KG-D6 gross production declined to 10.6mmsmcd in
3QFY16 (v/s 11.8mmscmd in 3QFY15 and 11.4 in 2QFY16). RIL is trying to sustain
production through well optimization. Side Track options in MA to augment
production are being reviewed.
Exhibit 27: CBM development in full swing: Expect first gas by 4QFY16 (GGS: Gas gathering station)
Source: Company, MOSL
20 January 2016
15

Reliance Industries
Exhibit 28: E&P EBIT down QoQ led by lower realisations and lower volumes
64
51
54
69
59
E&P EBIT (INRb)
64
54
42 42 39 41 40 36 38 38
43 46
3639 38
EBIT Margin (%)
31 29
4 4 5 6 6 5
10 12
19
15 17 17 15 16 15 15
24 24
31
27
31
24
20
13
10 10 9
7 5 4
6 5 4 4 5 4 5 3 3 2 1 1 0
13
Source: Company, MOSL
Exhibit 29: KG-D6 gross production averaged 10.6mmscmd in 3QFY16
KG-D6 Gross Oil (kbpd)
KG-D6 Gross Gas (mmscmd)
5 6
15 25 22 22 22 12 15 15 13 13 9 7 7 7 6 6 8 7 7 7 7 5 5 5
9 11 10
Source: Company, MOSL
Exhibit 30: RIL’s net HC production at 5.5mmboe
RIL net Oil + Gas production (mmboe)
Source: Company, MOSL
20 January 2016
16

Reliance Industries
Exhibit 31: Status of RIL's key blocks: New development and production contingent on arbitration
Key Blocks
Current Status
KG-D6
Development plan approved for R-
(KG-DWN-98/3)
Series in Aug-13 and FEED
completed
D1-D3: FEED completed for booster
compressor
and
detailed
engineering in process
Satellite fields - DoC review for
D29, D30, D31 (Satellite) being
pursued
MJ-1 discovery (Appraisal plan
reviewed by MC)
FY14
Update / Planned Work Program
FY15
FY16
FY17
Development contingent on the
arbitration decision and new gas pricing
applicability
Well B7/A1 Will focus to
added
maintain
1mmscmd production
FY18
FY19
Production start likely
(contingent on
development start)
MA8H well beganInstalled
production in Jan-compressor
14 at ~2.5mmscmd boosters
FDP likely to beFDP likely to be
submitted
approved
NEC-25
- Integrated development plan for
(NEC-OSN-97/2)
D-32, D-40, D-9 and D-10 disc.
submitted.
CY-D5
(CY-DWN-
2001/2 )
KG-V-D3
(KG-DWN-
2003/1)
CB-10
(CB-ONN-
2003/1)
CBM blocks
- DoC for D35 (A1) discovery
submitted in March 2010; await
DGH approval.
- Await DGH approval for DoC of
D39
/
D41.
- Ph 1 upto Dec’14; identifying
locations
- Await DoC approval for 8
discoveries
DST in discoveries D29 & D30
completed; D31 relinquished;
Development contingent on the
arbitration decision and gas pricing
First appraisal wellDrilled
3rd Data
spud in Sep-13
appraisal well,processing,
study
engg studies
underway
and analysis
of well data
underway
Submitted
FDP likely to be DST in D32
Development Production
proposal to carryapproved
completed
likely
start likely
out DST to DGH
JV
partner
Niko
withdrew
Reported
2nd
Resource
discovery
assessment
job awarded
in 2Q FY16
RELINQUISHED
Entry into
FDP
Phase II
submitted to
discussion with MC; Phase II
DGH underway work began
Development Production
start likely;
Pipeline to
complete by
4QFY16
Source: Company, MOSL
*MC: Management Committee; FDP: Field Development Plan
Shale Gas profitability under pressure; capex will be halved
RIL’s shale gas revenues stood at USD110m (-47% YoY, -6% QoQ), while EBITDA
stood at USD58m (-67% YoY, -8% QoQ).
RIL’s production share in shale JV’s stood at 16.7mmscmd (largely flat YoY but
up 6.3% QoQ). Production was up QoQ driven by strong well performance in the
Chevron and Pioneer JV
Average realization stood at USD2.4/mscfe (v/s USD4.6/mscfe in 3QFY15 and
USD2.8/mscfe in 2QFY16.
Shale gas capex stands at USD8.9b (USD164m spent in 3QFY16) without
adjusting for recent pipeline sale. RIL expects FY16 capex to decline by ~50% in
the next year.
20 January 2016
17

Reliance Industries
Exhibit 32: Shale gas revenues down YoY and QoQ
Revenues (USDm)
266
221
215
193
193
174
172
165
155
127
123
199
270
EBITDA (USDm)
244
202 206
201
174
141
138
117
110
91
86
63
58
Source: Company, MOSL
Exhibit 33: Shale gas capex curtailed led by sharp hydrocarbon price fall Capex (USDm)
Pioneer (RIL: 45%)
Carizzo (60%)
Cumulative Capex (USDm)
Chevron (RIL: 40%)
Total
8,782 8,946
8,064 8,298 8,573
7,759
7,133 7,468
6,460 6,834
20
130
250
70
221
185
1
181
145
20
263
137
1
200
139
20
158
157
1
-
110
181
208
96
5
138
98
28
67
147
*asset-wise capex not disclosed in 1Q, 2Q and 3Q
Source: Company, MOSL
Exhibit 34: RIL production largely flat YoY but up 6.3% QoQ RIL Production Share mmscmd)
Pioneer (RIL: 45%)
Chevron (RIL: 40%)
13.9
2.3
3.5
8.1
15.1
3.0
3.5
8.6
15.0
2.4
3.6
9.0
Carizzo (60%)
16.1
2.7
4.1
9.2
15.5
1.7
4.4
9.4
15.3
1.8
4.4
9.0
Total
15.7
16.7
11.4 11.7 11.2
9.9
8.7
2.0 1.7
1.7
1.5
1.3
2.9
2.7
2.3
1.7
1.6
7.4
7.2
6.8
6.6
5.9
13.2
2.0
3.4
7.8
Source: Company, MOSL
20 January 2016
18

Reliance Industries
Organized Retail: To launch e-commerce website soon
3QFY16 revenues up 29%; presence in 371 cities with 3,043 stores
In 3QFY16, Reliance retail reported revenues of INR60b (+29% YoY, +18% QoQ),
EBITDA of INR2.4b (+7% YoY, +16% QoQ) and EBITDA margin of 4.0% (v/s 4.1%
in 2QFY16).
Contribution of private label sales increased to 14.6% in 3QFY16 v/s 8.6% in
3QFT15.
It currently operates 3,043 stores (v/s 2,857 on Sep 30, 2015) in 371 cities with
12.8m sq. ft of area.
It plans to enter into e-commerce segment for Fashion & Lifestyle along with
offering market place platform for small retailers. Currently, the website for the
same is getting ready for preview
Exhibit 35: Reliance retail has opened 186 stores in 3QFY16, increasing presence increased to 371 cities
No. of stores (No.)
Addition
No. of Cities
Avg. stores per city
FY13
1,466
184
129
11
FY14
1,691
225
146
12
1QFY15
1,723
212
148
12
2QFY15
2,006
437
155
13
3QFY15
2,285
279
166
14
4QFY15
2,621
336
200
13
1QFY16
2,747
126
210
13
2QFY16
2,857
110
250
11
3QFY16
3,043
186
371
8
Source: Company, MOSL
Exhibit 36: Focus on digital segment continues with store count reaching 1,573, ~ 50% of
total (# of stores)
Value and others
Digital
Brands, Jewellery and Fashion & Lifestyle
2,285
756
920
609
2,621
809
1,196
616
2,747
827
1,298
622
Total Stores
2,857
868
1,379
610
3,043
909
1,537
597
1,466
567
139
760
1,691
689
284
718
1,723
694
427
602
2,006
722
689
595
Source: Company, MOSL
Exhibit 37: Revenues grew by 29% YoY (INRb)
Value & others
Digital
Brands, Jewellery and Fashion & Lifestyle
47
23.9
11.2
11.7
3QFY15
48
25.8
12.2
8.9
47
24.4
11.7
10.8
51
24.9
12.2
9.9
16.9
15.1
3QFY16
Source: Company, MOSL
60
28.4
Exhibit 38: Value format revenue share remains highest (%)
Value & others
Digital
Brands, Jewellery and Fashion & Lifestyle
53
21
26
3QFY14
56
19
25
57
21
22
55
23
22
51
24
25
3QFY15
55
52
25
23
53
26
21
47
28
25
3QFY16
26
19
Source: Company, MOSL
20 January 2016
19

Reliance Industries
Valuation and view
RIL is in the midst of executing its largest ever capex plans in core and non-core
businesses and will drive the standalone EBITDA CAGR of 22% in FY15-FY18E.
Key things to watchout for RIL: (1) telecom launch and subscriber ramp-up, (2)
E&P arbitration case outcome for domestic E&P clarity and (3) Update on core
capex plan of ~USD17b.
For FY17/FY18, we model a) GRM at USD11.3/11.5/bbl. Every USD1/bbl change
in GRM impacts RIL’s EPS by ~10%.
With telecom launch round the corner, RIL stock is entering into a critical
juncture as success of telecom venture will drive the stock performance.
On FY17E basis, the stock trades at 9.7x adj. EPS of INR107 and EV/EBITDA of
7.5x. Our SOTP-based target price stands at INR1,092/share. We currently have
a
Neutral
rating.
Exhibit 39: RIL: Key assumptions
Key Metrics
Exchange Rate (INR/USD)
Refining
Capacity (mmt)
Production (mmt)
Capacity Utilization (%)
GRM (USD/bbl)
Blended GRM
Singapore GRM
Premium to Singapore
E&P
Gas Production (mmscmd)
Oil Production (kbd)
Pricing
Brent Oil (USD/bbl)
Wellhead Gas Price (USD/mmbtu)
FY09
45.8
33.0
32.0
97%
12.3
5.8
6.5
FY10
47.6
62.0
60.6
98%
6.9
3.6
3.3
39.8
10.7
84.8
69.7
4.2
FY11
45.6
62.0
66.5
107%
8.4
5.2
3.2
56.2
18.9
86.5
4.2
FY12
47.9
62.0
67.6
109%
8.6
8.3
0.3
42.6
10.9
114.5
4.2
FY13
54.5
62.0
68.1
110%
9.2
7.9
1.4
26.5
9.1
110.6
4.2
FY14
60.5
62.0
68.1
110%
8.5
5.6
2.9
13.8
6.4
108.5
4.2
FY15
61.2
62.0
67.9
110%
8.8
6.4
2.5
12.2
6.6
86.0
4.5
FY16E
65.4
62.0
68.0
110%
11.1
7.6
3.5
11.0
5.2
50.0
4.7
FY17E
67.0
62.0
68.0
110%
11.3
8.0
3.3
10.5
5.2
45.0
4.3
FY18E
69.0
62.0
68.0
110%
11.5
8.0
3.5
10.5
5.2
50.0
4.3
Source: Company, MOSL
Exhibit 40: RIL: Segmental EBIT break-up (INRb)
Segmental EBIT (INRb)
Refining
Petchem
E&P
Total
Segmental EBIT share (%)
Refining
Petchem
E&P
Total
FY09
96
69
23
188
51%
37%
12%
100%
FY10
60
86
55
200
30%
43%
27%
100%
FY11
92
93
67
252
36%
37%
27%
100%
FY12
97
90
53
239
40%
38%
22%
100%
FY13
128
73
29
230
56%
32%
13%
100%
FY14
132
86
20
239
55%
36%
9%
100%
FY15
155
86
16
257
60%
34%
6%
100%
FY16E
232
101
5
339
69%
30%
1%
100%
FY17E
255
136
2
392
65%
35%
0%
100%
FY18E
262
196
3
461
57%
43%
1%
100%
Source: Company, MOSL
20 January 2016
20

Reliance Industries
Exhibit 41:
RIL: Sum of the parts valuation (FY17 basis)
Business
Core business
Refining
Petchem
Domestic E&P
KG - D6 (KG Basin)
NEC - 25 (Mahanadi basin)
Sohagpur E&W (CBM)
PMT
Investments
Investments in RGTIL, RIIL
Investments in fuel Retailing
Reliance Retail
Less: Net Debt/ (Cash)
Sub-total
Investments
Investment in Shale Gas
Reliance Jio (Telecom)
Total fair value
USD b
47.0
27.4
19.7
2.4
1.2
0.2
0.3
0.8
4.5
0.0
0.5
4.0
6.9
47.1
0.5
1.6
49.1
INR b
3,058
1,778
1,280
159
79
13
17
49
290
0
30
260
448
3,059
31
101
3,191
Adj.
INR/sh
1,047
609
438
54
27
5
6
17
99
0
10
89
153
1,047
10
35
1,092
Remarks/Methodology
EV @6x EBITDA; implied USD1674/complexity bpd
Petchem EV @6x EBITDA
DCF; 60% stake; 6tcf cumulative; model 4tcf yet to recover
DCF; 60% stake; OGIP of 3tcf
DCF; 100% stake; OGIP of 3.65 TCF, assumed 50% recovery
Currently producing; EV @3x EBITDA
INR20b loan not valued
25% discount to investments
100% subsidiary of RIL; 0.7x sales
Based on fully diluted equity sh. of 2,921m (excl 309m treasury sh.)
JV with Chevron. Pioneer & Carrizo; 50 % discount to equity investment
50% discount to license value adjusted for elapsed time
Based on fully diluted equity sh. of 2,921m (excl 309m treasury sh.)
20 January 2016
21

Reliance Industries
Reliance Industries: Story in charts
Exhibit 42: RIL’s earnings growth momentum has slowed
down
PAT (INRb)
400
300
200
100
0
Rolling 3 Yr PAT CAGR (%)
45%
33%
21%
9%
-3%
Exhibit 43: Also return ratio’s declined significantly
25%
20%
15%
10%
5%
RoCE (%)
RoE (%)
Source: Company, MOSL
Exhibit 44: FY14 Cons. Capital Employed: Higher share of non-core long gestation capex impacting RIL’s overall return ratios
Cons. CE Break-up (%)
1
8
18
10
4
4
2
-
2
5
2
23
22
35
8
26
4
2
6
7
8
27
13
FY12
9
28
4
2
6
10
6
22
14
FY13
9
25
2
2
12
12
6
19
14
FY14
8
21
2
1
15
13
5
23
12
FY15
7
18
2
1
21
13
5
22
11
FY16E
7
17
2
1
21
13
5
22
12
FY17E
6
16
2
1
21
14
6
21
12
FY18E
Source: Company, MOSL
Unalloc.
Cash & Equiv.
Retail
SEZ
Telecom
E&P (Shale)
E&P (Domestic)
Refining
Petchem
29
16
FY11
18
FY10
Exhibit 45: While core business RoCE would be healthy, subdues/nil returns in non-core businesses would drag overall
profitability (%)
Adj. ROIC (%)
30
20
10
0
-10
-20
FY07
FY08
FY09
FY10
FY11
FY12
FY13
FY14
FY15E
FY16E
FY17E
FY18E
Petchem
Refining
E&P (Domestic)
E&P (Shale)
Retail
20 January 2016
22

Reliance Industries
Reliance Industries: Story in charts
Exhibit 46: Segmental EBIT break-up (%) - E&P a dampener,
refining and petchem outshine
100%
75%
50%
25%
0%
0
FY10 FY11 FY12 FY13 FY14 FY15 FY16E FY17E FY18E
Source: Company, MOSL
Refining
Petchem
E&P
Exhibit 47: Expect E&P production revival when its new
development projects commission (mmscmd)
60
45
30
15
39.8
55.9
42.6
26.5
13.8 12.2
11.0 10.5 10.5
Exhibit 48: RIL refining margins have been largely flat in
recent years (USD/bbl)
16
12
8
4
0
Singapore GRM
Premium/(disc)
RIL GRM
Exhibit 49: While, recent petchem EBIT margins are low, we
expect some recovery led by polymer chain (%)
15%
11%
13% 13% 13%
10%
8%
16%
15%
12%
9%
12%
10%
14%
Source: Company, MOSL
Exhibit 50: Dividend Payout continues to remain low (%)
22%
20%
17%
15%
12%
FY03
FY05
FY07
FY09
FY11
FY13
FY15
Exhibit 51: RIL 1Yr Fwd P/E Chart (last 15 years)
Source: Company, MOSL
20 January 2016
23

Reliance Industries
Financials and valuations
RIL - Income Statement
Y/E March
Net Sales
Change (%)
Other Operating Income
Total Income
RM Cons & Purchases
Employee Costs
Other Expenditure
Change in Stocks
EBITDA
% of Net Sales
Depreciation
Interest
Other Income
PBT
Tax
Rate* (%)
PAT
Adj. PAT
Change (%)
Key Operating Metrics
GRM (USD/bbl)
KG-D6 production (mmscmd)
2011
2,482
28.9
0
2,482
1,947
26
160
-32
381
15.4
136
23
31
252
50
19.6
203
203
24.9
8.4
56.2
2012
3,299
32.9
0
3,299
2,763
29
180
-9
336
10.2
114
27
62
258
57
22.2
200
200
-1.2
8.6
42.6
2013
3,603
9.2
0
3,603
3,066
34
228
-33
308
8.5
95
30
80
263
53
20.1
210
210
4.8
9.2
26.5
2014
3,901
8.3
0
3,901
3,298
34
256
4
309
7.9
88
32
89
278
58
21.0
220
220
4.7
8.5
13.8
2015
3,291
-15.6
0
3,291
2,631
37
287
19
316
9.6
85
24
87
295
67
22.9
227
227
3.3
8.8
12.2
2016E
2,701
-17.9
0
2,701
1,926
41
313
15
406
15.0
94
25
74
361
85
23.4
277
277
21.8
11.1
11.0
2017E
2,678
-0.9
0
2,678
1,784
43
357
0
494
18.5
130
32
80
413
94
22.8
319
319
15.1
11.3
10.5
(INR Billion)
2018E
3,080
15.0
0
3,080
2,078
46
386
0
571
18.5
143
39
99
488
121
24.8
367
367
15.3
11.5
10.5
Balance Sheet
Y/E March
Share Cap. (incl sh. Susp.)
Reserves
Net Worth
Total Loans
Deferred Tax
Capital Employed
Gross Fixed Assets
Less: Depreciation
Net Fixed Assets
Capital WIP
Investments
Curr. Assets, L & Adv.
Inventory
Debtors
Cash & Bank Balance
Loans&Adv.and Other CA
Current Liab. & Prov.
Liabilities
Provisions
Net Current Assets
Application of Funds
E: MOSL Estimates
2011
33
1483
1,515
674
116
2,305
2213
785
1,427
128
377
2012
33
1628
1,661
684
121
2,466
2055
918
1,137
78
540
2013
32
1768
1,800
724
122
2,646
2132
1034
1,097
191
525
2014
32
1,939
1,971
855
122
2,948
2,226
1,132
1,094
417
895
2015E
32
2,129
2,162
976
127
3,265
2,361
1,215
1,146
758
1,126
2016E
32.4
2,368
2,401
1,076
134
3,611
2,507
1,309
1,198
946
1,172
2017E
32.8
2,641
2,673
1,076
142
3,892
3,403
1,439
1,964
355
1,203
(INR Billion)
2018E
32.8
2,954.8
2,988
1,076
152
4,216
3,636
1,582
2,055
259
1,235
298
174
271
171
360
184
396
257
427
119
495
330
429
107
332
402
366
47
116
421
304
64
111
436
271
62
174
451
302
71
485
467
497
46
373
2,305
442
43
712
2,466
495
43
832
2,646
686
42
542
2,948
651
63
236
3,265
544
74
295
3,611
507
82
369
3,892
567
91
667
4,216
20 January 2016
24

Reliance Industries
Financials and valuations
Ratios
Y/E March
Basic (INR)
EPS
Adj. EPS (ex Treasury)
Cash EPS
Adj. Book Value
DPS
Payout (incl. Div. Tax.)
Valuation (x)
P/E
Adj. P/E
Cash P/E
EV / EBITDA
EV / Sales
Adj. P/B
Dividend Yield (%)
Profitability Ratios (%)
RoE
RoCE
Turnover Ratios
Debtors (No. of Days)
Fixed Asset Turnover (x)
Leverage Ratio
Net Debt / Equity (x)
2011
62.0
68.4
103.5
511.2
8.0
13.7
2012
61.3
67.7
96.1
560.7
8.5
14.7
2013
65.0
71.9
94.4
616.5
9.0
14.6
16.0
14.5
11.1
10.6
0.9
1.7
0.9
14.8
12.9
13.0
12.1
12.3
11.6
2014
68.0
75.2
95.2
674.2
9.5
16.4
15.3
13.9
11.0
11.1
0.9
1.5
0.9
11.7
11.1
2015E
70.2
77.6
96.4
738.5
10.0
16.7
14.9
13.4
10.8
11.4
1.1
1.4
1.0
11.0
10.2
2016E
85.4
94.5
114.5
819.3
12.2
16.7
12.2
11.0
9.1
9.1
1.4
1.3
1.2
12.1
11.5
2017E
97.3
107.4
136.8
901.1
13.9
16.7
10.7
9.7
7.6
7.5
1.4
1.2
1.3
12.6
11.9
2018E
112.2
123.8
155.7
1,006.9
16.0
16.7
9.3
8.4
6.7
6.1
1.1
1.0
1.5
13.0
13.0
21
1.1
20
1.5
15
1.7
11
1.8
8
1.4
7
1.1
9
0.9
8
0.9
0.2
0.0
-0.1
0.0
0.1
0.1
0.1
0.0
Cash Flow Statement
Y/E March
OP/(Loss) before Tax
Depreciation (excl. revaluation)
Interest expense
Direct Taxes Paid
(Inc)/Dec in Wkg. Capital
Interest/other income
Other op activities
CF from Op. Activity
(Inc)/Dec in FA & CWIP
Free Cash Flow
(Pur)/Sale of Investments
Interest/other income
Other In activities
CF from Inv. Activity
Change in Equity
Inc / (Dec) in Debt
Dividends Paid
CF from Fin. Activity
Inc / ( Dec) in Cash
Add: Opening Balance
Add: On Amalgamation
Closing Balance
2011
252
136
23
-42
1
-26
-11
333
-121
212
-141
23
35
-203
2
30
-24
7
137
135
271
2012
258
114
27
-48
-28
-44
-8
270
-80
190
62
19
-31
-30
-2
-85
-28
-115
125
271
396
2013E
263
95
30
-47
58
-62
-7
330
-159
171
22
65
-75
-148
-31
-23
-29
-83
99
396
495
2014
278
88
32
-61
145
-65
4
422
-325
97
-120
68
-264
-640
2
84
-31
55
-163
495
332
2015
295
85
24
-61
83
-54
-19
353
-427
-74
-84
66
-115
-560
2
21
-33
-10
-217
332
115
2016E
361
94
25
-77
-65
-52
0
287
-335
-47
-46
52
0
-329
0
75
-38
37
-5
115
110
2017E
413
130
32
-86
-11
-50
0
427
-305
122
-31
50
0
-286
0
-32
-46
-78
63
110
173
(INR Billion)
2018E
488
143
39
-111
13
-64
0
508
-137
370
-32
64
0
-105
0
-39
-53
-92
311
173
484
20 January 2016
25

Reliance Industries
Corporate profile
Company description
Exhibit 1: Sensex rebased
Reliance Industries Ltd (RIL), a For tune 500
company, is India's largest private sector enti ty, with
a turnover of USD66.8b and net profit of USD3. 9b.
Over the years, RIL has grown through backward
integ ration in energy chain (textiles, petchem,
refining and E &P) and is now moving into new areas
like organized retai l and BWA. It operates one of the
largest refining capacit y of 1.24mmbbl/d at a single
location and is the largest producer of polyester
fibre and yarn.
Source: MOSL/Bloomberg
Exhibit 2: Shareholding pattern (%)
Promoter
DII
FII
Others
Sep-15
45.2
13.1
21.9
19.9
Jun-15
45.2
12.6
22.3
19.8
Sep-14
45.3
11.3
22.8
20.7
Exhibit 3: Top holders
Holder Name
LIC of India
Abu Dhabi Investment Authority
Reliance Chemicals Limited
Reliance Polyolefins Limited
NA
% Holding
9.1
1.9
1.9
1.1
0.0
Source: Capitaline
Note: FII Includes depository receipts
Source: Capitaline
Exhibit 4: Top management
Name
Mukesh D Ambani
Hital R Meswani
Nikhil Rasiklal Meswani
Pawan Kumar Kapil
PMS Prasad
K Sethuraman
Designation
Chairman
&
Managing
Director
Executive Director
Executive Director
Executive Director
Executive Director
Company Secretary
Exhibit 5: Directors
Name
Ashok Misra
Dipak C Jain
Nita M Ambani
Yogendra Premkrishna Trivedi
Adil Zainulbhai
Name
Dharam Vir Kapur
Mansingh Laxmidas Bhakta
Raghunath Anant Mashelkar
Raminder Singh Gujral
Maheswar S Sahu
Source: Capitaline
*Independent
Exhibit 6: Auditors
Name
Bandyopadhyaya Bhaumik & Co
Chaturvedi & Shah
Delloite Haskins & Sells
Dilip M Malkar & Co
Diwanji & Associates
Type
Cost Auditor
Statutory
Statutory
Cost Auditor
Cost Auditor
Source: Capitaline
Exhibit 7: MOSL forecast v/s consensus
EPS
(INR)
FY16
FY17
FY18
MOSL
forecast
84.7
95.8
112.8
Consensus
forecast
81.4
94.3
105.1
Variation (%)
4.1
1.6
7.4
Source: Bloomberg
20 January 2016
26

Reliance Industries
NOTES
20 January 2016
27

Disclosures
This document has been prepared by Motilal Oswal Securities Limited (hereinafter referred to as Most) to provide information about the company(ies) and/sector(s), if any, covered in the report and may be distributed by it and/or its
Reliance Industries
affiliated company(ies). This report is for personal information of the selected recipient/s and does not construe to be any investment, legal or taxation advice to you. This research report does not constitute an offer, invitation or
inducement to invest in securities or other investments and Motilal Oswal Securities Limited (hereinafter referred as MOSt) is not soliciting any action based upon it. This report is not for public distribution and has been furnished to
you solely for your general information and should not be reproduced or redistributed to any other person in any form. This report does not constitute a personal recommendation or take into account the particular investment
objectives, financial situations, or needs of individual clients. Before acting on any advice or recommendation in this material, investors should consider whether it is suitable for their particular circumstances and, if necessary, seek
professional advice. The price and value of the investments referred to in this material and the income from them may go down as well as up, and investors may realize losses on any investments. Past performance is not a guide for
future performance, future returns are not guaranteed and a loss of original capital may occur.
MOSt and its affiliates are a full-service, integrated investment banking, investment management, brokerage and financing group. We and our affiliates have investment banking and other business relationships with a some
companies covered by our Research Department. Our research professionals may provide input into our investment banking and other business selection processes. Investors should assume that MOSt and/or its affiliates are
seeking or will seek investment banking or other business from the company or companies that are the subject of this material and that the research professionals who were involved in preparing this material may educate investors
on investments in such business. The research professionals responsible for the preparation of this document may interact with trading desk personnel, sales personnel and other parties for the purpose of gathering, applying and
interpreting information. Our research professionals are paid on the profitability of MOSt which may include earnings from investment banking and other business.
MOSt generally prohibits its analysts, persons reporting to analysts, and members of their households from maintaining a financial interest in the securities or derivatives of any companies that the analysts cover. Additionally, MOSt
generally prohibits its analysts and persons reporting to analysts from serving as an officer, director, or advisory board member of any companies that the analysts cover. Our salespeople, traders, and other professionals or affiliates
may provide oral or written market commentary or trading strategies to our clients that reflect opinions that are contrary to the opinions expressed herein, and our proprietary trading and investing businesses may make investment
decisions that are inconsistent with the recommendations expressed herein. In reviewing these materials, you should be aware that any or all of the foregoing among other things, may give rise to real or potential conflicts of interest.
MOSt and its affiliated company(ies), their directors and employees and their relatives may; (a) from time to time, have a long or short position in, act as principal in, and buy or sell the securities or derivatives thereof of companies
mentioned herein. (b) be engaged in any other transaction involving such securities and earn brokerage or other compensation or act as a market maker in the financial instruments of the company(ies) discussed herein or act as an
advisor or lender/borrower to such company(ies) or may have any other potential conflict of interests with respect to any recommendation and other related information and opinions.; however the same shall have no bearing
whatsoever on the specific recommendations made by the analyst(s), as the recommendations made by the analyst(s) are completely independent of the views of the affiliates of MOSt even though there might exist an inherent
conflict of interest in some of the stocks mentioned in the research report
Reports based on technical and derivative analysis center on studying charts company's price movement, outstanding positions and trading volume, as opposed to focusing on a company's fundamentals and, as such, may not match
with a report on a company's fundamental analysis. In addition MOST has different business segments / Divisions with independent research separated by Chinese walls catering to different set of customers having various
objectives, risk profiles, investment horizon, etc, and therefore may at times have different contrary views on stocks sectors and markets.
Unauthorized disclosure, use, dissemination or copying (either whole or partial) of this information, is prohibited. The person accessing this information specifically agrees to exempt MOSt or any of its affiliates or employees from, any
and all responsibility/liability arising from such misuse and agrees not to hold MOSt or any of its affiliates or employees responsible for any such misuse and further agrees to hold MOSt or any of its affiliates or employees free and
harmless from all losses, costs, damages, expenses that may be suffered by the person accessing this information due to any errors and delays. The information contained herein is based on publicly available data or other sources
believed to be reliable. Any statements contained in this report attributed to a third party represent MOSt’s interpretation of the data, information and/or opinions provided by that third party either publicly or through a subscription
service, and such use and interpretation have not been reviewed by the third party. This Report is not intended to be a complete statement or summary of the securities, markets or developments referred to in the document. While we
would endeavor to update the information herein on reasonable basis, MOSt and/or its affiliates are under no obligation to update the information. Also there may be regulatory, compliance, or other reasons that may prevent MOSt
and/or its affiliates from doing so. MOSt or any of its affiliates or employees shall not be in any way responsible and liable for any loss or damage that may arise to any person from any inadvertent error in the information contained in
this report. MOSt or any of its affiliates or employees do not provide, at any time, any express or implied warranty of any kind, regarding any matter pertaining to this report, including without limitation the implied warranties of
merchantability, fitness for a particular purpose, and non-infringement. The recipients of this report should rely on their own investigations.
This report is intended for distribution to institutional investors. Recipients who are not institutional investors should seek advice of their independent financial advisor prior to taking any investment decision based on this report or for
any necessary explanation of its contents.
Most and it’s associates may have managed or co-managed public offering of securities, may have received compensation for investment banking or merchant banking or brokerage services, may have received any compensation for
products or services other than investment banking or merchant banking or brokerage services from the subject company in the past 12 months.
Most and it’s associates have not received any compensation or other benefits from the subject company or third party in connection with the research report.
Subject Company may have been a client of Most or its associates during twelve months preceding the date of distribution of the research report
MOSt and/or its affiliates and/or employees may have interests/positions, financial or otherwise of over 1 % at the end of the month immediately preceding the date of publication of the research in the securities mentioned in this
report. To enhance transparency, MOSt has incorporated a Disclosure of Interest Statement in this document. This should, however, not be treated as endorsement of the views expressed in the report.
Motilal Oswal Securities Limited is registered as a Research Analyst under SEBI (Research Analyst) Regulations, 2014. SEBI Reg. No. INH000000412
There are no material disciplinary action that been taken by any regulatory authority impacting equity research analysis activities
Analyst Certification
The views expressed in this research report accurately reflect the personal views of the analyst(s) about the subject securities or issues, and no part of the compensation of the research analyst(s) was, is, or will be directly or
indirectly related to the specific recommendations and views expressed by research analyst(s) in this report. The research analysts, strategists, or research associates principally responsible for preparation of MOSt research receive
compensation based upon various factors, including quality of research, investor client feedback, stock picking, competitive factors and firm revenues
Disclosure of Interest Statement
Analyst ownership of the stock
Served as an officer, director or employee
RELIANCE INDUSTRIES
No
No
A graph of daily closing prices of securities is available at www.nseindia.com and http://economictimes.indiatimes.com/markets/stocks/stock-quotes
Regional Disclosures (outside India)
For U.S.
This report is not directed or intended for distribution to or use by any person or entity resident in a state, country or any jurisdiction, where such distribution, publication, availability or use would be contrary to law, regulation or which
would subject MOSt & its group companies to registration or licensing requirements within such jurisdictions.
Motilal Oswal Securities Limited (MOSL) is not a registered broker - dealer under the U.S. Securities Exchange Act of 1934, as amended (the"1934 act") and under applicable state laws in the United States. In addition MOSL is not a
registered investment adviser under the U.S. Investment Advisers Act of 1940, as amended (the "Advisers Act" and together with the 1934 Act, the "Acts), and under applicable state laws in the United States. Accordingly, in the
absence of specific exemption under the Acts, any brokerage and investment services provided by MOSL, including the products and services described herein are not available to or intended for U.S. persons.
This report is intended for distribution only to "Major Institutional Investors" as defined by Rule 15a-6(b)(4) of the Exchange Act and interpretations thereof by SEC (henceforth referred to as "major institutional investors"). This
document must not be acted on or relied on by persons who are not major institutional investors. Any investment or investment activity to which this document relates is only available to major institutional investors and will be
engaged in only with major institutional investors. In reliance on the exemption from registration provided by Rule 15a-6 of the U.S. Securities Exchange Act of 1934, as amended (the "Exchange Act") and interpretations thereof by
the U.S. Securities and Exchange Commission ("SEC") in order to conduct business with Institutional Investors based in the U.S., MOSL has entered into a chaperoning agreement with a U.S. registered broker-dealer, Motilal Oswal
Securities International Private Limited. ("MOSIPL"). Any business interaction pursuant to this report will have to be executed within the provisions of this chaperoning agreement.
The Research Analysts contributing to the report may not be registered /qualified as research analyst with FINRA. Such research analyst may not be associated persons of the U.S. registered broker-dealer, MOSIPL, and therefore,
may not be subject to NASD rule 2711 and NYSE Rule 472 restrictions on communication with a subject company, public appearances and trading securities held by a research analyst account.
For Hong Kong:
This report is distributed in Hong Kong by Motilal Oswal capital Markets (Hong Kong) Private Limited, a licensed corporation (CE AYY-301) licensed and regulated by the Hong Kong Securities and Futures Commission (SFC)
pursuant to the Securities and Futures Ordinance (Chapter 571 of the Laws of Hong Kong) “SFO”. As per SEBI (Research Analyst Regulations) 2014 Motilal Oswal Securities (SEBI Reg No. INH000000412) has an agreement with
Motilal Oswal capital Markets (Hong Kong) Private Limited for distribution of research report in Kong Kong. This report is intended for distribution only to “Professional Investors” as defined in Part I of Schedule 1 to SFO. Any
investment or investment activity to which this document relates is only available to professional investor and will be engaged only with professional investors.”
Nothing here is an offer or solicitation of these securities, products and services in any jurisdiction where their offer or sale is not qualified or exempt from registration. The Indian Analyst(s) who compile this report is/are not located in
Hong Kong & are not conducting Research Analysis in Hong Kong.
Motilal Oswal Capital Markets Singapore Pte Limited is acting as an exempt financial advisor under section 23(1)(f) of the Financial Advisers Act(FAA) read with regulation 17(1)(d) of the Financial Advisors Regulations and is a
subsidiary of Motilal Oswal Securities Limited in India. This research is distributed in Singapore by Motilal Oswal Capital Markets Singapore Pte Limited and it is only directed in Singapore to accredited investors, as defined in the
Financial Advisers Regulations and the Securities and Futures Act (Chapter 289), as amended from time to time.
In respect of any matter arising from or in connection with the research you could contact the following representatives of Motilal Oswal Capital Markets Singapore Pte Limited:
Kadambari Balachandran
Email : kadambari.balachandran@motilaloswal.com
Contact : (+65) 68189233 / 65249115
Office Address : 21 (Suite 31),16 Collyer Quay,Singapore 04931
For Singapore
20 January 2016
Motilal Oswal Tower, Level 9, Sayani Road, Prabhadevi, Mumbai 400 025
Phone: +91 22 3982 5500 E-mail: reports@motilaloswal.com
Motilal Oswal Securities Ltd
28