20 January 2016
3QFY16 Results Update | Sector:
Financials
BSE SENSEX
24,062
Bloomberg
Equity Shares (m)
52-Week Range (INR)
1, 6, 12 Rel. Per (%)
Avg Val (INR m)
Free float (%)
S&P CNX
7,309
IHFL IN
426.2
820 / 518
4/11/32
1315
76.4
CMP: INR689
Indiabulls Housing Finance
TP: INR907 (+32%)
Buy
Business momentum remains healthy; spreads and asset quality stable
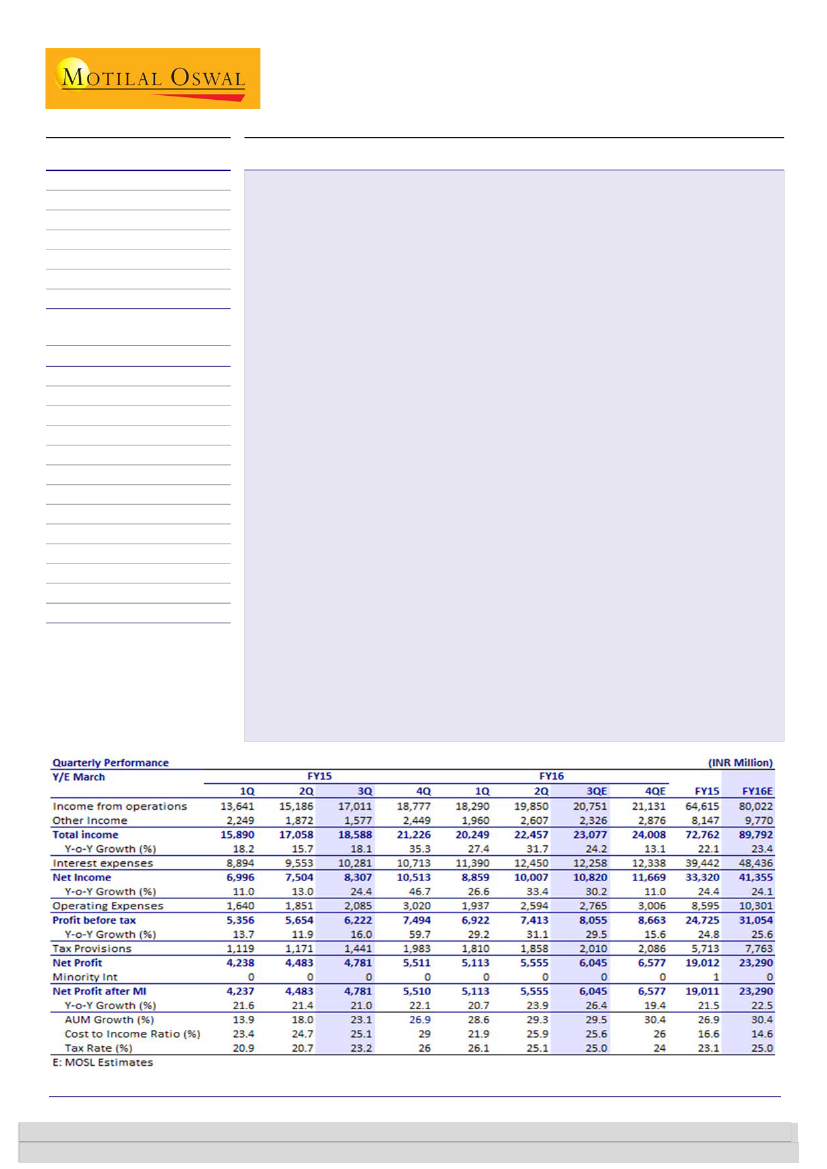
Indiabulls Housing Finance’s (IHFL) PAT grew 26% YoY and 9% QoQ to INR6.04b (in
line with est. of INR5.9b). Strong AUM growth of 29.5% YoY, stable asset quality
and book spreads of 320bp were the key highlights of the quarter.
Disbursements growth (+21% YoY) and lower repayments (5.9% YoY) drove AUM
up 29.5% YoY to INR622b. However, the mix will gradually change in favor of
housing loans—will increase from the existing 51% to 60% over the next two years;
LAP and LRD would be 20% each.
NII growth remained healthy at +26% YoY on the back of 320bp of book spreads
and 300bp incremental spreads, aided by reduction in cost of funds. Overall cost of
funds stood at 9.4% whereas incremental borrowing cost was under 9%. GNPAs
remained stable sequentially at 0.83% v/s 0.86% in 3QFY15 and credit cost stood
at 62bps v/s 67bp in FY15- PCR stood at 141% v/s 139% in 2Q16.
Other highlights:
a) Apart from CRISIL, ICRA, has started grading IHFL’s LAP book.
b) Due to uncertain market conditions, IHFL has shored up the cash levels to
INR140b and would keep it at high levels for next 2-3 quarters. c) ZCBs have come
down sharply and forms 3.1% of borrowings v/s 4.5% last year- wont issue further
ZCBs. d) Sold loans of INR10.4b during the quarter and INR29.15b in 9MFY15. e)
Reduction in risk weights has increased CAR by 170bps.
Valuation and view:
IHFL’s transformation from a diversified lender to a focused
mortgage player has yielded returns, with RoE/RoA improving from 3%/0.8% in
FY09 to +26%/3.5% in 9MFY16. Focus on mortgage and market share gains will
drive AUM growth of 24% for the next three years. IHFL is among the lowest-
levered HFCs (4.3x) to support growth. Asset quality trend is likely to remain
stable. Improved borrowing profile, better credit rating and liquidity buffer will aid
the company maintain healthy spreads. De-risked business model, superior
profitability and +5% dividend yield warrant premium. The stock is trading at PBV
of 2.3x FY17E. Maintain
Buy
with a target price of INR907 (3x FY17E PB).
M.Cap. (INR b) / (USD b) 293.7/4.3
Financials & Valuation (INR Billion)
Y/E March
Net Fin inc
PPP
EPS (INR)
EPS Gr. (%)
BV/Sh. INR
RoA on AUM (%)
2016E 2017E 2018E
31.6
35.3
54.5
2.0
274
3.4
25.4
57.8
12.6
2.5
2.5
4.6
40.0
44.5
67.6
24.0
302
3.3
23.4
50.0
10.2
2.3
2.3
4.9
47.9
53.2
82.0
21.3
336
3.2
25.7
50.0
8.4
2.0
2.0
5.9
RoE (%)
Payout (%)
Valuations
P/E (x)
P/BV (x)
P/ABV (x)
Div. Yield (%)
Sunesh Khanna
(Sunesh.Khanna@MotilalOswal.com); +91 22 3982 5521
Alpesh Mehta
(Alpesh.Mehta@MotilalOswal.com) /
Harshvardhan Agrawal
(Harshvardhan.Agrawal@MotilalOswal.com)
Investors are advised to refer through important disclosures made at the last page of the Research Report.
Motilal Oswal research is available on www.motilaloswal.com/Institutional-Equities, Bloomberg, Thomson Reuters, Factset and S&P Capital.

Indiabulls Housing Finance
Exhibit 1: Quarterly performance v/s expectations and deviations for the same
Particulars
Income from operations
Other Income
Total income
Interest expenses
Net Income
Operating Expenses
Profit before Tax
Tax Provisions
Net Profit
Int Exp/ operating inc (%)
Other Income / Total Income (%)
Cost to Income Ratio (%)
Tax Rate (%)
3QFY16A
20,751
2,326
23,077
12,258
10,820
2,765
8,055
2,010
6,045
59.1
10.1
25.6
25.0
3QFY16E
20,446
2,809
23,255
12,575
10,680
2,723
7,956
2,069
5,888
61.5
12.1
25.5
26.0
Var. (%)
1
-17
-1
-3
1
2
1
-3
3
Comments
In-line
Stable yields and lower cost of fund let to net income beat
Higher provisioning towards loan assets
In-line with estimate
Source: Company, MOSL
AUM growth up at +29.5% YoY; Lower repayments at 5.9% YoY
Strong disbursements at INR64.7b, grew 21% YoY and 5% QoQ, led to +29%
AUM growth at INR622.7b.
The overall AUM mix skewed continues to be in favor of mortgages (share
remaining stable at 76%), with share of corporate rising to 23%. Share of
commercial vehicle segment continued to fall (as the company is winding off the
CV lending) to 1% of AUM as compared to 3% in 3QFY15.
Management continues to guide growth of upwards of 25%. However the mix
will gradually change in favor of housing loans, will increase from existing 51% to
60% over next 2 years, LAP & LRD would be 20% each.
Lower cost of fund and stable spreads led to 26% YoY NII growth
NII growth remained healthy at 26% YoY, on back of stable spreads (book
spreads of 320bp) aided by reduction in cost of funds. Overall cost of funds at
9.4% (9.45% in Q2FY16) and incremental borrowing at 9%.
Borrowings increased 29.4% YoY to INR636.3b. The company reduced its
exposure to high cost bank borrowings to 49% (v/s 53% in 3QFY15). Bank
borrowings are substituted by NCD/CP (31% v/s 28% in 3QFY15) and ECBs (2%
during the quarter v/s 1% in the previous year).
ZCBs have come down sharply and now form 3.1% of borrowings v/s 4.5% last
year. The company has decided not to issue further ZCBs.
Asset quality continue to remain stable
GNPA% remained steady at 0.83% and NNPA at 0.35% respectively. GNPAs have
remained stable over the last several quarter; hovering at 0.83%-0.88%.
Management indicated that outlook on asset quality remain healthy and it
continues to be a key focus area with target to maintain asset quality in the
range of 70-90bp.
Other highlights:
a) Apart from CRISIL, ICRA, has started grading IHFL’s LAP
book. b) Due to uncertain market conditions, IHFL has shored up the cash levels
to INR140b and would keep it at high levels for next 2-3 quarters. d) Sold loans
of INR10.4b during the quarter and INR29.15b in 9MFY15. e) Risk weights
changes have increased CAR by 170bps. f) The stock provides a dividend yield of
+5% at current prices.
2
20 January 2016

Indiabulls Housing Finance
Valuation and view
Indiabulls Housing Finance Ltd (IHFL) has transformed from a diversified lender
to a focused mortgage player. Mortgage focus has yielded returns, with
RoE/RoA improving from 3%/0.8% in FY09 to +26%/3.5% in 9MFY16.
IHFL has devised a unique strategy – 76% of the book forms mortgage/LAP
(which keeps asset quality under check) and 24% of book forms commercial
credit and commercial vehicles (supports blended spreads of +300bp), thereby
enabling sound asset quality with superior returns.
Disbursement growth has picked up, we believe focus on mortgage and market
share gains will drive AUM growth of ~24% for next three years. One of the
lowest levered HFC (4.3x) and with capital raising completed IHFL would need
no further dilution over the medium term.
Consistent outperformance on key parameters relative to sector. Average three-
year RoE at +27% is the best among the peer group. The company offers
superior return ratios with +5% dividend yield. The stock is trading at PBV of
2.3x FY17. Maintain
Buy
with a target price of INR907 (3x FY17 PB).
Conference call highlights
Guidance:
1) Loan growth to remain at +25% 2) Maintain GNPA at 70-90bps and
NNPA at 30-50bps. 3) Target loan book share of 60% home loan; in 2 years from
existing 51% 4) would maintain spreads of ~ 300bps. 5) Credit cost to be in the
range of 55-60bps.
Borrowings: Due to uncertain market conditions, IHFL has shored up the cash
levels to INR140b and would keep it at high levels (+INR150b) for next 2-3
quarters.
Targets to reduce bank borrowing to 40% by FY17 this will help further
reduction in cost of funds. Bond issuances have been healthy, and along with
ECBs, contributed to 47% of the incremental borrowings in the last 12 months
Asset quality:
Pala Royale is doing distress sale- paying interest and servicing
debt; while it’s making timely payments to IHFL, the company is not recognizing
the interest on same and has also made provisions on it. Provision breakup
(INR380m standard asset; write-off INR450m (largely CVs) and INR350m of
specific asset.
ZCBs: ZCBs have come down sharply and forms 3.1% of borrowings v/s 4.5%
last year- wont issue further ZCBs.
Dividend Policy:
Dividends to be capped at INR9/sh until reaches 50% dividend
payout (Expected until 4QFY17). Dividend payout would then stabilize at 50%.
Others:
1) Company plans to sell down total 20% of the incremental loans on
steady state basis and expects 20% of funding to come from sell down (3QFY16:
12%) 2) Expect avg tkt size to increase to INR35lac over the medium term. 3)
Sold loans of INR10.4b during the quarter and INR29.15b in 9MFY15.4) Risk
weight changes helped shore up CAR by 170bps
Industry outlook:
Recent reports indicate affordable housing turning around the
industry. There is a divergent trend in 15-75 lac v/s +75lac is very large; while
the former is seeing a healthy growth large ticket home sales are muted.
RoA:
Reduction in credit cost and improving cost to income to add 10bps of
RoAs going ahead.
3
20 January 2016

Indiabulls Housing Finance
Exhibit 2: Quarterly Snapshot
FY14
1Q
Profit and Loss (INR m)
Income from operations
Interest Expenses
Net Interest Income
Other Income
Total Income
Operating Expenses
Employee
Others
PBT
Taxes
PAT
PAT Post Minority
Interest
Asset Quality
GNPA (INR m)
NNPA (INR m)
Gross NPAs (%)
Net NPAs (%)
Provisions on AUM (%)
Margins (%) - (calculated)
Yield on loans
Cost of funds
Spreads
NIMs
Ratios (%)
Cost to Income
Tax Rate
RoE (Calc.)
RoA (Calc.)
2Q
3Q
4Q
1Q
2Q
FY15
3Q
4Q
1Q
FY16
2Q
3QE
Variation (%)
QoQ
YoY
5
-2
15
-11
8
7
-4
14
9
8
9
9
22
19
26
48
30
33
24
38
29
39
26
26
12,097 14,007 14,866 13,224 13,641 15,186 17,011 18,777 18,290 19,850 20,751
7,136 8,098 9,068 8,522 8,894 9,553 10,281 10,713 11,390 12,450 12,258
4,961 5,909 5,799 4,702 4,747 5,632 6,730 8,064 6,900 7,400 8,493
1,343
735
879
2,463 2,249 1,872 1,577 2,449 1,960 2,607 2,326
6,303 6,644 6,678 7,164 6,996 7,504 8,307 10,513 8,859 10,007 10,820
1,593 1,590 1,316 2,473 1,640 1,851 2,085 3,020 1,937 2,594 2,765
694
673
688
583
716
894
817
822
914
1,059 1,012
899
917
628
1,890
924
956
1,268 2,198 1,023 1,535 1,753
4,711 5,053 5,362 4,692 5,356 5,654 6,222 7,494 6,922 7,413 8,055
1,196 1,350 1,411
176
1,119 1,171 1,441 1,983 1,810 1,858 2,010
3,515 3,704 3,951 4,515 4,238 4,483 4,781 5,511 5,113 5,555 6,045
3,484
3,691
3,951
4,515
4,237
4,483
4,781
5,510
5,113
5,555
6,045
2,876
1,248
0.78
0.34
0.44
3,244
1,672
0.85
0.44
0.41
3,438
1,868
0.88
0.48
0.40
3,417
1,475
0.83
0.36
0.47
3,529
1,463
0.84
0.35
0.49
3,827
1,523
0.85
0.34
0.51
4,135
1,626
0.86
0.34
0.52
3,913
1,871
0.85
0.36
0.49
4,071
1,935
0.85
0.36
0.49
4,309
2,028
0.84
0.35
0.49
4,553
2,169
0.83
0.35
0.48
6
7
10
33
10.0
8.8
1.2
5.2
11.4
9.5
2.0
5.6
11.8
10.3
1.5
5.5
9.9
9.6
0.3
5.5
9.8
9.7
0.1
4.9
10.2
9.7
0.6
4.7
11.2
9.1
2.1
5.2
12.0
8.9
3.1
6.1
11.1
9.3
1.8
5.2
11.2
9.6
1.6
5.2
10.7
8.4
2.3
5.2
25.3
25.4
27.46
3.49
23.9
26.7
28.25
3.64
19.7
26.3
31.80
4.09
34.5
3.8
29.86
3.73
23.4
20.9
30.48
3.74
24.7
20.7
31.23
3.72
25.1
23.2
34.54
3.98
28.7
26.5
30.72
3.49
21.9
26.1
26.07
3.51
25.9
25.1
23.08
3.49
25.6
25.0
24.29
3.56
Business Details
Disbursements-Quarterly
(INR m)
35,500 35,000 31,150 38,000 36,700 48,000 53,500 64,190 45,250 61,900 64,740
AUM (INR m)
368,740 381,608 390,690 411,690 420,140 450,268 480,780 522,350 540,215 582,246 622,650
Borrowings (INR m)
333,720 350,120 355,390 355,400 378,640 411,030 491,560 474,870 508,630 527,620 636,290
Total AUM Mix (%)
Mortgages
Corporate
CV
Liability Mix (%)
Bank Loans
CP
NCD
ECB
Other Details
Dividend (INR/sh)
20 January 2016
5
7
21
21
30
29
72
21
7
61
8
31
0
6
73
21
6
59
6
25
0
7
73
21
6
55
7
27
0
7
74
21
5
62
8
30
0
9
75
21
4
60
8
32
0
8
76
21
3
54
7
28
0
9
76
21
3
53
7
28
1
9
76
22
2
59
7
31
3
9
76
22
2
55
7
35
3
9
76
23
1
47
6
33
2
9
76
23
1
49
6
31
2
9
0
0
Source: Company, MOSL
4

Indiabulls Housing Finance
Story in charts
Exhibit 3: Disb. Growth picks up at +21% YoY
Disbursement (INR b)
Exhibit 4: AUM growth of ~29% boosted by healthy disb. Gr.
47
AUM (INR b)
AUM Gr. (%)
42
35
44
36 33 35
42
36 35 31 38 37
48
54
64
45
62 65
39 41
30 30
25 25 23
20 20
18
23
27 29 29 30
14
Source: Company, MOSL
*AUM numbers are reclassified, hence not comparable
Exhibit 5: AUM mix squeezed further in favor of mortgage
Others
CV
Corporate
Mortgages
Exhibit 6: Bank borrowing at 49% of overall borrowing
Bank Loans (%)
CP (%)
NCD (%)
ECB(%)
Sell Down (%)
8 8 8 8 8 7 7 6 6 5 4 3 3 2 2 1 1
23 23
20 21 21 21 20 21 21 21 21 21 21 21 21 22 22
71 71 71 71 72 72 72 73 73 74 75 76 76 76 76 76 76
11
3 3 12 12
23 24 28 27 29 30 31
30 32
31 35 2 2
25 27
28 28
9 10 10 8 8
33 31
8 8 6
8 8
7 7
7
7 7
6 6
68 66 62 65 63 62 61 59
55 62 60 54 53 59 55 47 49
10
Source: Company, MOSL
Exhibit 7: Asset quality remains healthy
GNPA (%)
NNPA (%)
Exhibit 8: Net gearing (x) declines due to capital raising
5.6 5.7
5.1 5.1 5.3 5.3
6.1 5.9 6.3
3.9
4.3
0.8 0.8 0.8 0.8 0.8 0.8 0.8
0.3 0.3 0.3 0.3 0.3 0.3
0.9 0.9 0.8 0.8 0.9 0.9 0.9 0.9 0.8 0.8
0.4 0.5
4.5 4.7
4.1 4.3
3.7 3.9
0.3
0.4 0.4 0.3 0.3 0.4 0.4 0.4 0.4
Source: Company, MOSL
20 January 2016
5

Indiabulls Housing Finance
Exhibit 9: Valuation Matrix
66
Rating
CMP
Mcap
EPS (INR)
P/E (x)
BV (INR)
P/BV (x)
RoA (%)
RoE (%)
FY16
14.1
18.4
16.7
13.9
18.9
16.7
10.2
8.4
12.3
9.4
10.9
7.8
-6.3
6.9
6.5
11.2
8.0
7.5
9.5
10.3
3.7
1.2
23.6
19.9
15.6
24.9
28.3
16.8
22.8
20.5
14.0
11.5
19.9
14.0
25.8
FY17
15.0
19.3
17.5
14.8
21.0
15.9
10.8
9.5
12.4
10.3
12.7
10.1
2.7
10.5
9.8
13.2
10.3
10.2
12.9
12.2
5.7
8.0
22.3
21.2
17.2
23.6
27.8
20.7
17.6
17.2
15.0
13.3
18.8
16.1
27.2
(INR) (USDb) FY16 FY17 FY16 FY17 FY16 FY17 FY16 FY17 FY16 FY17
ICICIBC*
Buy
224
19.7 20.7 24.8 7.2
5.5
131 149
1.13
0.91 1.49 1.54
HDFCB
Buy
1,017
38.6 49.1 59.3 20.7 17.2 285 331
3.57
3.08 1.88 1.86
AXSB
Buy
389
14.0 33.9 40.8 11.5
9.5
216 249
1.80
1.56 1.61 1.65
KMB*
Neutral
663
18.3 18.4 24.7 36.1 26.8 182 206
3.64
3.21 1.09 1.38
YES
Buy
645
4.1
57.3 74.5 11.3
8.6
325 385
1.98
1.68 1.60 1.70
IIB
Buy
867
7.7
39.0 50.1 22.2 17.3 293 337
2.95
2.58 1.92 2.04
DCBB
Under Review
71
0.3
5.9
6.9 12.0 10.3
61
68
1.17
1.05 0.95 0.93
FB
Neutral
48
1.2
3.9
4.7 12.1 10.0
48
52
0.99
0.92 0.77 0.83
JKBK
Neutral
67
0.5
16.2 18.0 4.1
3.7
138 152
0.49
0.44 1.00 1.02
SIB
Buy
18
0.4
2.5
3.1
7.0
5.8
29
31
0.63
0.58 0.55 0.58
Private Aggregate
104.8
16.4 13.6
2.41
2.12
SBIN (cons)*
Buy
174
20.4 23.2 31.0 7.0
5.2
229 254
0.71
0.63 0.67 0.78
PNB
Under Review
88
2.6
15.9 22.8 5.5
3.8
215 235
0.41
0.37 0.50 0.64
BOI
Neutral
91
1.1 -21.1 9.3 -4.3
9.9
341 350
0.27
0.26 -0.26 0.10
BOB
Buy
121
4.2
11.6 19.3 10.4
6.3
176 191
0.69
0.63 0.36 0.55
CBK
Under Review
172
1.3
34.8 57.3 5.0
3.0
566 610
0.30
0.28 0.31 0.46
UNBK
Buy
111
1.2
32.1 43.1 3.5
2.6
308 344
0.36
0.32 0.55 0.66
OBC
Under Review
104
0.5
36.4 50.0 2.9
2.1
467 505
0.22
0.21 0.45 0.56
INBK
Buy
89
0.6
20.2 29.5 4.4
3.0
277 300
0.32
0.30 0.48 0.62
CRPBK
Neutral
37
0.1
12.6 18.7 2.9
2.0
137 152
0.27
0.24 0.42 0.57
ANDB
Buy
50
0.5
17.8 22.8 2.8
2.2
180 196
0.28
0.25 0.55 0.62
IDBI
Neutral
55
1.3
5.3
8.5 10.4
6.5
146 153
0.38
0.36 0.23 0.34
DBNK
Neutral
35
0.3
1.5 10.0 23.5
3.5
120 128
0.29
0.27 0.06 0.38
Public Aggregate
34.2
8.2
5.3
0.55
0.51
HDFC*
Under Review 1,135
27.1
35
41
19.9 14.9 165 188
4.19
3.24 2.42 2.51
LICHF
Buy
460
3.5
34
42
13.7 10.9 182 216
2.53
2.13 1.48 1.54
DEWH
Buy
183
0.8
26
33
7.0
5.6
179 204
1.03
0.90 1.27 1.29
IHFL
Buy
689
4.5
53
68
12.9 10.1 274 302
2.52
2.28 3.73 3.85
GRHF
Buy
236
1.3
7
8
35.5 28.5
24
28
10.02 8.36 2.13 1.98
REPCO
Buy
594
0.6
24
35
25.2 17.2 151 182
3.93
3.27 2.08 2.28
RECL
Under Review
178
2.7
63
57
2.8
3.1
301 345
0.59
0.52 3.21 2.45
POWF
Under Review
155
3.1
54
52
2.8
3.0
285 323
0.54
0.48 3.08 2.63
SHTF
Buy
750
2.6
62
73
12.1 10.3 457 515
1.64
1.46 2.08 2.29
MMFS
Buy
220
1.9
12
15
18.2 14.4 109 120
2.01
1.83 1.93 2.22
BAF
Buy
5,641
4.6
224 276 25.2 20.4 1,351 1,582 4.17
3.57 3.12 2.92
MUTH
Buy
176
1.1
19
24
9.4
7.4
140 155
1.26
1.13 2.60 2.85
SKSM
Buy
449
0.9
25
34
18.3 13.3 107 141
4.19
3.18 5.55 5.59
NBFC Aggregate
55.4
12.8 11.8
2.20
1.95
*Multiples adj. for value of key ventures/Investments; For ICICI Bank and HDFC Ltd BV is adjusted for investments in subsidiaries
20 January 2016
6

Indiabulls Housing Finance
Financials and valuations
Income Statement
Y/E March
Financing Income
Financing Charges
Net Financing income
Change (%)
Income from Investments
Fee based income
Net Income
Change (%)
Employee Cost
Other Operating Exp.
Operating profits
Change (%)
Total Provisions
% of operating profit
PBT
Tax
Tax Rate (%)
PAT
Change (%)
Minority Interest
PAT
Change (%)
Dividend (Including tax)
Balance Sheet
Y/E March
Capital
Equity Share Capital
Preference Capital
Reserves & Surplus
Net Worth
Equity Net worth
Minority Interest
Borrowings
Change (%)
Deferred Tax Liability
Total Liabilities
Cash and bank balance
Investments
Change (%)
Loans
Change (%)
Net Current Assets
Net Fixed Assets
Total Assets
2011
21,246
8,995
12,252
50.3
1,016
2,465
16,105
55.3
1,656
1,816
12,632
57.5
2,717
21.5
9,915
2,406
24.3
7,509
144.2
82
7,427
146.5
3,620
2012
32,235
19,201
13,035
6.4
1,980
3,604
19,264
19.6
1,924
1,770
15,570
23.3
2,349
15.1
13,220
3,156
23.9
10,065
34.0
83
9,981
34.4
4,709
2013
42,634
25,991
16,643
27.7
2,748
2,397
21,789
13.1
2,245
1,761
17,783
14.2
1,231
6.9
16,551
3,891
23.5
12,661
25.8
76
12,584
26.1
7,277
2014
51,865
32,824
19,041
14.4
4,852
2,329
26,222
20.3
2,637
1,470
22,115
24.4
2,297
10.4
19,818
4,133
20.9
15,685
23.9
44
15,642
24.3
11,298
2015
61,210
39,442
21,768
14.3
8,055
3,439
33,262
26.8
3,249
2,285
27,728
25.4
3,003
10.8
24,725
5,713
23.1
19,012
21.2
1
19,011
21.5
10,531
2016E
80,022
48,436
31,586
45.1
6,846
2,923
41,355
24.3
3,801
2,228
35,326
27.4
4,272
12.1
31,054
7,763
25.0
23,290
22.5
50
23,240
22.2
15,717
2017E
98,675
58,703
39,973
26.6
8,010
3,420
51,403
24.3
4,561
2,340
44,502
26.0
5,495
12.3
39,007
10,142
26.0
28,865
23.9
50
28,815
24.0
16,857
(INR Million)
2018E
122,600
74,696
47,903
19.8
9,212
3,933
61,098
18.9
5,474
2,456
53,168
19.5
5,885
11.1
47,283
12,294
26.0
34,990
21.2
50
34,940
21.3
20,440
2011
622
622
0
44,779
45,401
45,401
1,211
193,187
146.1
-722
239,077
21,413
30,894
164.4
194,297
84.6
-7,971
444
239,077
2012
624
624
0
48,432
49,056
49,056
1,315
252,870
30.9
-1,098
302,143
41,956
17,968
-41.8
254,675
31.1
-12,901
445
302,143
2013
625
625
0
51,061
51,686
51,686
1,449
312,858
23.7
-1,641
364,351
48,882
23,079
28.4
307,824
20.9
-15,889
456
364,351
2014
668
668
0
56,387
57,055
57,055
19
355,395
13.6
-1,848
410,622
44,190
29,470
27.7
354,446
15.1
-18,639
469
410,622
2015
711
711
0
65,606
66,317
66,317
20
474,874
33.6
-26
541,186
34,903
61,638
109.2
460,396
29.9
-16,978
541
541,186
2016E
852
852
0
116,050
116,902
116,902
20
555,685
17.0
-26
672,582
45,100
67,801
10.0
578,839
25.7
-20,374
529
672,582
2017E
852
852
0
128,008
128,861
128,861
20
699,992
26.0
-26
828,847
40,637
74,582
10.0
736,834
27.3
-24,448
557
828,847
2018E
852
852
0
142,508
143,360
143,360
20
923,842
32.0
-26
1,067,196
60,281
82,040
10.0
952,414
29.3
-28,849
625
1,067,196
20 January 2016
7

Indiabulls Housing Finance
Financials and valuations
Ratios
Y/E March
Spreads Analysis (%)
Avg. Yield - on Fin. Portfolio
Avg Cost of funds
Interest Spread on on books
Net Interest Margin on AUM
Profitability Ratios (%)
RoE
RoA
RoA (on AUM)
Int. Expended/Int.Earned
Fee income/Net Inc.
Cost/Income Ratio
Empl. Cost/Op. Exps.
Asset quality
GNPA (%)
NNPA (%)
Valuations
Book Value (INR)
BV Growth (%)
Price-BV (x)
Adjusted BV (INR)
Price-ABV (x)
EPS (INR)
EPS Growth (%)
Price-Earnings (x)
DPS (INR)
Dividend Payout (%)
Dividend Yield (%)
E: MOSL Estimates
2011
14.6
6.6
8.0
7.9
2012
14.1
8.6
5.5
5.5
2013
13.5
10.1
3.4
5.4
2014
13.1
10.1
3.0
5.0
2015
12.7
9.7
3.0
4.7
2016E
13.0
9.4
3.6
5.2
2017E
12.8
9.4
3.4
5.2
2018E
12.5
9.2
3.3
4.9
16.8
4.1
4.0
42.3
15.3
21.6
47.7
21.1
3.7
3.5
59.6
18.7
19.2
52.1
25.0
3.8
3.5
61.0
11.0
18.0
56.1
27.0
4.0
3.6
63.3
8.9
17.1
64.2
30.8
4.0
3.6
64.4
10.3
16.6
58.7
25.4
3.8
3.4
60.5
7.1
14.6
63.0
23.4
3.8
3.3
59.5
6.7
13.4
66.1
25.7
3.7
3.2
60.9
6.4
13.0
69.0
1.03
0.38
2011
146.0
5.0
146.3
23.9
145.6
10.0
48.7
0.79
0.33
2012
157.3
7.8
4.4
157.4
4.4
32.0
34.0
21.4
13.0
40.6
1.9
0.79
0.33
2013
165.4
5.1
4.1
165.4
4.1
40.3
25.8
17.0
20.0
49.6
2.9
0.83
0.36
2014
170.8
3.3
4.0
170.8
4.0
46.8
16.3
14.6
29.0
61.7
4.2
0.85
0.36
2015
186.5
9.2
3.7
186.5
3.7
53.5
14.2
12.8
26
47.9
3.8
0.80
0.40
2016E
274.3
47.0
2.5
274.3
2.5
54.5
2.0
12.6
31.5
57.8
4.6
0.80
0.40
2017E
302.3
10.2
2.3
302.3
2.3
67.6
24.0
10.1
33.8
50.0
4.9
0.80
0.40
2018E
336.3
11.3
2.0
336.3
2.0
82.0
21.3
8.4
41.0
50.0
6.0
20 January 2016
8

Indiabulls Housing Finance
Corporate profile
Company description
Indiabulls Housing Finance (IHFL) is the fourth
largest housing finance company in India with
AUM of INR522b. It was established as a wholly-
owned subsidiary of Indiabulls Financial Services
(IBFSL). In early 2013, keeping with IHFL’s long-
term commitment to the housing finance business,
the company was reversed-merged into its housing
finance subsidiary IHFL. IHFL offers home loans to
target client base of middle and upper-middle
income individuals and small and medium-sized
enterprises, or SMEs. It has presence across 200+
locations across India.
Exhibit 11: Shareholding pattern (%)
Sep-15
Promoter
DII
FII
Others
23.6
1.5
44.7
30.1
Jun-15
27.8
2.7
39.4
30.1
Sep-14
27.9
3.1
41.0
28.1
Exhibit 10: Sensex rebased
Exhibit 12: Top holders
Holder Name
Europacific Growth Fund
Copthall Mauritius Investment Ltd
Cinnamon Capital Ltd
Rajiv Rattan
Merrill Lynch Capital Markets Espana S A S V
%
Holding
6.3
4.9
3.5
3.5
3.1
Note: FII Includes depository receipts
Exhibit 13: Top management
Name
Sameer Gehlaut
Gagan Banga
Ashwini Kumar
Mukesh Garg
Pinank Shah
Ramnath Shenoy
Designation
Chairman
Vice Chairman and MD
Deputy Managing Director
Chief Financial Officer
Head Treasury
Executive Vice President, IR
Exhibit 14: Directors
Name
Sameer Gehlaut
Gagan Banga
Rajiv Rattan
Saurabh Kumar Mittal
Karan Singh Khera*
Ram Kumar Sheokand*
Prem Prakash Mirdha*
*Independent
Name
Shamsher Singh Ahlawat*
Aisharya Katoch
Joginder Singh Kataria
Ajit Kumar Mittal
Ashwini Omprakash Kumar
Kamalesh Shailesh Chandra Chakrabarty*
Exhibit 15: Auditors
Name
Deloitte Haskins & Sells LLP
N D Kapur & Co
Type
Statutory
Internal
Exhibit 16: MOSL forecast v/s consensus
EPS
(INR)
FY16
FY17
FY18
MOSL
forecast
54.5
67.6
82.0
Consensus
forecast
58.9
70.0
83.9
Variation
(%)
-7.4
-3.4
-2.3
20 January 2016
9

Disclosures
This document has been prepared by Motilal Oswal Securities Limited (hereinafter referred to as Most) to provide information about the company(ies) and/sector(s), if any, covered in the report and may be distributed by it and/or its
Indiabulls Housing Finance
affiliated company(ies). This report is for personal information of the selected recipient/s and does not construe to be any investment, legal or taxation advice to you. This research report does not constitute an offer, invitation or
inducement to invest in securities or other investments and Motilal Oswal Securities Limited (hereinafter referred as MOSt) is not soliciting any action based upon it. This report is not for public distribution and has been furnished to
you solely for your general information and should not be reproduced or redistributed to any other person in any form. This report does not constitute a personal recommendation or take into account the particular investment
objectives, financial situations, or needs of individual clients. Before acting on any advice or recommendation in this material, investors should consider whether it is suitable for their particular circumstances and, if necessary, seek
professional advice. The price and value of the investments referred to in this material and the income from them may go down as well as up, and investors may realize losses on any investments. Past performance is not a guide for
future performance, future returns are not guaranteed and a loss of original capital may occur.
MOSt and its affiliates are a full-service, integrated investment banking, investment management, brokerage and financing group. We and our affiliates have investment banking and other business relationships with a some
companies covered by our Research Department. Our research professionals may provide input into our investment banking and other business selection processes. Investors should assume that MOSt and/or its affiliates are
seeking or will seek investment banking or other business from the company or companies that are the subject of this material and that the research professionals who were involved in preparing this material may educate investors
on investments in such business. The research professionals responsible for the preparation of this document may interact with trading desk personnel, sales personnel and other parties for the purpose of gathering, applying and
interpreting information. Our research professionals are paid on the profitability of MOSt which may include earnings from investment banking and other business.
MOSt generally prohibits its analysts, persons reporting to analysts, and members of their households from maintaining a financial interest in the securities or derivatives of any companies that the analysts cover. Additionally, MOSt
generally prohibits its analysts and persons reporting to analysts from serving as an officer, director, or advisory board member of any companies that the analysts cover. Our salespeople, traders, and other professionals or affiliates
may provide oral or written market commentary or trading strategies to our clients that reflect opinions that are contrary to the opinions expressed herein, and our proprietary trading and investing businesses may make investment
decisions that are inconsistent with the recommendations expressed herein. In reviewing these materials, you should be aware that any or all of the foregoing among other things, may give rise to real or potential conflicts of interest.
MOSt and its affiliated company(ies), their directors and employees and their relatives may; (a) from time to time, have a long or short position in, act as principal in, and buy or sell the securities or derivatives thereof of companies
mentioned herein. (b) be engaged in any other transaction involving such securities and earn brokerage or other compensation or act as a market maker in the financial instruments of the company(ies) discussed herein or act as an
advisor or lender/borrower to such company(ies) or may have any other potential conflict of interests with respect to any recommendation and other related information and opinions.; however the same shall have no bearing
whatsoever on the specific recommendations made by the analyst(s), as the recommendations made by the analyst(s) are completely independent of the views of the affiliates of MOSt even though there might exist an inherent
conflict of interest in some of the stocks mentioned in the research report
Reports based on technical and derivative analysis center on studying charts company's price movement, outstanding positions and trading volume, as opposed to focusing on a company's fundamentals and, as such, may not match
with a report on a company's fundamental analysis. In addition MOST has different business segments / Divisions with independent research separated by Chinese walls catering to different set of customers having various
objectives, risk profiles, investment horizon, etc, and therefore may at times have different contrary views on stocks sectors and markets.
Unauthorized disclosure, use, dissemination or copying (either whole or partial) of this information, is prohibited. The person accessing this information specifically agrees to exempt MOSt or any of its affiliates or employees from, any
and all responsibility/liability arising from such misuse and agrees not to hold MOSt or any of its affiliates or employees responsible for any such misuse and further agrees to hold MOSt or any of its affiliates or employees free and
harmless from all losses, costs, damages, expenses that may be suffered by the person accessing this information due to any errors and delays. The information contained herein is based on publicly available data or other sources
believed to be reliable. Any statements contained in this report attributed to a third party represent MOSt’s interpretation of the data, information and/or opinions provided by that third party either publicly or through a subscription
service, and such use and interpretation have not been reviewed by the third party. This Report is not intended to be a complete statement or summary of the securities, markets or developments referred to in the document. While we
would endeavor to update the information herein on reasonable basis, MOSt and/or its affiliates are under no obligation to update the information. Also there may be regulatory, compliance, or other reasons that may prevent MOSt
and/or its affiliates from doing so. MOSt or any of its affiliates or employees shall not be in any way responsible and liable for any loss or damage that may arise to any person from any inadvertent error in the information contained in
this report. MOSt or any of its affiliates or employees do not provide, at any time, any express or implied warranty of any kind, regarding any matter pertaining to this report, including without limitation the implied warranties of
merchantability, fitness for a particular purpose, and non-infringement. The recipients of this report should rely on their own investigations.
This report is intended for distribution to institutional investors. Recipients who are not institutional investors should seek advice of their independent financial advisor prior to taking any investment decision based on this report or for
any necessary explanation of its contents.
Most and it’s associates may have managed or co-managed public offering of securities, may have received compensation for investment banking or merchant banking or brokerage services, may have received any compensation for
products or services other than investment banking or merchant banking or brokerage services from the subject company in the past 12 months.
Most and it’s associates have not received any compensation or other benefits from the subject company or third party in connection with the research report.
Subject Company may have been a client of Most or its associates during twelve months preceding the date of distribution of the research report
MOSt and/or its affiliates and/or employees may have interests/positions, financial or otherwise of over 1 % at the end of the month immediately preceding the date of publication of the research in the securities mentioned in this
report. To enhance transparency, MOSt has incorporated a Disclosure of Interest Statement in this document. This should, however, not be treated as endorsement of the views expressed in the report.
Motilal Oswal Securities Limited is registered as a Research Analyst under SEBI (Research Analyst) Regulations, 2014. SEBI Reg. No. INH000000412
There are no material disciplinary action that been taken by any regulatory authority impacting equity research analysis activities
Analyst Certification
The views expressed in this research report accurately reflect the personal views of the analyst(s) about the subject securities or issues, and no part of the compensation of the research analyst(s) was, is, or will be directly or
indirectly related to the specific recommendations and views expressed by research analyst(s) in this report. The research analysts, strategists, or research associates principally responsible for preparation of MOSt research receive
compensation based upon various factors, including quality of research, investor client feedback, stock picking, competitive factors and firm revenues
Disclosure of Interest Statement
Analyst ownership of the stock
Served as an officer, director or employee
INDIABULLS HOUSING FINANCE
No
No
A graph of daily closing prices of securities is available at www.nseindia.com and http://economictimes.indiatimes.com/markets/stocks/stock-quotes
Regional Disclosures (outside India)
For U.S.
This report is not directed or intended for distribution to or use by any person or entity resident in a state, country or any jurisdiction, where such distribution, publication, availability or use would be contrary to law, regulation or which
would subject MOSt & its group companies to registration or licensing requirements within such jurisdictions.
Motilal Oswal Securities Limited (MOSL) is not a registered broker - dealer under the U.S. Securities Exchange Act of 1934, as amended (the"1934 act") and under applicable state laws in the United States. In addition MOSL is not a
registered investment adviser under the U.S. Investment Advisers Act of 1940, as amended (the "Advisers Act" and together with the 1934 Act, the "Acts), and under applicable state laws in the United States. Accordingly, in the
absence of specific exemption under the Acts, any brokerage and investment services provided by MOSL, including the products and services described herein are not available to or intended for U.S. persons.
This report is intended for distribution only to "Major Institutional Investors" as defined by Rule 15a-6(b)(4) of the Exchange Act and interpretations thereof by SEC (henceforth referred to as "major institutional investors"). This
document must not be acted on or relied on by persons who are not major institutional investors. Any investment or investment activity to which this document relates is only available to major institutional investors and will be
engaged in only with major institutional investors. In reliance on the exemption from registration provided by Rule 15a-6 of the U.S. Securities Exchange Act of 1934, as amended (the "Exchange Act") and interpretations thereof by
the U.S. Securities and Exchange Commission ("SEC") in order to conduct business with Institutional Investors based in the U.S., MOSL has entered into a chaperoning agreement with a U.S. registered broker-dealer, Motilal Oswal
Securities International Private Limited. ("MOSIPL"). Any business interaction pursuant to this report will have to be executed within the provisions of this chaperoning agreement.
The Research Analysts contributing to the report may not be registered /qualified as research analyst with FINRA. Such research analyst may not be associated persons of the U.S. registered broker-dealer, MOSIPL, and therefore,
may not be subject to NASD rule 2711 and NYSE Rule 472 restrictions on communication with a subject company, public appearances and trading securities held by a research analyst account.
This report is distributed in Hong Kong by Motilal Oswal capital Markets (Hong Kong) Private Limited, a licensed corporation (CE AYY-301) licensed and regulated by the Hong Kong Securities and Futures Commission (SFC)
pursuant to the Securities and Futures Ordinance (Chapter 571 of the Laws of Hong Kong) “SFO”. As per SEBI (Research Analyst Regulations) 2014 Motilal Oswal Securities (SEBI Reg No. INH000000412) has an agreement with
Motilal Oswal capital Markets (Hong Kong) Private Limited for distribution of research report in Kong Kong. This report is intended for distribution only to “Professional Investors” as defined in Part I of Schedule 1 to SFO. Any
investment or investment activity to which this document relates is only available to professional investor and will be engaged only with professional investors.”
Nothing here is an offer or solicitation of these securities, products and services in any jurisdiction where their offer or sale is not qualified or exempt from registration. The Indian Analyst(s) who compile this report is/are not located in
Hong Kong & are not conducting Research Analysis in Hong Kong.
Motilal Oswal Capital Markets Singapore Pte Limited is acting as an exempt financial advisor under section 23(1)(f) of the Financial Advisers Act(FAA) read with regulation 17(1)(d) of the Financial Advisors Regulations and is a
subsidiary of Motilal Oswal Securities Limited in India. This research is distributed in Singapore by Motilal Oswal Capital Markets Singapore Pte Limited and it is only directed in Singapore to accredited investors, as defined in the
Financial Advisers Regulations and the Securities and Futures Act (Chapter 289), as amended from time to time.
In respect of any matter arising from or in connection with the research you could contact the following representatives of Motilal Oswal Capital Markets Singapore Pte Limited:
Kadambari Balachandran
Email : kadambari.balachandran@motilaloswal.com
Contact : (+65) 68189233 / 65249115
Office Address : 21 (Suite 31),16 Collyer Quay,Singapore 04931
For Hong Kong:
For Singapore
20 January 2016
Motilal Oswal Tower, Level 9, Sayani Road, Prabhadevi, Mumbai 400 025
Phone: +91 22 3982 5500 E-mail: reports@motilaloswal.com
Motilal Oswal Securities Ltd
10