Container Corporation
BSE SENSEX
24,492
Bloomberg
Equity Shares (m)
M.Cap.(INR b)/(USD b)
52-Week Range (INR)
1, 6, 12 Rel. Per (%)
Avg Val, (INR m)
Free float (%)
S&P CNX
7,438
CCRI IN
195.0
235.6 / 3.5
1,944/1,125
-2/-15/2
402
38.2
27 January 2016
Q3FY16 Results Update | Sector: Logistics
CMP: INR1,209
TP: INR1,605 (+33%)
Buy
Financials & Valuation (INR b)
Y/E Mar
2015 2016E 2017E
Net Sales
61.5
57.5
62.9
EBITDA
14.0
11.9
14.4
PAT
10.5
8.7
10.6
EPS (INR)
54.1
44.8
54.2
Gr. (%)
11.7 -17.1
20.8
BV/Sh (INR)
385.5 416.8 454.6
RoE (%)
14.7
11.2
12.4
RoCE (%)
18.2
14.8
16.3
P/E (x)
22.4
27.0
22.3
P/BV (x)
3.1
2.9
2.7
Estimate change
TP change
Rating change
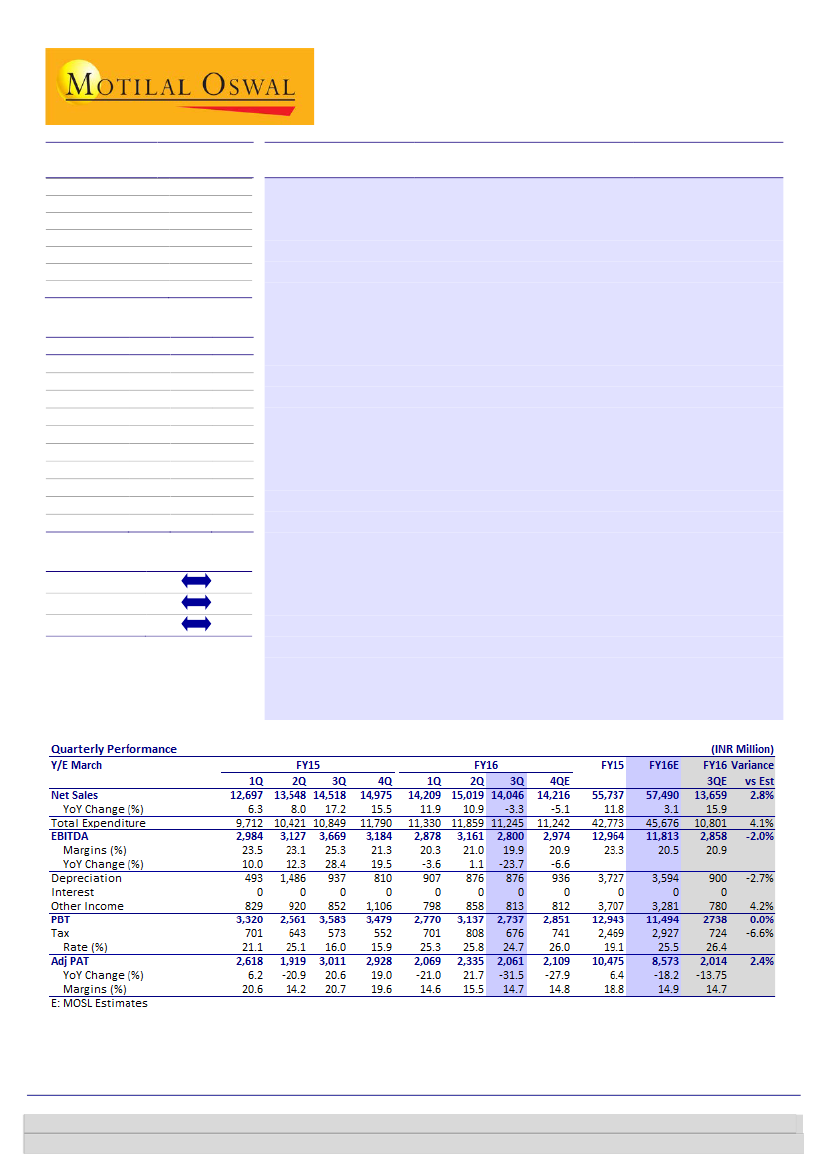
EBITDA and PAT in line; domestic business up QoQ; EXIM disappoints
Container Corporation (CCRI IN) reported in-line EBITDA at INR2.8b (est. of
INR2.9b; -24% YoY, -11% QoQ). Revenue was also largely in line at INR14.0b
(est. of INR13.7b; -3% YoY, -6% QoQ).
Adjusted PAT was in line at INR2.1b (est. of INR2.0b; -32% YoY, -11% QoQ). Tax
rate was 24.7% (est. of 26.4%) while other income was higher-than-estimate at
INR813m (est. of INR780m; -5% YoY, -5% QoQ).
Employee expenses increased 7% QoQ to INR396m.
Overall volumes stood at 0.71m teu (-9% YoY and -6% QoQ), led by EXIM at
0.6m teu (-10% YoY, -8% QoQ) and domestic at 0.11m teu (-4% YoY, +6% QoQ).
The domestic increase was primarily due to startup of Pantnagar operations.
Realization (in INR/teu) in EXIM stood at 18,897 (+6% YoY, -1% QoQ) and
domestic at 24,515 (+7% YoY, -4% QoQ). YoY increase in realization was led by
higher haulage rates.
EBIT (in INR/teu) in EXIM stood at 3,498 (-20% YoY, -4% QoQ) and domestic at
481 (-60% YoY, -2% QoQ).
Valuation and view
While DFC (Dedicated Freight Corridor) completion (expected in 2018/2019)
will be a significant efficiency driver for CCRI, its investments in long gestation
MMLP’s will impact near-term ratios.
We cut our FY17 earnings by 3% on the back of lower volume growth
assumption of ~7% in EXIM and domestic in FY17.
We value CCRI on DFC-based valuation (WACC: 12.6%, TGR: 5%) to arrive at a
fair value of INR1,605/sh (v/s INR1,636/sh earlier). The stock trades at a rich
valuation of 22.3x FY17E EPS of INR54.2, with continued near-term volume
growth concerns. Maintain
Buy.
Harshad Borawake
(HarshadBorawake@MotilalOswal.com); +91 22 3982 5432
Rajat Agarwal
(Rajat.Agarwal@MotilalOswal.com); +91 22 3982 5558
Investors are advised to refer through important disclosures made at the last page of the Research Report.
Motilal Oswal research is available on www.motilaloswal.com/Institutional-Equities, Bloomberg, Thomson Reuters, Factset and S&P Capital.
 Motilal Oswal Financial Services
Container Corporation
Exhibit 1: Container Corp – 3QFY16 Financial Summary (INRm)
Net Sales
Terminal & Service Charges
Employee Expenses
Other Expenses
EBITDA
EBITDA margin (%)
Depreciation
EBIT
Interest
Other Income
PBT
Total Tax
Tax rate (%)
PAT
EPS (INR)
1QFY15
12,697
7,430
323
1,960
2,984
24%
493
2,491
0
829
3,320
701
21%
2,618
13.4
2QFY15
13,548
9,288
474
659
3,127
23%
1,486
1,641
0
920
2,561
643
25%
1,919
9.8
3QFY15
14,518
9,758
410
682
3,669
25%
937
2,731
0
852
3,583
573
16%
3,011
15.4
4QFY15
14,975
8,934
373
2,482
3,184
21%
810
2,374
0
1,106
3,480
552
16%
2,927
15.0
1QFY16
14,209
8,963
373
1,994
2,878
20%
907
1,971
0
798
2,770
701
25%
2,069
10.6
2QFY16
15,019
9,456
369
2,034
3,161
21%
876
2,285
0
858
3,143
808
26%
2,329
11.9
3QFY16
14,046
8,848
396
2,001
2,800
20%
876
1,924
0
813
2,737
676
25%
2,061
10.6
YoY (%)
-3.3%
-9.3%
-3.2%
193.4%
-23.7%
QoQ (%)
-6.5%
-6.4%
7.4%
-1.6%
-11.4%
-6.5%
-29.5%
na
-4.6%
-23.6%
18.0%
-31.5%
-31.5%
0.0%
-15.8%
na
-5.2%
-12.9%
-16.4%
-11.5%
-11.5%
Source: MOSL, Company
Exhibit 2: Container Corp – 3QFY16 Segmental Revenue and Profitability
1QFY15
Revenue (INRm)
EXIM
Domestic
Total Segment Revenue
Segmental EBIT (INRm)
EXIM
Domestic
Total
EBIT Margin (%)
EXIM
Domestic
Total
9,788
2,909
12,697
2,319
312
2,630
23.7%
10.7%
20.7%
2QFY15
10,885
2,663
13,548
1,791
103
1,894
16.5%
3.9%
14.0%
3QFY15
11,886
2,632
14,518
2,924
139
3,064
24.6%
5.3%
21.1%
4QFY15
11,853
3,121
14,973
2,387
232
2,619
20.1%
7.4%
17.5%
1QFY16
11,570
2,639
14,209
2,139
42
2,181
18.5%
1.6%
15.3%
2QFY16
12,366
2,653
15,019
2,374
51
2,425
19.2%
1.9%
16.1%
3QFY16
11,329
2,717
14,046
2,097
53
2,151
18.5%
2.0%
15.3%
Source: MOSL, Company
YoY (%)
-4.7%
3.2%
-3.3%
-28.3%
-61.7%
-29.8%
QoQ (%)
-8.4%
2.4%
-6.5%
-11.6%
4.5%
-11.3%
Exhibit 3: Container Corp – Realization Snapshot
1QFY15
Volumes (TEU)
EXIM
Domestic
Total
Realizations (INR / TEU)
EXIM
Domestic
Total
EBIT (INR/TEU)
EXIM
Domestic
Total
631,908
134,845
766,753
15,490
21,570
16,559
3,670
2,311
3,431
2QFY15
676,922
121,168
798,090
16,079
21,981
16,975
2,646
853
2,374
3QFY15
665,130
115,313
780,443
17,870
22,823
18,602
4,397
1,207
3,925
4QFY15
647,425
118,045
765,470
18,307
26,437
19,561
3,686
1,967
3,421
1QFY16
614,353
107,742
722,095
18,833
24,490
19,677
3,481
392
3,020
2QFY16
648,466
104,278
752,744
19,070
25,445
19,953
3,660
489
3,221
3QFY16
599,506
110,816
710,322
18,897
24,515
19,774
3,498
481
3,028
YoY (%)
-9.9%
-3.9%
-9.0%
5.7%
7.4%
6.3%
-20.4%
-60.2%
-22.9%
QoQ (%)
-7.6%
6.3%
-5.6%
-0.9%
-3.7%
-0.9%
-4.4%
-1.7%
-6.0%
Source: MOSL, Company
27 January 2016
2
 Motilal Oswal Financial Services
Container Corporation
Exhibit 4: Container Corp – Quarterly domestic and EXIM volume trend (‘000 TEU)
Volumes ('000 TEU)
660
125
536
629
96
533
634
106
528
637
114
523
686
117
662
114
548
EXIM
723
120
Domestic
722
127
Total
762
146
767
135
798
121
780
115
765
118
722
108
753
104
710
111
568
603
595
616
632
677
665
647
614
648
600
4Q
1Q
2Q
FY13
3Q
4Q
1Q
2Q
FY14
3Q
4Q
1Q
2Q
FY15
3Q
4Q
1Q
2Q
FY16
3Q
Source: MOSL, Company
Exhibit 5: Container Corp – Quarterly domestic and EXIM volume YoY growth (‘000 TEU)
Volume growth (YoY %)
30
20
10
-
(10)
(20)
(30)
4Q
1Q
2Q
FY13
3Q
4Q
1Q
2Q
FY14
3Q
4Q
1Q
2Q
FY15
3Q
4Q
1Q
2Q
FY16
Source: MOSL, Company
3Q
EXIM
Domestic
Total
Exhibit 6: Container Corp – Quarterly domestic and EXIM per TEU realization trend (INR/TEU)
Realization (INR/TEU)
28,000
24,000
20,000
16,000
12,000
4Q
1Q
2Q
FY13
3Q
4Q
1Q
2Q
FY14
3Q
4Q
1Q
2Q
FY15
3Q
4Q
1Q
2Q
FY16
Source: MOSL, Company
3Q
EXIM
Domestic
Total
27 January 2016
3
 Motilal Oswal Financial Services
Container Corporation
Exhibit 7: Container Corp – Quarterly domestic and EXIM EBIT trend (INR m)
EBIT (INR m)
3,600
2,400
1,200
-
4Q
1Q
2Q
3Q
FY13
4Q
1Q
2Q
3Q
FY14
4Q
1Q
2Q
3Q
FY15
4Q
1Q
2Q
FY16
Source: MOSL, Company
3Q
EXIM
Total
Domestic - RHS
450
300
150
-
Key takeaways from concall
Total empty haulage expenses for 3QFY16 amounted to ~INR715m.
The management has guided that while 4QFY16 volumes would be marginally
higher than the 3QFY16 volumes, they are expected to be lower than 4QFY15
volumes. Near term operating environment for the company continues to look
weak.
Operations at Pantnagar have started, and it was one of the reasons of a QoQ
jump in domestic volumes.
Khatuwas terminal will become operational shortly. The transit operations have
already been started partly. Of the total budgeted capex of ~INR4.8b, upto
INR1.5b have already been invested.
Apart from the 15 projects to be commissioned by FY17, the management has
identified another 10 projects. Land acquisition for these projects has already
started. The total planned capacity will increase to 7-7.5mTEUs.
Of the INR60b capex guidance for FY16, ~INR54b capex investments have
already been made. While the management guided that they do not consider
taking debt on CONCOR’s balance sheet as prudent, they are open to taking
debt on projects being carried out under JVs.
During the quarter, the company had increased its authorized capital. The
management highlighted that this doesn’t mean that they will raise cash in the
near term necessarily; the authorized limit was raised to give some headroom
for capital raising should any investment opportunities arise.
Market share decline:
CONCOR’s market share declined in EXIM volumes a little
bit. The management attributed the decline to competition from private players,
particularly integrated operators like APL and Hind Terminals which were able to
cross-subsidize haulage charges. Also, the market share of containers
transported through roads ate into the overall market share of containers
through railways.
Succession:
The board has already appointed the new Managing Director of the
company (name not announced).
27 January 2016
4
 Motilal Oswal Financial Services
Container Corporation
Valuation and view
CCRI is a direct play on the upcoming large rail infrastructure (DFCs), revival in
economic growth and higher containerization. Key factors to watch out are (a)
EXIM growth trend, (b) expansion of port capacities (JNPT in the near term) and
(b) completion of DFCs.
Key risks include (a) lower-than-expected GDP growth, (b) sharp increase in
haulage rates, (c) delay in DFCs completion and (d) any increase in export-
import imbalance.
Given the debt free balance sheet, we expect the dividend payout (currently at
25%) to increase in the next few years as it nears the end of its ongoing large
capex cycle, which is funded fully through equity.
We cut our FY17 earnings by 3% led by lower volume growth assumption of ~7%
in EXIM and domestic in FY17.
We value CCRI on DFC-based (WACC 12.6%, TGR 5%) to arrive at a fair value of
INR1,605/sh (v/s INE1,636/sh earlier). The stock trades at rich valuation of 22.3x
FY17E EPS of INR54.2. With continued near term volume growth concerns,
maintain
Buy.
Exhibit 8: Concor – Key Assumptions
Y/E March
Volumes - TEU
EXIM
Domestic
Total
Revenue (INRm)
EXIM
Domestic
Un-allocable
Total
Realization (INR/TEU)
EXIM
Domestic
Total
FY12
2,136
468
2,604
32,666
7,954
389
41,009
15,293
16,983
15,746
FY13
2,152
434
2,586
35,398
8,662
390
44,450
16,449
19,975
17,191
FY14
2,361
507
2,869
38,900
11,332
853
51,085
16,473
22,344
17,808
FY15
2,621
489
3,111
44,412
11,325
55,737
16,942
23,141
17,917
FY16E
2,463
433
2,896
46,674
10,816
57,490
18,952
24,983
19,853
FY17E
2,640
464
3,104
51,035
11,826
62,862
19,331
25,483
20,250
FY18E
2,957
520
3,477
57,160
13,245
70,405
19,331
25,483
20,250
Source: Company, MOSL
27 January 2016
5
 Motilal Oswal Financial Services
Container Corporation
Story in charts
Exhibit 9: Model 4% volume CAGR over FY15-18E
Volumes
(million TEUs)
2.6
2.6
0.5
0.4
EXIM
2.9
0.5
Domestic
3.1
2.9
0.5
0.4
Total
3.1
0.5
3.5
0.5
Exhibit 10: Expect EBITDA to post 9% CAGR through FY18 led
by volume growth and improvement in profitability
EBITDA
(INR b)
11
1
11
1
10
EXIM
12
1
10
12
Domestic
14
2
Total EBITDA
15
12
1
1
18
2
2.1
2.2
2.4
2.6
2.5
2.6
3.0
10
11
14
16
FY12
FY13
FY14
FY15
FY16E
FY17E
FY18E
FY12
FY13
FY14
FY15
FY16E
FY17E
FY18E
Source: Company, MOSL
Exhibit 11: Capex intensity to remain high…
Capex (INRb)
9.4
5.9
3.1 3.1
2.3
10.3 10.1 10.0
Exhibit 12: ...resulting in lower FCF versus historical trend
FCF (INRb)
4.8
4.3
3.3 3.2
5.5
3.9
4.3
3.2
1.6
2.3
2.2
4.6
3.2
2.2
5.1
FY07 FY08 FY09 FY10 FY11 FY12 FY13 FY14 FY15 FY16 FY17 FY18
Source: Company, MOSL
-0.8
FY07 FY08 FY09 FY10 FY11 FY12 FY13 FY14 FY15 FY16 FY17 FY18
Source: Company, MOSL
Exhibit 13: Also, return ratios to remain under pressure led
by capex towards long gestation MMLPs
55.0
46.0
42.2 42.4
RoE (%)
39.1
RoCE (%)
Exhibit 14: CCRI – 1 Yr forward P/E chart
33.8
29.9
22.6
19.4 19.0
16.5 15.8 14.4 14.7
27.3
23.5 25.2
11.2 12.4 13.4
FY09 FY10 FY11 FY12 FY13 FY14 FY15 FY16E FY17E FY18E
Source: Company, MOSL
27 January 2016
6
 Motilal Oswal Financial Services
Container Corporation
Financials and Valuations
Income Statement
Y/E Mar
Net Sales
Change (%)
EBITDA
EBITDA Margin (%)
Depreciation
EBIT
Interest
Other Income
Extraordinary items
PBT
Tax
Tax Rate (%)
Min. Int. & Assoc. Share
Reported PAT
Adjusted PAT
Change (%)
2011
38,992
4.5
10,156
26.0
1,489
8,667
49
1,971
0
10,589
1,825
17.2
0
8,764
8,764
12.7
2011
1,300
48,088
49,388
471
2,288
52,146
33,683
9,722
23,961
1,069
1,956
30,705
125
296
22,961
7,323
5,545
4,001
1,544
25,161
52,146
2012
41,009
5.2
10,232
25.0
1,621
8,611
54
3,135
0
11,692
3,036
26.0
0
8,657
8,657
-1.2
2012
1,300
54,252
55,552
581
2,438
58,571
35,856
11,268
24,588
1,041
2,447
37,009
367
303
27,576
8,764
6,515
4,735
1,780
30,494
58,571
2013
44,450
8.4
10,497
23.6
1,763
8,734
32
3,326
0
12,027
2,721
22.6
0
9,306
9,306
7.5
2013
1,300
60,905
62,205
385
2,743
65,332
40,780
12,946
27,834
1,884
3,690
38,930
554
285
29,460
8,632
7,006
5,008
1,997
31,925
65,332
2014
53,167
19.6
11,523
21.7
2,357
9,167
220
3,583
0
12,529
3,072
24.5
15
9,443
9,443
1.5
2014
1,950
66,628
68,578
1,480
3,066
73,399
51,254
17,560
33,694
2,402
4,836
41,751
182
621
27,742
13,206
9,284
7,551
1,733
32,467
73,399
2015
61,493
15.7
14,019
22.8
4,108
9,911
183
3,470
0
13,198
2,638
20.0
14
10,546
10,546
11.7
2015
1,950
73,220
75,169
1,650
2,075
79,805
59,595
22,835
36,760
3,946
4,882
44,363
503
647
29,492
13,722
10,147
8,286
1,861
34,217
79,805
2016E
57,490
-6.5
11,861
20.6
3,594
8,268
183
3,571
0
11,655
2,900
24.9
14
8,741
8,741
-17.1
2016E
1,950
79,320
81,270
1,650
2,075
85,906
65,406
26,429
38,977
8,385
4,882
44,348
483
605
29,401
13,859
10,687
7,803
2,884
33,661
85,906
2017E
62,862
9.3
14,423
22.9
4,039
10,385
183
3,710
0
13,912
3,339
24.0
14
10,559
10,559
20.8
2017E
1,950
86,690
88,640
1,650
2,075
93,275
71,505
30,467
41,038
12,336
4,882
46,968
513
662
31,795
13,997
11,948
8,466
3,482
35,020
93,275
(INR Million)
2018E
70,405
12.0
16,840
23.9
4,410
12,431
183
4,123
0
16,371
3,929
24.0
14
12,428
12,428
17.7
Balance Sheet
Y/E Mar
Share Capital
Reserves
Net Worth
Debt
Deferred Tax
Total Capital Employed
Gross Fixed Assets
Less: Acc Depreciation
Net Fixed Assets
Capital WIP
Investments
Current Assets
Inventory
Debtors
Cash & Bank
Loans & Adv, Others
Curr Liabs & Provns
Curr. Liabilities
Provisions
Net Current Assets
Total Assets
(INR Million)
2018E
1,950
95,364
97,314
1,650
2,075
101,950
77,974
34,877
43,097
15,867
4,882
51,659
567
741
36,213
14,137
13,555
9,451
4,105
38,104
101,950
27 January 2016
7
 Motilal Oswal Financial Services
Container Corporation
Financials and valuations
Ratios
Y/E Mar
Basic (INR)
EPS
Cash EPS
Book Value
DPS
Payout (incl. Div. Tax.)
Valuation(x)
P/E
Cash P/E
Price / Book Value
EV/Sales
EV/EBITDA
Dividend Yield (%)
Profitability Ratios (%)
RoE
RoCE
Turnover Ratios (%)
Asset Turnover (x)
Debtors (No. of Days)
Inventory (No. of Days)
Creditors (No. of Days)
Net Debt/Equity (x)
2011
67.4
78.9
380.0
15.5
26.8
2012
66.6
79.1
427.4
16.5
28.8
2013
71.6
85.2
478.6
17.5
28.5
2014
48.4
60.5
351.7
12.5
30.3
25.0
20.0
3.4
3.9
18.2
1.0
19.0
22.8
0.7
1
3
16
-0.5
2011
10,156
445
-1,460
-2,225
17
6,933
-3,081
3,851
-34
1,565
-1,550
0
49
-46
-2,349
-2,346
3,036
19,925
22,961
16.5
22.2
0.7
3
3
16
-0.5
2012
10,232
542
-1,066
-2,000
14
7,722
-2,267
5,455
-500
1,939
-828
0
110
-48
-2,342
-2,279
4,615
22,961
27,576
15.8
20.3
0.7
5
2
20
-0.5
2013
10,497
316
425
-2,142
8
9,104
-5,858
3,246
-1,245
2,681
-4,422
0
-196
-33
-2,568
-2,798
1,884
27,576
29,460
14.4
19.2
0.7
1
4
19
-0.5
2014
11,523
3,582
-2,645
-2,597
-3,137
6,727
-5,145
1,582
-3,080
3,616
-4,609
0
-584
-238
-3,013
-3,835
-1,717
29,460
27,742
2015
54.1
75.2
385.5
13.6
30.2
22.4
16.1
3.1
3.4
14.8
1.1
14.7
18.2
0.8
3
4
19
-0.4
2015
14,019
3,471
1,058
-3,653
-3,232
11,664
-9,376
2,288
-44
2,996
-6,424
0
167
-189
-3,469
-3,490
1,749
27,742
29,492
2016E
44.8
63.3
416.8
11.3
30.2
27.0
19.1
2.9
3.6
17.5
0.9
11.2
14.8
0.7
3
4
19
-0.4
2016E
11,861
0
465
-2,900
0
9,426
-10,250
-824
0
3,571
-6,679
0
0
-183
-2,654
-2,837
-90
29,492
29,401
2017E
54.2
74.9
454.6
13.6
30.2
22.3
16.1
2.7
3.3
14.3
1.1
12.4
16.3
0.7
3
4
18
-0.4
2017E
14,423
0
1,036
-3,339
0
12,120
-10,050
2,070
0
3,710
-6,340
0
0
-183
-3,203
-3,386
2,394
29,401
31,795
2018E
63.7
86.4
499.1
16.0
30.2
19.0
14.0
2.4
2.9
11.9
1.3
13.4
17.5
0.7
3
4
18
-0.4
Cash Flow Statement
Y/E Mar
Adjusted EBITDA
Non cash opr. exp (inc)
(Inc)/Dec in Wkg. Cap.
Tax Paid
Other operating activities
CF from Op. Activity
(Inc)/Dec in FA & CWIP
Free cash flows
(Pur)/Sale of Invt
Others
CF from Inv. Activity
Inc/(Dec) in Net Worth
Inc / (Dec) in Debt
Interest Paid
Divd Paid (incl Tax) & Others
CF from Fin. Activity
Inc/(Dec) in Cash
Add: Opening Balance
Closing Balance
(INR Million)
2018E
16,840
0
1,334
-3,929
0
14,245
-10,000
4,245
0
4,123
-5,877
0
0
-183
-3,768
-3,951
4,418
31,795
36,213
27 January 2016
8
 Motilal Oswal Financial Services
Container Corporation
Corporate profile
Company description
Container Corp of India Ltd (CCRI) is a leading rail
freight transporter that is graduating to be a
multimodal logistic player. It is set to benefit from
GDP/EXIM revival and DFCs completion that will
accelerate containerization. Despite private players
entry in 2006, it has a leading market share (76%)
that can be attributed to its scale and vantage
locations. Long term growth acceleration could come
from its pre-emptive capex on multimodal parks.
Source: MOSL/Bloomberg
Exhibit 1: Sensex rebased
Exhibit 2: Shareholding pattern (%)
Promoter
DII
FII
Others
Sep-15
61.8
6.2
28.3
3.7
Jun-15
61.8
5.0
29.8
3.4
Sep-14
61.8
6.7
25.9
5.6
Exhibit 3: Top holders
Holder Name
Aberdeen Global Indian Equity Mauritius Ltd
Matthews Pacific Tiger Fund
Government of Singapore Investment -
Corporation A/c Government of Singapore-E
(2)
LIC of India Profit Plus Growth Fund
T Rowe Price Emerging Markets Stock Fund
% Holding
3.5
2.8
2.0
1.4
1.1
Source: Capitaline
Note: FII Includes depository receipts
Source: Capitaline
Exhibit 4: Top management
Name
Anil Kumar Gupta
P Alli Rani
Harish Chandra
Designation
Chairman & Managing Director
Director (Finance)
Company Secretary
Exhibit 5: Directors
Name
Arvind Bhatnagar
Manoj K Akhouri
Pradeep Bhatnagar
V Kalyana Rama
Name
M P Shorawala
N Madhusudana Rao
Sudhir Mathur
Yash Vardhan
Source: Capitaline
*Independent
Exhibit 6: Auditors
Name
A V Devan & Co
Arun Singh & Co
Chandak Khanzode & Shenwai
Jain Seth & Co
K L Banerjee & Co
Type
Branch
Branch
Branch
Branch
Branch
Source: Capitaline
Exhibit 7: MOSL forecast v/s consensus
EPS
(INR)
FY16
FY17
FY18
MOSL
forecast
44.8
54.2
63.7
Consensus
forecast
50.6
59.9
67.2
Variation
(%)
-11.4
-9.5
-5.2
Source: Bloomberg
27 January 2016
9
 Motilal Oswal Financial Services
Disclosures
This document has been prepared by Motilal Oswal Securities Limited (hereinafter referred to as Most) to provide information about the company(ies) and/sector(s), if any, covered in the report and may be distributed by it and/or its
Container Corporation
affiliated company(ies). This report is for personal information of the selected recipient/s and does not construe to be any investment, legal or taxation advice to you. This research report does not constitute an offer, invitation or
inducement to invest in securities or other investments and Motilal Oswal Securities Limited (hereinafter referred as MOSt) is not soliciting any action based upon it. This report is not for public distribution and has been furnished to
you solely for your general information and should not be reproduced or redistributed to any other person in any form. This report does not constitute a personal recommendation or take into account the particular investment
objectives, financial situations, or needs of individual clients. Before acting on any advice or recommendation in this material, investors should consider whether it is suitable for their particular circumstances and, if necessary, seek
professional advice. The price and value of the investments referred to in this material and the income from them may go down as well as up, and investors may realize losses on any investments. Past performance is not a guide for
future performance, future returns are not guaranteed and a loss of original capital may occur.
MOSt and its affiliates are a full-service, integrated investment banking, investment management, brokerage and financing group. We and our affiliates have investment banking and other business relationships with a some
companies covered by our Research Department. Our research professionals may provide input into our investment banking and other business selection processes. Investors should assume that MOSt and/or its affiliates are
seeking or will seek investment banking or other business from the company or companies that are the subject of this material and that the research professionals who were involved in preparing this material may educate investors
on investments in such business. The research professionals responsible for the preparation of this document may interact with trading desk personnel, sales personnel and other parties for the purpose of gathering, applying and
interpreting information. Our research professionals are paid on the profitability of MOSt which may include earnings from investment banking and other business.
MOSt generally prohibits its analysts, persons reporting to analysts, and members of their households from maintaining a financial interest in the securities or derivatives of any companies that the analysts cover. Additionally, MOSt
generally prohibits its analysts and persons reporting to analysts from serving as an officer, director, or advisory board member of any companies that the analysts cover. Our salespeople, traders, and other professionals or affiliates
may provide oral or written market commentary or trading strategies to our clients that reflect opinions that are contrary to the opinions expressed herein, and our proprietary trading and investing businesses may make investment
decisions that are inconsistent with the recommendations expressed herein. In reviewing these materials, you should be aware that any or all of the foregoing among other things, may give rise to real or potential conflicts of interest.
MOSt and its affiliated company(ies), their directors and employees and their relatives may; (a) from time to time, have a long or short position in, act as principal in, and buy or sell the securities or derivatives thereof of companies
mentioned herein. (b) be engaged in any other transaction involving such securities and earn brokerage or other compensation or act as a market maker in the financial instruments of the company(ies) discussed herein or act as an
advisor or lender/borrower to such company(ies) or may have any other potential conflict of interests with respect to any recommendation and other related information and opinions.; however the same shall have no bearing
whatsoever on the specific recommendations made by the analyst(s), as the recommendations made by the analyst(s) are completely independent of the views of the affiliates of MOSt even though there might exist an inherent
conflict of interest in some of the stocks mentioned in the research report
Reports based on technical and derivative analysis center on studying charts company's price movement, outstanding positions and trading volume, as opposed to focusing on a company's fundamentals and, as such, may not match
with a report on a company's fundamental analysis. In addition MOST has different business segments / Divisions with independent research separated by Chinese walls catering to different set of customers having various
objectives, risk profiles, investment horizon, etc, and therefore may at times have different contrary views on stocks sectors and markets.
Unauthorized disclosure, use, dissemination or copying (either whole or partial) of this information, is prohibited. The person accessing this information specifically agrees to exempt MOSt or any of its affiliates or employees from, any
and all responsibility/liability arising from such misuse and agrees not to hold MOSt or any of its affiliates or employees responsible for any such misuse and further agrees to hold MOSt or any of its affiliates or employees free and
harmless from all losses, costs, damages, expenses that may be suffered by the person accessing this information due to any errors and delays. The information contained herein is based on publicly available data or other sources
believed to be reliable. Any statements contained in this report attributed to a third party represent MOSt’s interpretation of the data, information and/or opinions provided by that third party either publicly or through a subscription
service, and such use and interpretation have not been reviewed by the third party. This Report is not intended to be a complete statement or summary of the securities, markets or developments referred to in the document. While we
would endeavor to update the information herein on reasonable basis, MOSt and/or its affiliates are under no obligation to update the information. Also there may be regulatory, compliance, or other reasons that may prevent MOSt
and/or its affiliates from doing so. MOSt or any of its affiliates or employees shall not be in any way responsible and liable for any loss or damage that may arise to any person from any inadvertent error in the information contained in
this report. MOSt or any of its affiliates or employees do not provide, at any time, any express or implied warranty of any kind, regarding any matter pertaining to this report, including without limitation the implied warranties of
merchantability, fitness for a particular purpose, and non-infringement. The recipients of this report should rely on their own investigations.
This report is intended for distribution to institutional investors. Recipients who are not institutional investors should seek advice of their independent financial advisor prior to taking any investment decision based on this report or for
any necessary explanation of its contents.
Most and it’s associates may have managed or co-managed public offering of securities, may have received compensation for investment banking or merchant banking or brokerage services, may have received any compensation for
products or services other than investment banking or merchant banking or brokerage services from the subject company in the past 12 months.
Most and it’s associates have not received any compensation or other benefits from the subject company or third party in connection with the research report.
Subject Company may have been a client of Most or its associates during twelve months preceding the date of distribution of the research report
MOSt and/or its affiliates and/or employees may have interests/positions, financial or otherwise of over 1 % at the end of the month immediately preceding the date of publication of the research in the securities mentioned in this
report. To enhance transparency, MOSt has incorporated a Disclosure of Interest Statement in this document. This should, however, not be treated as endorsement of the views expressed in the report.
Motilal Oswal Securities Limited is registered as a Research Analyst under SEBI (Research Analyst) Regulations, 2014. SEBI Reg. No. INH000000412
There are no material disciplinary action that been taken by any regulatory authority impacting equity research analysis activities
Analyst Certification
The views expressed in this research report accurately reflect the personal views of the analyst(s) about the subject securities or issues, and no part of the compensation of the research analyst(s) was, is, or will be directly or
indirectly related to the specific recommendations and views expressed by research analyst(s) in this report. The research analysts, strategists, or research associates principally responsible for preparation of MOSt research receive
compensation based upon various factors, including quality of research, investor client feedback, stock picking, competitive factors and firm revenues
Disclosure of Interest Statement
Analyst ownership of the stock
Served as an officer, director or employee
CONTAINER CORP OF INDIA
No
No
A graph of daily closing prices of securities is available at www.nseindia.com and http://economictimes.indiatimes.com/markets/stocks/stock-quotes
Regional Disclosures (outside India)
For U.S.
This report is not directed or intended for distribution to or use by any person or entity resident in a state, country or any jurisdiction, where such distribution, publication, availability or use would be contrary to law, regulation or which
would subject MOSt & its group companies to registration or licensing requirements within such jurisdictions.
Motilal Oswal Securities Limited (MOSL) is not a registered broker - dealer under the U.S. Securities Exchange Act of 1934, as amended (the"1934 act") and under applicable state laws in the United States. In addition MOSL is not a
registered investment adviser under the U.S. Investment Advisers Act of 1940, as amended (the "Advisers Act" and together with the 1934 Act, the "Acts), and under applicable state laws in the United States. Accordingly, in the
absence of specific exemption under the Acts, any brokerage and investment services provided by MOSL, including the products and services described herein are not available to or intended for U.S. persons.
This report is intended for distribution only to "Major Institutional Investors" as defined by Rule 15a-6(b)(4) of the Exchange Act and interpretations thereof by SEC (henceforth referred to as "major institutional investors"). This
document must not be acted on or relied on by persons who are not major institutional investors. Any investment or investment activity to which this document relates is only available to major institutional investors and will be
engaged in only with major institutional investors. In reliance on the exemption from registration provided by Rule 15a-6 of the U.S. Securities Exchange Act of 1934, as amended (the "Exchange Act") and interpretations thereof by
the U.S. Securities and Exchange Commission ("SEC") in order to conduct business with Institutional Investors based in the U.S., MOSL has entered into a chaperoning agreement with a U.S. registered broker-dealer, Motilal Oswal
Securities International Private Limited. ("MOSIPL"). Any business interaction pursuant to this report will have to be executed within the provisions of this chaperoning agreement.
The Research Analysts contributing to the report may not be registered /qualified as research analyst with FINRA. Such research analyst may not be associated persons of the U.S. registered broker-dealer, MOSIPL, and therefore,
may not be subject to NASD rule 2711 and NYSE Rule 472 restrictions on communication with a subject company, public appearances and trading securities held by a research analyst account.
For Hong Kong:
This report is distributed in Hong Kong by Motilal Oswal capital Markets (Hong Kong) Private Limited, a licensed corporation (CE AYY-301) licensed and regulated by the Hong Kong Securities and Futures Commission (SFC)
pursuant to the Securities and Futures Ordinance (Chapter 571 of the Laws of Hong Kong) “SFO”. As per SEBI (Research Analyst Regulations) 2014 Motilal Oswal Securities (SEBI Reg No. INH000000412) has an agreement with
Motilal Oswal capital Markets (Hong Kong) Private Limited for distribution of research report in Kong Kong. This report is intended for distribution only to “Professional Investors” as defined in Part I of Schedule 1 to SFO. Any
investment or investment activity to which this document relates is only available to professional investor and will be engaged only with professional investors.”
Nothing here is an offer or solicitation of these securities, products and services in any jurisdiction where their offer or sale is not qualified or exempt from registration. The Indian Analyst(s) who compile this report is/are not located in
Hong Kong & are not conducting Research Analysis in Hong Kong.
For Singapore
Motilal Oswal Capital Markets Singapore Pte Limited is acting as an exempt financial advisor under section 23(1)(f) of the Financial Advisers Act(FAA) read with regulation 17(1)(d) of the Financial Advisors Regulations and is a
subsidiary of Motilal Oswal Securities Limited in India. This research is distributed in Singapore by Motilal Oswal Capital Markets Singapore Pte Limited and it is only directed in Singapore to accredited investors, as defined in the
Financial Advisers Regulations and the Securities and Futures Act (Chapter 289), as amended from time to time.
In respect of any matter arising from or in connection with the research you could contact the following representatives of Motilal Oswal Capital Markets Singapore Pte Limited:
Kadambari Balachandran
Email : kadambari.balachandran@motilaloswal.com
Contact : (+65) 68189233 / 65249115
Office Address : 21 (Suite 31),16 Collyer Quay,Singapore 04931
27 January 2016
Motilal Oswal Tower, Level 9, Sayani Road, Prabhadevi, Mumbai 400 025
Phone: +91 22 3982 5500 E-mail: reports@motilaloswal.com
Motilal Oswal Securities Ltd
10