Pidilite Industries
BSE SENSEX
24,871
Bloomberg
Equity Shares (m)
M.Cap.(INRb)/(USDb)
52-Week Range (INR)
1, 6, 12 Rel. Per (%)
Avg Val, INRm
Free float (%)
S&P CNX
7,564
PIDI IN
512.7
290.2 / 4.4
638/508
8/13/14
224
30.3
30 January 2016
3QFY16 Results Update | Sector: Consumer
CMP: INR566
TP: INR660 (+17%)
Buy
Financials & Valuations (INR b)
Y/E Mar
2015 2016E 2017E
Net Sales
48.8
52.5
61.1
EBITDA
8.0
11.9
13.4
PAT
5.1
7.6
8.4
EPS (INR)
10.0
14.9
16.4
Gr. (%)
13.2
48.5
10.2
BV/Sh (INR)
44.3
55.5
66.3
RoE (%)
24.3
29.8
26.9
RoCE (%)
30.9
39.4
36.7
P/E (x)
56.5
38.0
34.5
P/BV (x)
12.8
10.2
8.5
Estimate change
TP change
Rating change
Sharp beat on profits; Raise estimates; one of our preferred FMCG ideas
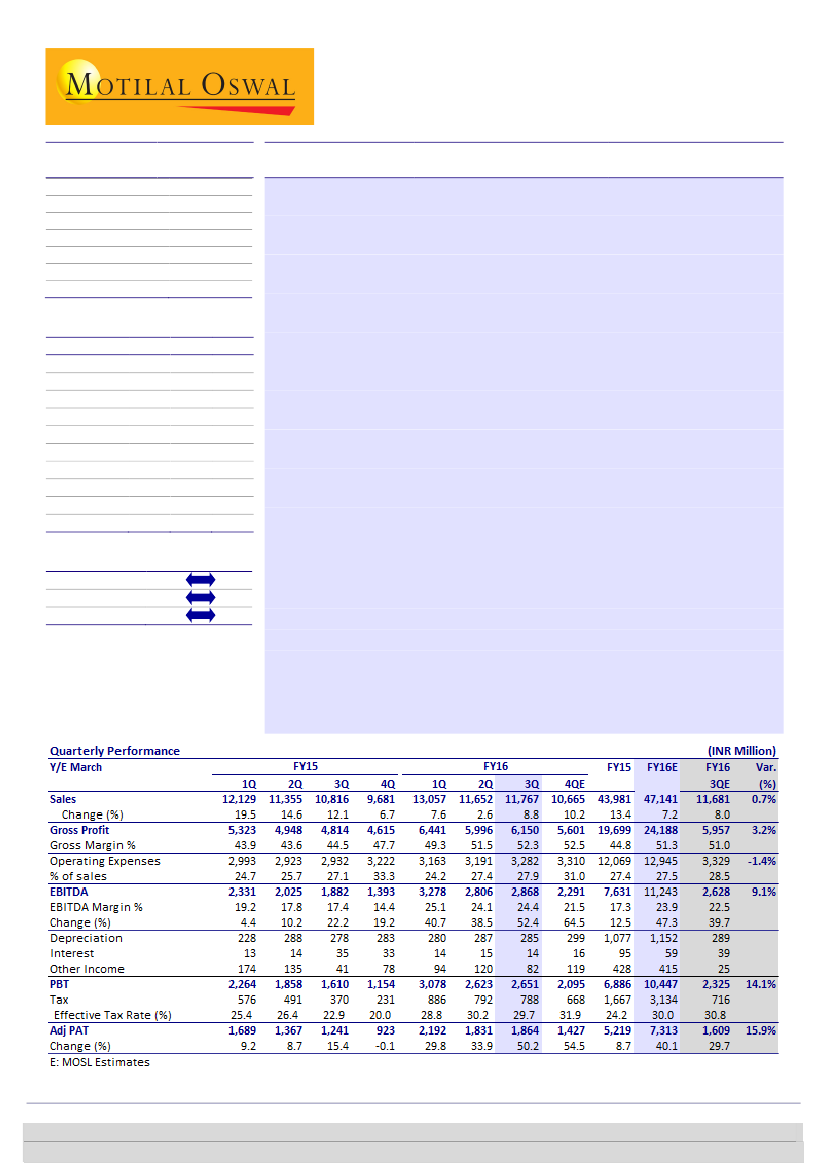
PIDI’s 3QFY16
revenues was in-line with expectation while PAT came in 16%
ahead of expectations. Standalone sales grew 8.8% YoY to INR11.8b (est.
INR11.7b), with 6-7% volume growth in the Consumer Bazaar segment, in our
view. EBITDA grew 52.4% to INR2.9b (est. INR2.6b) and adjusted PAT posted
50.2% growth to INR1.86b (est. INR1.61b, 16% above estimates).
Benign input costs drive sharp margin expansion:
PIDI’s gross margin
expanded 780bps YoY to 52.3% (est. 51%; highest in 31 quarters), led by benign
input costs (VAM prices down 16% YoY) and carryover of earlier price hikes.
However higher other expenses (up 70bps) and increased staff costs (up 10bps)
curtailed EBITDA margin expansion to 700bps YoY to 24.4% (est. 22.5%).
Segment performance:
Consumer Bazaar posted 10.8% revenue growth, with
underlying EBIT margin expansion of 750bps YoY to 29%. Industrial segment
revenues grew tepid 3.1% while EBIT margin expanded 600bps YoY to 17.5%.
Consolidated
Sales, EBITDA and Adj. PAT grew 11.4%, 53% and 49%
respectively. Gross margin and EBITDA margin expanded 750bps and 600bps
resp. Imputed subsidiary posted 35% revenue growth, with Adj. PAT of INR2m.
9MFY16
Sales, EBITDA and PAT grew 6.3%, 43.5% and 37% resp. Gross margin
and EBITDA margin expanded 750bps and 630bps resp.
Valuation and view:
We revise our estimates upwards by 3% to bake in
3QFY16 beat and benign input cost environment. Pidilite is one of the biggest
beneficiaries of correction in crude prices, in our view. Pidilite offers a high
quality play on urban consumption with strong competitive positioning (quasi
monopoly shares in mainstay Adhesives) and an impeccable track record of
generating long term shareholder value over multiple periods. We are also
enthused by Mr. Puri’s strategy of making Pidilite an innovative Indian MNC
and his agenda of expanding product portfolio. Maintain BUY, with an
unchanged target price of INR660. Spike in input costs is a key downside risk.
Investors are advised to refer through important disclosures made at the last page of the Research Report.
Motilal Oswal research is available on www.motilaloswal.com/Institutional-Equities, Bloomberg, Thomson Reuters, Factset and S&P Capital.
Gautam Duggad
(Gautam.Duggad@MotilalOswal.com); +91 22 3982 5404
Manish Poddar
(manish.poddar@motilaloswal.com); +91 22 3027 8029/
Vishal Punmiya
(Vishal.Punmiya@motilaloswal.com)

Pidilite Industries
Key quarterly charts
Exhibit 1: Segmental Performance (Standalone)
Segmental
Consumer and Bazaar
Sales (INRm)
Sales Growth (%)
EBIT (INRm)
% Contribution
EBIT Growth %
EBIT margin %
Industrial Products
Sales (INR m)
Sales Growth (%)
EBIT (INRm)
% Contribution
EBIT Growth %
EBIT margin %
1,657
15.0
183
10.5
13.8
11.0
1,872
13.6
232
14.8
18.8
12.4
1,863
0.8
192
7.3
-15.1
10.3
2,162
26.8
247
11.4
48.4
11.4
1,939
17.0
181
10.6
-1.2
9.3
2,193
17.2
184
13.3
-21.0
8.4
2,169
16.4
161
6.3
-16.0
7.4
2,327
7.7
267
11.9
8.2
11.5
2,039
5.2
251
11.8
38.8
12.3
2,157
-1.6
288
17.7
56.9
13.4
2,185
0.7
335
9.4
108.4
15.3
2,116
-9.1
370
14.6
38.6
17.5
2,102
3.1
367
11.5
46.5
17.5
6,794
23.9
1,588
90.9
25.2
23.4
5,867
17.6
1,363
86.9
41.2
23.2
8,417
13.2
2,415
92.6
20.8
28.7
7,883
18.6
1,931
88.9
29.2
24.5
7,822
15.1
1,559
91.6
-1.8
19.9
6,988
19.1
1,228
88.9
-10.0
17.6
10,169
20.8
2,413
95.0
-0.1
23.7
9,135
15.9
1,997
88.7
3.4
21.9
8,803
12.5
1,893
89.5
21.4
21.5
7,668
9.7
1,373
84.4
11.8
17.9
10,921
7.4
3,270
91.7
35.5
29.9
9,612
5.2
2,756
108.5
38.0
28.7
9,751
10.8
2,825
88.8
49.2
29.0
3QFY13 4QFY13 1QFY14 2QFY14 3QFY14 4QFY14 1QFY15 2QFY15 3QFY15 4QFY15 1QFY16 2QFY16 3QFY16
Source: Company, MOSL
Exhibit 2: Sales growth grew 8.8% YoY
Sales growth (%)
Exhibit 3: Gross margins at multi-year high
Gross Margins (%)
Source: Company, MOSL
Exhibit 4: Employee expenses up 10bps YoY..
Employees Cost (%)
Exhibit 5: ..while other expenses increased 70bps YoY
Other Expenditure (%)
Source: Company, MOSL
30 January 2016
2

Pidilite Industries
Exhibit 6: S/L EBITDA margins expanded sharp 700bps YoY
EBIDTA Margins (%)
Exhibit 7: S/L PAT grew 50.2% YoY, 16% ahead of estimates
PAT Growth (%)
Source: Company, MOSL
Valuation & view
We revise our estimates upwards by 3% to bake in 3QFY16 beat and benign
input cost environment. Pidilite is one of the biggest beneficiaries of correction
in crude prices, in our view.
Pidilite offers a high quality play on urban consumption with strong competitive
positioning and an impeccable track record of generating long term shareholder
value over multiple periods. Quasi monopoly shares in mainstay Adhesives,
strong balance sheet and consistent track record of brand creation provides
ample medium to long term earnings visibility and should sustain its premium
valuations, in our view. We model in 23.8% EBITDA CAGR and 23.5% PAT CAGR
over FY15-18E.
Mr. Puri’s strategy of making Pidilite an innovative Indian MNC and his agenda
of expanding product portfolio augurs well from long term growth viewpoint.
The trinity of raw material tailwind, pay commission driven urban consumption
uptick and potential GST benefits are near term catalysts.
Maintain BUY with an unchanged target price of INR 660. Prolonged slowdown
in consumption demand and any sharp input cost reversal which can’t be passed
on are key risks.
Exhibit 8: Revise estimates by 3% to factor in benign input costs
Net Sales
EBITDA
Adjusted PAT
FY16E
52,456
11,872
7,672
New
FY17E
61,125
13,373
8,452
FY18E
71,709
15,269
9,727
FY16E
52,456
11,262
7,233
Old
FY17E
61,125
12,988
8,238
FY18E
71,709
15,204
9,697
FY16E
0.0
5.4
6.1
% Change
FY17E
0.0
3.0
2.6
FY18E
0.0
0.4
0.3
Source: Company, MOSL
30 January 2016
3

Pidilite Industries
Exhibit 9: PIDI P/E (x): Sharp re-rating in last 12 months
53.0
41.0
29.0
17.0
5.0
7.8
24.3
PE (x)
Peak(x)
Avg(x)
43.1
35.6
Min(x)
150
100
50
0
-50
44.2
Exhibit 10: PIDI P/E premium vs. Sensex
Pidilite Inds. PE Relative to Sensex PE (%)
LPA (%)
123.9
Source: Company, MOSL
Exhibit 11: Valuation Matrix of coverage universe
Company
Consumer
Asian Paints
Britannia
Colgate
Dabur*
Emami*
Godrej Consumer
GSK Consumer
Hind. Unilever
ITC
Jyothy Labs
Marico*
Nestle
Page Industries
Pidilite Inds.
Radico Khaitan
United Spirits
Retail
Jubilant Foodworks
Shopper's Stop
Titan Company
Reco
Price
(INR)
P/E (x)
EV/EBITDA (x)
ROE (%) Div. (%)
Mkt Cap EPS Growth YoY (%)
(USD M) FY16E FY17E FY18E FY16E FY17E FY18E FY16E FY17E FY18E FY16E FY16E
27.0
51.1
7.1
15.0
15.1
24.5
19.4
5.0
2.7
26.4
17.6
-21.8
21.2
48.5
-3.6
LP
4.5
32.6
-7.2
15.1
18.9
14.3
16.2
22.6
20.0
15.5
10.9
10.4
-8.7
19.9
25.7
27.9
10.2
31.6
76.9
53.2
35.8
20.9
9.9
14.6
14.1
12.5
16.9
14.4
9.2
14.2
14.3
12.6
12.8
22.3
31.1
15.1
25.2
46.6
42.6
39.7
13.2
46.1
37.1
38.9
36.0
40.9
36.9
35.2
44.4
26.0
32.1
42.5
53.9
56.8
38.0
17.8
86.6
71.6
60.6
42.3
40.1
31.2
34.0
31.0
33.3
30.7
30.5
40.1
23.5
35.2
35.4
42.9
44.4
34.5
13.5
49.0
46.8
44.6
35.0
36.5
27.2
29.8
27.5
28.5
26.9
27.9
35.1
20.6
31.2
31.4
35.1
33.9
30.0
10.8
33.4
32.8
32.0
30.9
31.5
25.7
23.8
28.7
33.9
27.9
25.0
30.6
17.0
26.6
28.4
31.3
34.6
23.8
11.8
40.4
28.6
14.7
31.8
26.9
21.0
21.2
24.5
28.0
23.6
21.2
28.0
15.5
22.4
23.5
25.4
27.9
20.9
9.6
29.2
20.2
12.6
26.1
24.3
17.8
18.9
21.7
24.0
21.3
18.8
24.7
13.7
19.8
20.6
21.2
21.6
18.0
8.1
21.8
14.8
10.4
22.8
35.2
58.2
72.6
33.0
40.6
23.2
30.3
110.3
30.4
19.6
33.5
34.2
47.0
29.8
9.4
48.1
15.8
6.8
21.2
1.1
0.9
1.8
1.0
1.1
0.8
1.1
2.0
2.1
1.4
0.9
1.4
0.8
0.7
0.8
0.0
0.3
0.3
0.7
Neutral
Buy
Neutral
Neutral
Buy
Neutral
Buy
Neutral
Neutral
Buy
Neutral
Neutral
Buy
Buy
Buy
Buy
Buy
Neutral
Neutral
869
12,278
2,683 4,721
856
3,431
250
6,472
1,007 3,365
1,224 6,141
5,835 3,615
817
26,037
320
37,827
285
761
222
4,220
5,491 7,799
12,086 1,986
566
4,277
114
222
2,488 5,327
1,269
397
364
1,226
480
4,759
Note: For Nestle FY15 means CY14
Source: Company, MOSL
30 January 2016
4

Pidilite Industries
Story in charts
Exhibit 12: Revenues CAGR of 13.7% over FY15-18E
Revenues (INR mn)
20.2
16.0
10.4
18.3 17.9
Revenue growth (%)
16.5 17.3
13.0
7.5
Exhibit 13: Volume grew 7% in 3QFY16, in our view
14.3
Volume growth (%)
12.8
11.4
8.9
4.0
15.9
FY09 FY10 FY11 FY12 FY13 FY14 FY15 FY16E FY17E FY18E
Source: Company, MOSL
FY12
FY13
FY14
FY15
9MFY16
Source: Company, MOSL
Exhibit 14: Gross margins to expand by 480bp over FY15-
18E, led by benign input cost..
Gross Margin (%)
48.7
42.1
47.4
51.5 50.7
49.8
44.9 45.9 45.3 45.0
Exhibit 15: .. resulting in EBITDA margins expansion of
480bp
EBITDA Margin (%)
22.6
21.9 21.3
18.2 17.9
16.3
17.2
16.3 16.5
10.9
FY09 FY10 FY11 FY12 FY13 FY14 FY15 FY16E FY17E FY18E
Source: Company, MOSL
FY09 FY10 FY11 FY12 FY13 FY14 FY15 FY16E FY17E FY18E
Source: Company, MOSL
Exhibit 16: PAT to post 23.8% CAGR over FY15-FY18E
PAT (INR mn)
147.8
PAT growth (%)
Exhibit 17: Return Ratios (x)
35.1
31.5
28.3
25.2 24.3
RoE
29.8
26.9 26.0
30.2
12.3
-35.2
8.0
48.5
13.2
10.2 15.1
16.9
26.8
4.6
FY09 FY10 FY11 FY12 FY13 FY14 FY15 FY16E FY17E FY18E
Source: Company, MOSL
FY09 FY10 FY11 FY12 FY13 FY14 FY15 FY16E FY17E FY18E
Source: Company, MOSL
30 January 2016
5

Pidilite Industries
Financials and valuations
Income Statement
Y/E March
Net Sales
Change (%)
Raw Materials
Gross Profit
Margin (%)
Operating Expenses
EBITDA
Change (%)
Margin (%)
Depreciation
Int. and Fin. Charges
Other Income
Profit before Taxes
Change (%)
Margin (%)
Tax
Tax Rate (%)
Adj PAT
Change (%)
Margin (%)
Exceptional/Prior Period inc
Share of Profit in associate
Minority Int
Reported PAT
FY11
26,714
20.2
14047
12,666
47.4
7884
4,783
18.1
17.9
595
314
158
4,031
29.6
15.1
947
23.5
3,084
12.3
11.5
-10
17
0
3,110
FY12
31,590
18.3
17403
14,187
44.9
9026
5,161
7.9
16.3
637
307
110
4,327
7.3
13.7
1,100
25.4
3,226
4.6
10.2
0
20
-3
3,244
FY13
37,255
17.9
20152
17,103
45.9
10698
6,405
24.1
17.2
686
155
231
5,795
33.9
15.6
1,595
27.5
4,200
30.2
11.3
-18
24
-2
4,240
FY14
43,166
15.9
23613
19,553
45.3
12504
7,048
10.1
16.3
812
163
115
6,188
6.8
14.3
1,653
26.7
4,536
8.0
10.5
65
30
-3
4,498
FY15
48,783
13.0
26814
21,968
45.0
13919
8,049
14.2
16.5
1,178
156
113
6,828
10.3
14.0
1,694
24.8
5,134
13.2
10.5
49
50
-10
5,126
FY16E
52,456
7.5
25456
27,000
51.5
15128
11,872
47.5
22.6
1,318
68
107
10,593
55.1
20.2
2,966
28.0
7,627
48.5
14.5
0
55
-10
7,672
FY17E
61,125
16.5
30110
31,015
50.7
17642
13,373
12.6
21.9
1,451
61
141
12,002
13.3
19.6
3,601
30.0
8,401
10.2
13.7
0
61
-10
8,452
(INR Million)
FY18E
71,709
17.3
35973
35,736
49.8
20468
15,269
14.2
21.3
1,581
61
187
13,814
15.1
19.3
4,144
30.0
9,670
15.1
13.5
0
67
-10
9,727
Balance Sheet
Y/E March
Share Capital
Reserves
Net Worth
Loans
Deferred Liability
Minority Interest
Capital Employed
Gross Block
Less: Accum. Depn.
Net Fixed Assets
Capital WIP
Goodwill
Others
Investments
Curr. Assets, L&A
Inventory
Account Receivables
Cash and Bank Balance
Others
Curr. Liab. and Prov.
Account Payables
Provisions
Net Current Assets
Application of Funds
E: MOSL Estimates
FY11
506
10,341
10,847
3,356
420
2
14,625
10,599
4,960
5,639
3,500
0
0
2,363
8,897
4,092
3,460
380
966
5,774
4,590
1,184
3,123
14,625
FY12
508
12,698
13,206
3,213
468
5
16,892
11,792
5,616
6,177
3,938
0
10
983
12,536
4,541
3,952
2,732
1,311
6,751
5,463
1,288
5,784
16,892
FY13
513
16,003
16,515
1,112
499
10
18,136
12,623
6,370
6,253
4,280
205
48
2,941
12,434
5,236
4,305
1,506
1,387
8,024
5,785
2,239
4,410
18,136
FY14
513
19,014
19,526
459
537
42
20,565
14,212
7,150
7,062
4,580
230
59
2,603
14,750
5,997
5,244
1,772
1,737
8,719
6,510
2,209
6,031
20,565
FY15
513
22,193
22,706
584
566
51
23,907
17,867
8,298
9,570
4,618
215
68
3,599
15,077
6,410
5,861
860
1,946
9,240
6,933
2,308
5,837
23,907
FY16E
513
27,952
28,464
760
449
61
29,734
20,367
9,616
10,751
4,618
215
68
7,099
17,657
6,991
6,705
1,504
2,457
10,676
7,851
2,824
6,981
29,733
FY17E
513
33,495
34,008
760
308
71
35,146
22,867
11,067
11,800
4,618
215
68
8,599
22,140
8,313
7,980
3,026
2,821
12,295
9,040
3,255
9,845
35,146
(INR Million)
FY18E
513
39,803
40,316
760
138
80
41,295
25,367
12,648
12,720
4,618
215
68
10,099
28,083
9,754
9,364
5,770
3,195
14,508
10,689
3,819
13,574
41,295
30 January 2016
6

Pidilite Industries
Financials and valuations
Ratios
Y/E March
Basic (INR)
EPS
Cash EPS
BV/Share
DPS
Payout %
Valuation (x)
P/E
Cash P/E
EV/Sales
EV/EBITDA
P/BV
Dividend Yield (%)
Return Ratios (%)
RoE
RoCE
Working Capital Ratios
Debtor (Days)
Creditor (Days)
Asset Turnover (x)
Leverage Ratio
Debt/Equity (x)
FY11
6.1
10.6
21.4
1.8
28.6
FY12
6.4
11.4
26.0
1.9
29.8
FY13
8.2
13.8
32.2
2.6
31.6
FY14
8.8
15.3
38.1
2.7
30.3
FY15
10.0
18.0
44.3
2.9
28.7
FY16E
14.9
25.7
55.5
4.2
28.1
FY17E
16.4
28.9
66.3
4.9
29.4
FY18E
18.9
32.9
78.6
5.7
30.0
92.9
53.3
10.7
60.0
26.4
0.3
89.1
49.6
9.1
55.6
21.8
0.3
69.1
40.9
7.7
44.8
17.6
0.5
64.0
36.9
6.6
40.6
14.9
0.5
56.5
31.4
5.9
35.6
12.8
0.5
38.0
22.0
5.4
23.8
10.2
0.7
34.5
19.6
4.6
20.9
8.5
0.9
30.0
17.2
3.8
18.0
7.2
1.0
31.5
29.4
26.8
28.7
28.3
32.7
25.2
32.2
24.3
30.9
29.8
39.4
26.9
36.7
26.0
35.8
47
76
3.0
46
75
2.6
42
68
3.5
44
66
3.3
44
62
3.2
47
71
3.0
48
69
2.8
48
69
2.7
0.3
0.2
0.1
0.0
0.0
0.0
0.0
0.0
Cash Flow Statement
Y/E March
PBT before Extra Ord
Add: Depreciation
Interest Paid
Less: Taxes Paid
Interest income
(Incr)/Decr in WC
CF from Operations
FY11
4,031
595
314
947
158
-435
3,401
10
3,411
-1,344
2,067
314
-1,030
-2,008
-1,331
1,029
-314
175
-2,449
-68
449
380
FY12
4,327
637
307
1,100
110
-309
3,751
0
3,751
-1,614
2,138
1,381
-233
-1,959
-143
1,122
-307
121
-1,167
2,352
380
2,732
FY13
5,795
686
155
1,595
231
149
4,958
18
4,977
-1,104
3,873
-1,958
-3,062
-2,459
-2,100
1,559
-155
14
-3,141
-1,226
2,732
1,506
FY14
6,188
812
163
1,653
115
-1,355
4,041
-65
3,976
-1,921
2,055
338
-1,583
-3,068
-653
1,619
-163
138
-2,127
266
1,506
1,772
FY15
6,828
1,178
156
1,694
113
-718
5,637
-49
5,588
-3,723
1,864
-996
-4,719
-3,707
125
1,789
-156
169
-1,780
-911
1,772
860
FY16E
10,593
1,318
68
2,966
107
-500
8,406
0
8,406
-2,500
5,906
-3,500
-6,000
-4,550
176
2,519
-68
162
-1,762
644
860
1,504
FY17E
12,002
1,451
61
3,601
141
-1,342
8,430
0
8,430
-2,500
5,930
-1,500
-4,000
-5,959
0
2,909
-61
203
-2,908
1,522
1,504
3,026
(INR Million)
FY18E
13,814
1,581
61
4,144
187
-985
10,139
0
10,139
-2,500
7,639
-1,500
-4,000
-3,588
0
0
-61
254
-3,395
2,744
3,026
5,770
Extra ordinary items
CFO after extraordinary
Incr in FA
Free Cash Flow
Pur of Investments
CF from Invest.
Change in Networth
Incr in Debt
Dividend Paid
Interest Paid
Others
CF from Fin. Activity
Incr/Decr of Cash
Add: Opening Balance
Closing Balance
E: MOSL Estimates
30 January 2016
7

Pidilite Industries
Corporate profile
Company description
Pidilite Industries is the largest branded
adhesives player in India, with an iconic brand
like Fevicol. Apart from a strong presence in
adhesives, company has expanded into
emerging segments like mechanized joinery,
modular furniture, flooring, automotive care and
water proofing through Dr Fixit and Roff.
Exhibit 1: Sensex rebased
Source: MOSL/Bloomberg
Exhibit 2: Shareholding pattern (%)
Promoter
DII
FII
Others
Dec-15
69.7
6.0
13.4
10.9
Sep-15
69.7
5.2
14.5
10.6
Dec-14
69.8
4.1
15.5
10.6
Exhibit 3: Top holders
Holder Name
Genesis Indian Investment Company Limited
-General Sub Fund
Government Pension Fund Global
NA
NA
% Holding
7.6
1.1
0.0
0.0
Source: Capitaline
Note: FII Includes depository receipts
Source: Capitaline
Exhibit 4: Top management
Name
N K Parekh
M B Parekh
Bharat Puri
Savithri Parekh
Designation
Vice Chairman
Executive Chairman
Managing Director
Company Secretary
Exhibit 5: Directors
Name
Bansi S Mehta
Sanjeev Aga
A B Parekh
Meera Shankar
Vinod K Dasari
Name
Ranjan Kapur
Sabyaschi Patnaik
A N Parekh
Uday Khanna
Source: Capitaline
*Independent
Exhibit 6: Auditors
Name
Delloite Haskins & Sells
M M Sheth & Co
Mahajan & Aibara
Type
Statutory
Secretarial Audit
Internal
Exhibit 7: MOSL forecast v/s consensus
EPS
(INR)
FY16
FY17
FY18
MOSL
forecast
14.9
16.4
18.9
Consensus
forecast
13.8
15.8
17.4
Variation (%)
8.0
3.8
8.6
Source: Bloomberg
Source: Capitaline
30 January 2016
8

Pidilite Industries
NOTES
30 January 2016
9

Disclosures
This document has been prepared by Motilal Oswal Securities Limited (hereinafter referred to as Most) to provide information about the company(ies) and/sector(s), if any, covered in the report and may be distributed by it and/or its
Pidilite Industries
affiliated company(ies). This report is for personal information of the selected recipient/s and does not construe to be any investment, legal or taxation advice to you. This research report does not constitute an offer, invitation or
inducement to invest in securities or other investments and Motilal Oswal Securities Limited (hereinafter referred as MOSt) is not soliciting any action based upon it. This report is not for public distribution and has been furnished to
you solely for your general information and should not be reproduced or redistributed to any other person in any form. This report does not constitute a personal recommendation or take into account the particular investment
objectives, financial situations, or needs of individual clients. Before acting on any advice or recommendation in this material, investors should consider whether it is suitable for their particular circumstances and, if necessary, seek
professional advice. The price and value of the investments referred to in this material and the income from them may go down as well as up, and investors may realize losses on any investments. Past performance is not a guide for
future performance, future returns are not guaranteed and a loss of original capital may occur.
MOSt and its affiliates are a full-service, integrated investment banking, investment management, brokerage and financing group. We and our affiliates have investment banking and other business relationships with a some
companies covered by our Research Department. Our research professionals may provide input into our investment banking and other business selection processes. Investors should assume that MOSt and/or its affiliates are
seeking or will seek investment banking or other business from the company or companies that are the subject of this material and that the research professionals who were involved in preparing this material may educate investors
on investments in such business. The research professionals responsible for the preparation of this document may interact with trading desk personnel, sales personnel and other parties for the purpose of gathering, applying and
interpreting information. Our research professionals are paid on the profitability of MOSt which may include earnings from investment banking and other business.
MOSt generally prohibits its analysts, persons reporting to analysts, and members of their households from maintaining a financial interest in the securities or derivatives of any companies that the analysts cover. Additionally, MOSt
generally prohibits its analysts and persons reporting to analysts from serving as an officer, director, or advisory board member of any companies that the analysts cover. Our salespeople, traders, and other professionals or affiliates
may provide oral or written market commentary or trading strategies to our clients that reflect opinions that are contrary to the opinions expressed herein, and our proprietary trading and investing businesses may make investment
decisions that are inconsistent with the recommendations expressed herein. In reviewing these materials, you should be aware that any or all of the foregoing among other things, may give rise to real or potential conflicts of interest.
MOSt and its affiliated company(ies), their directors and employees and their relatives may; (a) from time to time, have a long or short position in, act as principal in, and buy or sell the securities or derivatives thereof of companies
mentioned herein. (b) be engaged in any other transaction involving such securities and earn brokerage or other compensation or act as a market maker in the financial instruments of the company(ies) discussed herein or act as an
advisor or lender/borrower to such company(ies) or may have any other potential conflict of interests with respect to any recommendation and other related information and opinions.; however the same shall have no bearing
whatsoever on the specific recommendations made by the analyst(s), as the recommendations made by the analyst(s) are completely independent of the views of the affiliates of MOSt even though there might exist an inherent
conflict of interest in some of the stocks mentioned in the research report
Reports based on technical and derivative analysis center on studying charts company's price movement, outstanding positions and trading volume, as opposed to focusing on a company's fundamentals and, as such, may not match
with a report on a company's fundamental analysis. In addition MOST has different business segments / Divisions with independent research separated by Chinese walls catering to different set of customers having various
objectives, risk profiles, investment horizon, etc, and therefore may at times have different contrary views on stocks sectors and markets.
Unauthorized disclosure, use, dissemination or copying (either whole or partial) of this information, is prohibited. The person accessing this information specifically agrees to exempt MOSt or any of its affiliates or employees from, any
and all responsibility/liability arising from such misuse and agrees not to hold MOSt or any of its affiliates or employees responsible for any such misuse and further agrees to hold MOSt or any of its affiliates or employees free and
harmless from all losses, costs, damages, expenses that may be suffered by the person accessing this information due to any errors and delays. The information contained herein is based on publicly available data or other sources
believed to be reliable. Any statements contained in this report attributed to a third party represent MOSt’s interpretation of the data, information and/or opinions provided by that third party either publicly or through a subscription
service, and such use and interpretation have not been reviewed by the third party. This Report is not intended to be a complete statement or summary of the securities, markets or developments referred to in the document. While we
would endeavor to update the information herein on reasonable basis, MOSt and/or its affiliates are under no obligation to update the information. Also there may be regulatory, compliance, or other reasons that may prevent MOSt
and/or its affiliates from doing so. MOSt or any of its affiliates or employees shall not be in any way responsible and liable for any loss or damage that may arise to any person from any inadvertent error in the information contained in
this report. MOSt or any of its affiliates or employees do not provide, at any time, any express or implied warranty of any kind, regarding any matter pertaining to this report, including without limitation the implied warranties of
merchantability, fitness for a particular purpose, and non-infringement. The recipients of this report should rely on their own investigations.
This report is intended for distribution to institutional investors. Recipients who are not institutional investors should seek advice of their independent financial advisor prior to taking any investment decision based on this report or for
any necessary explanation of its contents.
Most and it’s associates may have managed or co-managed public offering of securities, may have received compensation for investment banking or merchant banking or brokerage services, may have received any compensation for
products or services other than investment banking or merchant banking or brokerage services from the subject company in the past 12 months.
Most and it’s associates have not received any compensation or other benefits from the subject company or third party in connection with the research report.
Subject Company may have been a client of Most or its associates during twelve months preceding the date of distribution of the research report
MOSt and/or its affiliates and/or employees may have interests/positions, financial or otherwise of over 1 % at the end of the month immediately preceding the date of publication of the research in the securities mentioned in this
report. To enhance transparency, MOSt has incorporated a Disclosure of Interest Statement in this document. This should, however, not be treated as endorsement of the views expressed in the report.
Motilal Oswal Securities Limited is registered as a Research Analyst under SEBI (Research Analyst) Regulations, 2014. SEBI Reg. No. INH000000412
There are no material disciplinary action that been taken by any regulatory authority impacting equity research analysis activities
Analyst Certification
The views expressed in this research report accurately reflect the personal views of the analyst(s) about the subject securities or issues, and no part of the compensation of the research analyst(s) was, is, or will be directly or
indirectly related to the specific recommendations and views expressed by research analyst(s) in this report. The research analysts, strategists, or research associates principally responsible for preparation of MOSt research receive
compensation based upon various factors, including quality of research, investor client feedback, stock picking, competitive factors and firm revenues
Disclosure of Interest Statement
Analyst ownership of the stock
Served as an officer, director or employee
PIDILITE INDUSTRIES
No
No
A graph of daily closing prices of securities is available at www.nseindia.com and http://economictimes.indiatimes.com/markets/stocks/stock-quotes
Regional Disclosures (outside India)
For U.S.
This report is not directed or intended for distribution to or use by any person or entity resident in a state, country or any jurisdiction, where such distribution, publication, availability or use would be contrary to law, regulation or which
would subject MOSt & its group companies to registration or licensing requirements within such jurisdictions.
Motilal Oswal Securities Limited (MOSL) is not a registered broker - dealer under the U.S. Securities Exchange Act of 1934, as amended (the"1934 act") and under applicable state laws in the United States. In addition MOSL is not a
registered investment adviser under the U.S. Investment Advisers Act of 1940, as amended (the "Advisers Act" and together with the 1934 Act, the "Acts), and under applicable state laws in the United States. Accordingly, in the
absence of specific exemption under the Acts, any brokerage and investment services provided by MOSL, including the products and services described herein are not available to or intended for U.S. persons.
This report is intended for distribution only to "Major Institutional Investors" as defined by Rule 15a-6(b)(4) of the Exchange Act and interpretations thereof by SEC (henceforth referred to as "major institutional investors"). This
document must not be acted on or relied on by persons who are not major institutional investors. Any investment or investment activity to which this document relates is only available to major institutional investors and will be
engaged in only with major institutional investors. In reliance on the exemption from registration provided by Rule 15a-6 of the U.S. Securities Exchange Act of 1934, as amended (the "Exchange Act") and interpretations thereof by
the U.S. Securities and Exchange Commission ("SEC") in order to conduct business with Institutional Investors based in the U.S., MOSL has entered into a chaperoning agreement with a U.S. registered broker-dealer, Motilal Oswal
Securities International Private Limited. ("MOSIPL"). Any business interaction pursuant to this report will have to be executed within the provisions of this chaperoning agreement.
The Research Analysts contributing to the report may not be registered /qualified as research analyst with FINRA. Such research analyst may not be associated persons of the U.S. registered broker-dealer, MOSIPL, and therefore,
may not be subject to NASD rule 2711 and NYSE Rule 472 restrictions on communication with a subject company, public appearances and trading securities held by a research analyst account.
For Hong Kong:
This report is distributed in Hong Kong by Motilal Oswal capital Markets (Hong Kong) Private Limited, a licensed corporation (CE AYY-301) licensed and regulated by the Hong Kong Securities and Futures Commission (SFC)
pursuant to the Securities and Futures Ordinance (Chapter 571 of the Laws of Hong Kong) “SFO”. As per SEBI (Research Analyst Regulations) 2014 Motilal Oswal Securities (SEBI Reg No. INH000000412) has an agreement with
Motilal Oswal capital Markets (Hong Kong) Private Limited for distribution of research report in Kong Kong. This report is intended for distribution only to “Professional Investors” as defined in Part I of Schedule 1 to SFO. Any
investment or investment activity to which this document relates is only available to professional investor and will be engaged only with professional investors.”
Nothing here is an offer or solicitation of these securities, products and services in any jurisdiction where their offer or sale is not qualified or exempt from registration. The Indian Analyst(s) who compile this report is/are not located in
Hong Kong & are not conducting Research Analysis in Hong Kong.
Motilal Oswal Capital Markets Singapore Pte Limited is acting as an exempt financial advisor under section 23(1)(f) of the Financial Advisers Act(FAA) read with regulation 17(1)(d) of the Financial Advisors Regulations and is a
subsidiary of Motilal Oswal Securities Limited in India. This research is distributed in Singapore by Motilal Oswal Capital Markets Singapore Pte Limited and it is only directed in Singapore to accredited investors, as defined in the
Financial Advisers Regulations and the Securities and Futures Act (Chapter 289), as amended from time to time.
In respect of any matter arising from or in connection with the research you could contact the following representatives of Motilal Oswal Capital Markets Singapore Pte Limited:
Kadambari Balachandran
Email : kadambari.balachandran@motilaloswal.com
Contact : (+65) 68189233 / 65249115
Office Address : 21 (Suite 31),16 Collyer Quay,Singapore 04931
For Singapore
30 January 2016
Motilal Oswal Tower, Level 9, Sayani Road, Prabhadevi, Mumbai 400 025
Phone: +91 22 3982 5500 E-mail: reports@motilaloswal.com
Motilal Oswal Securities Ltd
10