30 January 2016
3QFY16 Results Update | Sector: Healthcare
BSE SENSEX
24,871
Bloomberg
Equity Shares (m)
M.Cap. (INR b)/ USD
b)
52-Week Range (INR)
1, 6, 12 Rel.Per (%)
AvgVal,(INR m)
Free float (%)
S&P CNX
7,564
GNP IN
271.3
209.2/3.1
1,262/705
-13/-12/23
1,042
53.5
Glenmark Pharma
CMP: INR771
TP: INR900 (+17%)
Neutral
Results below estimates; LatAm and US underperform
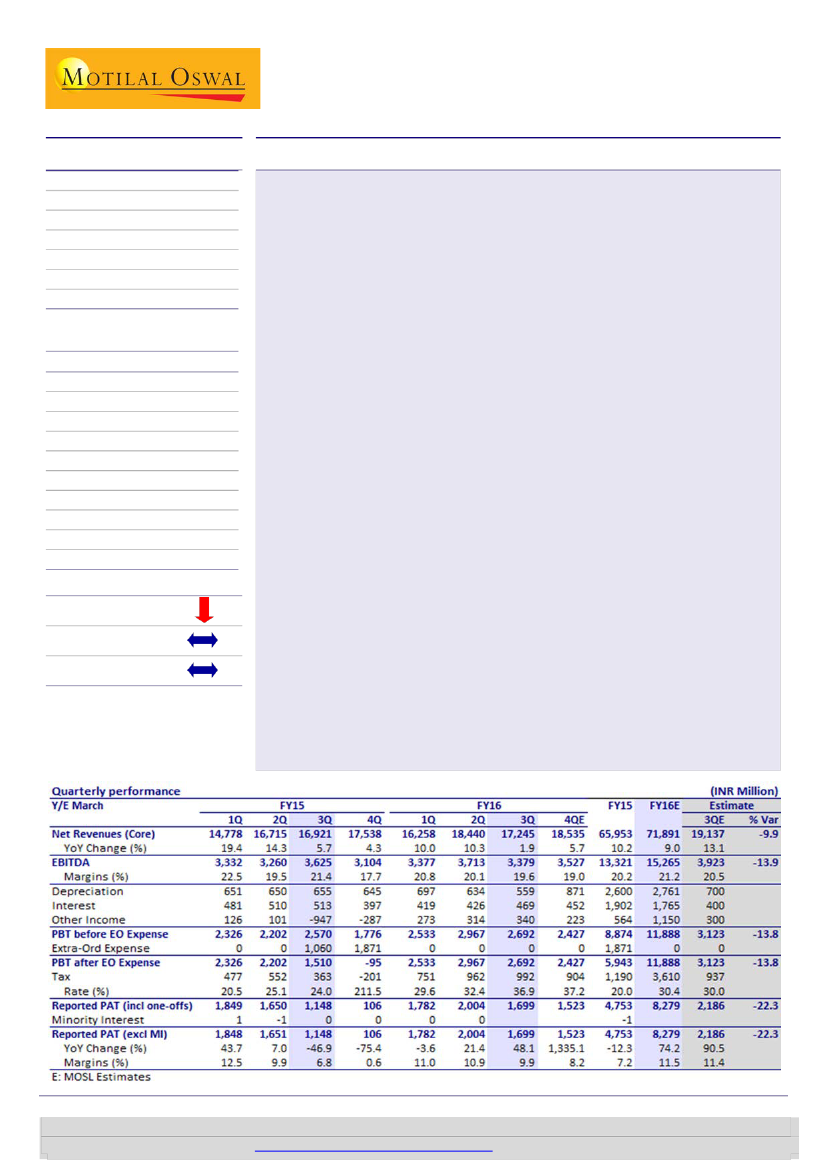
Glenmark’s (GNP) 3QFY16 performance was largely below our estimates. Revenue
grew 2% YoY (10% miss) and EBITDA 7% YoY (14% miss). PAT stood at INR1.7b (48%
growth; 22% miss).
Latam and weak US affect 3Q:
US business grew 20%YoY to INR6.1b (6% miss) on
the back of continued pricing pressure on existing portfolio and lower traction in
newly launched products during the quarter. Stoppage of supplies to Venezuela
market and steep depreciation in Brazilian currency resulted in LatAm market sales
declining 47% YoY to INR1.2b (24% miss) in 3Q. India business reported 12.7 %YoY
growth on account of loss of sales of Sitagliptin products. Despite forex headwinds
in Russia/CIS region, SRM segment grew 14% YoY (in line). We estimate GNP to
post 16% revenue CAGR over FY15-18 (v/s 10% in FY15).
EBITDA margin disappoints:
EBITDA margin at 19.6% was 90bp below our
estimates on higher other expenses in 3Q. Other expenses at 31% of sales were
300bp higher than our estimates, mainly on account of negative operating leverage
on lower sales. Surprisingly, gross margin at 70.6% was 350bp higher than 3QFY15.
R&D spends stood at INR1.7b in 3Q, 9.2% of sales. Going forward, we expect
margin to improve from 21.4% in FY16 to 25% in FY18 on the back of improved
operating leverage and niche product launches in the US.
Earnings call highlights:
1) Venezuela sales are likely to become negligible going
ahead. 2) Gross debt increased to INR34.5b in Dec’15 from INR32b in Sep’15 on the
back of Tarka liability (INR2.1b). 2) Net forex losses stood at INR270m in 3Q. 3) The
company doesn’t anticipate any AG product launch with Zetia. 4) GNP has signed
50:50 profit share agreement with its partner for Zetia.
Maintain Neutral
:
Post the recent correction in stock price (down ~20% in the
last one month), valuations are not expensive. Having said that, currency volatility
in emerging markets and potential risk of write-off of cash in Venezuala (~USD35m)
will keep multiples range-bound. We have cut our FY16-18E EPS by 6-9% as we
build zero sales from Venezuala going forward. Though Zetia exclusivity will bring
debt under check, pick-up in US base business is the key to maintain sustainable
growth. Maintain
Neutral
(TP: INR900, 18x on FY18E EPS + INR20 NPV for Zetia).
Big In-licensing deal in innovation business could act as a positive catalyst.
Financials & valuations (INR b)
Y/E Mar
Sales
EBITDA
Net Profit
AdjEPS(INR)
)
EPS Gr. (%)
BV/Sh(INR)
RoE (%)
RoCE (%)
P/E (x)
P/BV (x)
2015
66.0
11.8
4.8
17.5
-12.3
110.6
15.8
14.4
44.0
7.0
2016E 2017E
71.9
15.4
8.4
29.8
70.4
17.9
18.6
25.8
4.6
87.9
23.4
11.3
39.9
33.7
18.6
26.6
19.3
3.6
166.4 214.5
Estimate change
TP change
Rating change
Kumar Saurabh
(Kumar.Saurabh@MotilalOswal.com); +91 22 3982 5584
Amey Chalke
(amey.chalke@motilaloswal.com); +91 22 39825423
Investors are advised to refer through important disclosures made at the last page of the Research Report.
Motilal Oswal research is available on
www.motilaloswal.com/Institutional-Equities,
Bloomberg, Thomson Reuters, Factset and S&P Capital.

Glenmark Pharma
Key highlights
India (27% of sales)
India sales grew 13% YoY to INR4.9b affected by stoppage of sale of Sitagliptin
products post court order. However, GNP has launched Tenaligliptin in 1Q and has
generated INR230m till date. The company has also been successful in improving
market share in therapies like Anti Diabetes, Derma and Respiratory. We expect
India business to grow at 18-19%CAGR over FY15-18E
In the US, the company received two approvals during this quarter - namely,
Linezolid tablets and Clotrimazole and betamethasone dipropionate topical cream.
In FY16, it has received thirteen product approvals from US FDA and most of these
products are in market. In FY16, GNP has also filed 6 more products with US FDA,
taking total filings to 167. It also intends to file another 6-8 ANDAs during next
quarter. Out of total 167 filings, 63 are still pending with US FDA, which also include
26 Para IV opportunities. Going ahead, we project 27% CAGR growth over FY15-18E.
(2-3 products to come in 4QFY16E)
US (34% of sales)
SRM (13% of sales)
Russia business is growing at ~5% in constant currency, whereas secondary sales for
the quarter were at 16%. Management believes Russia business environment
continues to remain challenging as demand conditions are still weak. Additionally,
Russian currency has also seen 30% depreciation against USD YoY, that aggravated
overall sales impact in rupee terms.
However, Asia reported strong growth during this quarter as Malaysia, Myanmar, Sri
Lanka, Philippines and Cambodia regions grew in excess of 20%. The Africa regions
also recorded strong primary sales growth (30%YoY) for South Africa, Nigeria and
Kenya subsidiaries. GNP launched three products in these regions.
LatAm (7% of sales)
LatAM sales declined 47%YoY to INR 2.3b, affected by lower Venezuela sales and
deprecating Brazilian currency. In 3Q, outstanding sales in Venezuela stand at USD
20-21m while total cash at subsidiary level is still higher at USD30-35m. In local
currency, Brazil and Mexico sales grew 10%YoY and 50% respectively in 3Q, GNP
launched one product each in Mexican and Caribbean market during this quarter.
Europe (10% of sales)
Sales in European market grew 2%YoY in 3Q. However, secondary sales growth was
much better as German business continues to perform well for the company. In CEE
region, GNP launched Bortezomib, Pregabalin, Aripiprazole, Dexpanthenol,
Magnesium Complex B, Eztom (Mometasone) Spray, Rekarnival. In the western
region, It has launched Lansoprazole, Losartan, Memantine oral drop, Omeprazole in
UK.
In 3Q, GNP entered into a strategic agreement with Celon Pharma to develop a
generic version of GSK’s Seretide in Europe. As per the agreement, GNP has
30 January 2016
2

Glenmark Pharma
marketing rights of 15 European countries. Celon will receive milestone payments
during various stages of drug development and marketing.
Other highlight
In 3Q, gross debt was increased to INR34.5b in Dec’15 from INR32b in Sep’15.
Cash was lower at INR6.5b in Dec’15 compared to INR7.9b in Sep’15. As result,
Net debt was increased to INR28b in 3Q from INR24b in 2Q. Debt increase is on
account of Tarka liability.
R&D spend was at INR1.7b during this quarter (9.2% of sales). However, over
next two years management expects R&D to scale up on the back of complexity
of filings and likely to reach to 10-11% of sales.
Net forex losses were at INR270m in 3Q.
30 January 2016
3

Glenmark Pharma
Operating metrics
Exhibit 1: Key operating metrics
4QFY13
Revenue Mix (%)
India
US
Europe
LatAm
SRM
API
Revenue Gr. (%)
India
US
Europe
LatAm
SRM
API
As % of sales
Raw material
Staff cost
Other expenses
Tax Rate
Margins (%)
Gross Margins
EBITDA Margins
EBIT Margins
PAT margins
71.8
20.2
17.8
12.5
67.3
20.0
17.2
10.4
66.7
21.6
17.4
10.5
66.4
22.8
18.9
13.5
73.6
21.4
17.8
2.6
69.7
22.5
18.1
12.5
67.1
19.5
15.6
9.9
67.1
21.4
17.6
13.0
78.2
17..7
14.0
0.6
28.2
15.6
36.0
2.6
32.7
17.0
30.3
23.1
33.3
18.1
27.1
28.5
33.6
17.1
26.6
18.1
26.4
16.5
35.7
4.1
30.3
18.7
28.5
20.5
32.9
21.3
26.4
25.1
32.9
18.7
27.0
23.0
21.8
14.5
46.0
23.0
26.6
32.1
11.2
5.9
16.6
7.6
16.3
32.4
25.0
37.6
5.6
21.1
10.4
26.5
36.1
5.9
7.1
13.6
10.8
18.3
17.4
13.9
20.7
31.2
25.0
26.5
28.5
38.1
7.1
6.6
11.9
6.9
1.3
21.4
29.5
35.9
(2.5)
(10.6)
9.1
23.8
32.6
8.5
7.1
18.8
9.2
1.2
15.3
19.4
57.6
12.3
14.9
(0.8)
22.5
29.4
11.3
6.2
20.1
9.0
11.9
7.9
16.7
29.5
33.9
54.7
89.4
26.7
32.9
6.6
7.9
14.2
9.7
9.5
20.9
9.3
34.5
33.9
25.4
37.2
28.4
30.2
7.8
13.7
10.4
9.5
19.2
14.5
(9.0)
25.1
139.0
0.3
41.3
25.5
29.8
10.2
13.8
12.2
8.6
6.3
13.6
(2.7)
27.3
105.8
(31.2)
(1.0)
24.8
30.2
13.7
10.2
12.4
8.7
1.8
15.0
7.1
25.9
70.5
(35.8)
(13.0)
28.6
33.9
6.6
13.2
9.5
8.2
6.4
18.5
14.8
12.4
85.7
(25.2)
(22.6)
1QFY14
2QFY14
3QFY14
4QFY14 1QFY15 2QFY15
3QFY15 4QFY15
1QFY16 2QFY16
3QFY16
31.9
31.3
8.4
8.7
11.0
8.7
4.4
27.3
17.9
22.8
(28.2)
21.2
3.7
27.4
34.2
9.9
7.0
13.3
8.2
4.5
12.7
20.0
2.0
(47.2)
14.1
(1.0)
30.7
17.6
30.9
23.0
69.3
20.8
16.5
11.0
29.8
21.6
28.5
23.0
70.2
20.1
16.7
10.8
29.4
20.0
31.0
36.9
70.6
19.6
16.4
9.9
Source: Company; MOSL
30 January 2016
4

Glenmark Pharma
Valuation and view
Maintain Neutral
:
At CMP, the stock is trading at 26x FY16E EPS, 19x FY17E EPS
and 16x FY18E EPS. Our concerns remain on low EBITDA margins (compared with
peers), substantial revenue exposure to Venezuela (15-18% of FY16E EPS), quality
of balance sheet (low return ratios, high payable days, high FCTR losses) and weak
cash flow generation. Re-rating scope is limited unless novel drug pipeline starts
delivering in big way or the company receives a few more big approvals in the US
market.
We maintain
Neutral
rating on the stock with target price of INR900 (18x on FY18E
EPS + INR20 option value for Zetia).
Key catalysts to drive stock’s performance over the medium term are:
Monetisation of key Para IVs like gFinacea and gZetia (FY16-18E).
Gradual reduction in gross debt, as cash flows improves. We expect D/E to
moderate from 1.3x in FY15E to 0.3x in FY18E
Turnaround in LatAm business (targeted by FY16 end)
Key risks to our investment thesis:
Regulatory delays affecting key US launches.
Any adverse US FDA action upon inspection of US facilities
Developmental setbacks in the novel research pipeline.
Exhibit 3: PE relative to Sensex
Avg(x)
138.7
600
400
31.4
200
0
Exhibit 2: GNP P/E multiple (over 10 year)
150
100
50
0
PE (x)
Median(x)
Peak(x)
Min(x)
Glenmark Pharma PE Relative to Sensex PE (%)
LPA (%)
23.9
21.7
83.4
12.5
36.3
30 January 2016
5

Glenmark Pharma
Story in charts
Exhibit 4: Formulation lead sales growth (INR b)
Formulations (INR b)
API (INR b)
24.2
20.1
Exhibit 5: Margins improving with product mix
EBITDA (INR b)
24.5
21.2
21.5
EBITDA Margin (%)
26.6
17.8
21.4
25.2
22
25
34
45
54
60
68
86
103
6
6
10
11
13
12
15
23
26
FY10 FY11 FY12 FY13 FY14 FY15 FY16E FY17E FY18E
Source: Company, MOSL
FY10 FY11 FY12 FY13 FY14 FY15 FY16E FY17E FY18E
Source: Company, MOSL
Exhibit 6: Strong earnings growth expected ahead
Core EPS (INR/ share)
One off
12
12
-
0
12
4
13
0
17
0
23
0
20
-
18
30
40
49
Exhibit 7: R&D expense higher due to NCE research
R&D Expense (INR b)
10.0
6.6
4.7
1.4
FY11
2.6
FY12
3.9
FY13
6.0
FY14
6.0
7.0
9.7
11.4
7.7
9.1
% of sales
9.8
11.0
11.0
4.8
1.2
FY10
FY15 FY16E FY17E FY18E
Source: Company, MOSL
FY10 FY11 FY12 FY13 FY14 FY15 FY16E FY17E FY18E
Source: Company, MOSL
Exhibit 8: Debt lowering with improved cash flows
Free cashflow (INR b)
8
0.8
0
1.0
2
1.0
2
1.0
2
1.1
2
D/E
8
10
Exhibit 9: Return ratios to increase with better margins
RoE (%)
22.2
18.2
16.1
11.4
19.9
14.4
15.8
17.9
18.6
18.6 18.0
RoCE (%)
26.6
25.9
1.3
1.3
2
14.1
0.6
0.4
12.7
17.4
19.2
13.4
FY10 FY11 FY12 FY13 FY14 FY15 FY16E FY17E FY18E
Source: Company, MOSL
30 January 2016
6

Glenmark Pharma
Financials and valuations
Key assumption
Segment growth
India
US
Europe
LatAm
SRM
API
Total sales
Expenses
Raw material
Staff cost
EBITDA Margins
2011
12.2
15.5
24.6
36.2
5.3
5.3
18.7
33.6
17.3
20.1
2012
18.6
45.3
45.2
29.8
45.6
11.8
36.3
33.5
15.6
24.5
2013
30.7
39.1
23.8
15.2
37.1
28.5
24.7
33.0
15.7
21.2
2014
15.3
20.0
35.9
16.7
21.5
34.6
19.8
31.3
17.1
21.5
2015
15.8
0.6
27.4
88.8
-17.7
13.1
10.6
29.3
18.2
17.8
2016E
19.5
18.1
5.5
-2.0
5.0
0.0
8.2
30.9
19.1
21.4
2017E
19.0
44.2
20.9
18.4
15.0
10.0
22.3
27.0
17.6
26.6
2018E
18.0
20.1
25.3
18.4
15.0
10.0
18.1
28.0
16.9
25.2
Income Statement
Y/E March
Net Sales
Change (%)
EBITDA
Change (%)
Margin (%)
Depreciation
EBIT
Interest
OI &forex gains/losses
PBT after EO Exp.
Tax
Tax Rate (%)
Reported PAT
Minority Interest
Adj PAT**
Change (%)
Margin (%)
E: MOSL Estimates
2011
29,490
19.8
5,922
-0.7
20.1
947
4,975
1,566
1,405
4,815
237
4.9
4,578
0
3,547
7.2
12.4
2012
40,204
36.3
9,858
66.5
24.5
979
8,879
1,466
-1,218
4,878
238
4.9
4,640
40
4,601
29.7
12.2
2013
50,123
24.7
10,610
7.6
21.2
1,270
9,340
1,600
-403
7,337
1,107
15.1
6,230
83
6,147
33.6
12.4
2014
59,839
19.4
12,870
21.3
21.5
2,168
10,702
1,886
328
6,969
1,513
21.7
5,456
33
5,423
-11.8
9.1
2015E
65,953
10.2
11,751
-8.7
17.8
2,600
9,151
1,902
564
5,943
1,190
20.0
4,752
-1
4,753
-12.3
7.2
2016E
71,891
9.0
15,408
31.1
21.4
2,761
12,647
1,765
1,150
12,032
3,610
30.0
8,422
0
8,422
77.2
11.7
2017E
87,944
22.3
23,382
51.7
26.6
3,256
20,126
1,405
1,250
19,971
5,392
27.0
14,579
0
11,264
33.7
12.8
(INR Million)
2018E
103,841
18.1
26,214
12.1
25.2
3,511
22,703
1,243
1,350
22,810
5,703
25.0
17,108
0
13,793
22.5
13.3
30 January 2016
7

Glenmark Pharma
Financials and valuations
Balance Sheet
Y/E March
Equity Share Capital
Reserves
Net Worth
Minority Interest
Loans
Deferred liabilities
Capital Employed
Gross Block
Less: Accum. Deprn.
Net Fixed Assets
Capital WIP
Investments
Intangibles (net)
Curr. Assets
Inventory
Account Receivables
Cash and Bank Balance
Others
Curr. Liability & Prov.
Account Payables
Provisions
Net Current Assets
Appl. of Funds
E: MOSL Estimates
(INR Million)
2011
270
20,102
20,372
267
21,258
-1081
40,816
25,899
4,876
21,023
1,100
309
9,723
25,988
8,070
11,308
1,959
4,651
7,605
7,560
44
18,384
40,816
2012
271
23,746
24,016
250
23,225
-2674
44,817
29,027
4,137
24,235
656
298
11,253
29,472
7,877
12,436
3,201
5,958
9,843
9,334
509
19,629
44,817
2013
271
27,359
27,630
244
28,500
-3803
52,571
33,609
5,286
26,634
1,689
323
12,136
37,493
8,435
16,400
6,052
6,605
13,568
12,557
1,011
23,925
52,571
2014
271
29,562
29,833
133
33,191
-5142
58,015
38,408
7,430
30,181
798
331
12,729
47,814
9,329
21,563
7,948
8,974
21,109
17,540
3,569
26,705
58,015
2015
271
29,732
30,003
-2
37,999
-2750
65,251
42,516
10,029
32,486
798
171
12,729
57,872
12,690
25,118
7,681
12,382
26,077
24,564
1,513
31,795
65,251
2016E
282
46,664
46,947
-2
29,904
-3250
73,598
49,516
12,790
36,726
798
171
12,729
61,039
14,772
25,605
8,227
12,435
25,135
23,635
1,500
35,904
73,598
2017E
282
60,253
60,535
-2
26,300
-3250
83,582
55,516
16,046
39,470
798
171
12,729
71,147
15,661
31,322
10,491
13,673
28,004
26,504
1,500
43,144
83,582
2018E
282
76,370
76,652
-2
23,416
-3250
96,816
61,516
19,557
41,959
798
171
12,729
86,683
18,492
36,985
15,138
16,068
32,795
31,295
1,500
53,889
96,816
Ratios
Y/E March
Basic (INR)
EPS (Fully diluted)*
Cash EPS
BV/Share
DPS
Payout (%)
Valuation (x)
P/E (Fully diluted)
PEG (x)
Cash P/E
P/BV
EV/Sales
EV/EBITDA
Dividend Yield (%)
Return Ratios (%)
RoE
RoCE
Working Capital Ratios
Fixed Asset Turnover (x)
Debtor (Days)
Inventory (Days)
Working Capital (Days)
Leverage Ratio (x)
Current Ratio
Debt/Equity
2011
13.1
16.6
75.4
0.7
5.2
59.0
8.2
46.5
10.2
7.7
38.6
0.1
17.4
13.4
1.5
140
100
203
3.4
1.0
2012
17
20.6
88.8
2.0
13.6
2013
22.7
27.3
102.0
2.0
10.2
34.0
1.0
28.2
7.6
4.6
21.8
0.3
22.2
16.1
2.0
119
61
130
2.8
1.0
2014
20.0
28.0
110.0
2.0
11.6
38.6
-3.3
27.6
7.0
3.9
18.2
0.3
18.2
19.9
2.1
132
57
114
2.3
1.1
2015
17.5
27.1
110.6
3.0
20.0
44.0
-3.6
28.4
7.0
3.6
20.4
0.4
15.8
14.4
2.1
139
70
133
2.2
1.3
2016E
29.8
39.6
166.4
3.0
11.8
25.8
0.3
19.5
4.6
3.2
15.0
0.4
17.9
18.6
2.1
130
75
141
2.4
0.6
2017E
39.9
51.5
214.5
3.0
6.8
19.3
0.6
15.0
3.6
2.6
9.6
0.4
18.6
26.6
2.3
130
65
136
2.5
0.4
2018E
48.9
61.3
271.7
3.0
5.8
15.8
0.7
12.6
2.8
2.1
8.3
0.4
18.0
25.9
2.6
130
65
136
2.6
0.3
0.0
37.5
8.7
5.7
23.2
0.3
19.2
11.4
1.8
113
72
149
3.0
1.0
30 January 2016
8

Glenmark Pharma
Financials and valuations
Cash Flow Statement
Y/E March
Op. Profit/(Loss) before Tax
Interest/Dividends Recd.
Direct Taxes Paid
(Inc)/Dec in WC
CF from Operations
EO Expense
CF frmOp.incl EO Exp.
(Inc)/Dec in FA
Free Cash Flow
(Pur)/Sale of Investments
CF from Investments
Change in Networth
Inc/(Dec) in Debt
Interest Paid
Dividend Paid
CF from Fin. Activity
Inc/Dec of Cash
Add: Beginning Balance
Closing Balance
2011
5,922
1,405
-2,029
1,530
6,828
0
6,828
810
7,639
-128
682
-7,520
2,701
-1,566
-236
-6,621
890
1,069
1,959
2012
9,858
-1,218
-1,830
-3
6,806
1,317
5,489
-3,746
1,743
11
-3,735
-364
1,950
-1,466
-633
-512
1,242
1,959
3,201
2013
10,610
-403
-2,236
-1,445
6,526
0
6,526
-4,703
1,824
-25
-4,728
-1,982
5,268
-1,600
-634
1,052
2,851
3,201
6,052
2014
12,870
328
-2,852
-885
9,461
2,175
7,286
-4,824
2,462
-7
-4,831
-2,619
4,581
-1,886
-635
-559
1,896
6,052
7,948
2015
11,751
564
1,201
-5,356
8,160
1,871
6,289
-4,906
1,384
159
-4,746
-3,630
4,674
-1,902
-952
-1,810
-267
7,948
7,681
2016E
15,408
1,150
-4,110
-3,563
8,885
0
8,885
-7,000
1,885
0
-7,000
9,511
-8,095
-1,765
-990
-1,340
545
7,681
8,227
2017E
23,382
1,250
-5,392
-4,975
14,264
0
14,264
-6,000
8,264
0
-6,000
0
-3,604
-1,405
-990
-6,000
2,265
8,227
10,491
(INR Million)
2018E
26,214
1,350
-5,703
-6,098
15,764
0
15,764
-6,000
9,764
0
-6,000
0
-2,883
-1,243
-990
-5,117
4,647
10,491
15,138
30 January 2016
9

Glenmark Pharma
Corporate profile: GlenmarkPharma
Company description
Glenmark is one of the second tier integrated
pharmaceutical
companies
which
has
differentiated itself through its success in NCE
research. The company has pipeline of 5 Novel
drugs in different phases of clinical studies. It is
also one of the leading Indian generic companies in
US with focus on niche generics segments.
Glenmark has large presence in semi-regulated
markets.
Exhibit 22: Sensex rebased
Exhibit 10: Shareholding pattern (%)
Dec-15
Promoter
DII
FII
Others
46.5
5.6
36.9
11.0
Sep-15
46.5
6.0
36.8
10.8
Dec-14
48.3
6.4
34.6
10.7
Exhibit 11: Top holders
Holder Name
Aranda Investments(Mauritius) Pte Ltd.
Oppenheimer Developing Markets Fund
Life Insurance Corporation Of India
Hsbc Global Investment Funds A/C Hsbc Gif Mauritius
T. Rowe Price Emerging Markets Stock Fund
Credit Suisse (Singapore) Limited
% Holding
4.0
2.3
1.6
1.2
1.1
1.0
Note: FII Includes depository receipts
Exhibit 12: Top management
Name
Glenn Saldanha
B E Saldanha
Cheryl Pinto
Designation
Chairman & Managing Director
Director
Director (Corporate Affairs)
Exhibit 13: Directors
Name
Glenn Saldanha
B E Saldanha
D R Mehta*
Bernard Munos*
Sridhar Gorthi*
*Independent
Name
Brian W Tempest*
Julio F Ribeiro*
Rajesh Desai
Cheryl Pinto
Exhibit 14: Auditors
Name
Walker Chandiok & Co LLP
S S Rauthan & Associates
Khare & Co
Type
Statutory
Secretarial Audit
Cost Auditor
Exhibit 15: MOSL forecast v/s consensus
EPS
(INR)
FY16
FY17
FY18
MOSL
forecast
29.8
39.9
48.9
Consensus
forecast
34.4
54.4
58.9
Variation
(%)
-13.5
-26.7
-17.0
30 January 2016
10

Glenmark Pharma
NOTES
30 January 2016
11

Disclosures
This document has been prepared by Motilal Oswal Securities Limited (hereinafter referred to as Most) to provide information about the company(ies) and/sector(s), if any, covered in the report and may be distributed by it and/or its
Glenmark Pharma
affiliated company(ies). This report is for personal information of the selected recipient/s and does not construe to be any investment, legal or taxation advice to you. This research report does not constitute an offer, invitation or
inducement to invest in securities or other investments and Motilal Oswal Securities Limited (hereinafter referred as MOSt) is not soliciting any action based upon it. This report is not for public distribution and has been furnished to
you solely for your general information and should not be reproduced or redistributed to any other person in any form. This report does not constitute a personal recommendation or take into account the particular investment
objectives, financial situations, or needs of individual clients. Before acting on any advice or recommendation in this material, investors should consider whether it is suitable for their particular circumstances and, if necessary, seek
professional advice. The price and value of the investments referred to in this material and the income from them may go down as well as up, and investors may realize losses on any investments. Past performance is not a guide for
future performance, future returns are not guaranteed and a loss of original capital may occur.
MOSt and its affiliates are a full-service, integrated investment banking, investment management, brokerage and financing group. We and our affiliates have investment banking and other business relationships with a some
companies covered by our Research Department. Our research professionals may provide input into our investment banking and other business selection processes. Investors should assume that MOSt and/or its affiliates are
seeking or will seek investment banking or other business from the company or companies that are the subject of this material and that the research professionals who were involved in preparing this material may educate investors
on investments in such business. The research professionals responsible for the preparation of this document may interact with trading desk personnel, sales personnel and other parties for the purpose of gathering, applying and
interpreting information. Our research professionals are paid on the profitability of MOSt which may include earnings from investment banking and other business.
MOSt generally prohibits its analysts, persons reporting to analysts, and members of their households from maintaining a financial interest in the securities or derivatives of any companies that the analysts cover. Additionally, MOSt
generally prohibits its analysts and persons reporting to analysts from serving as an officer, director, or advisory board member of any companies that the analysts cover. Our salespeople, traders, and other professionals or affiliates
may provide oral or written market commentary or trading strategies to our clients that reflect opinions that are contrary to the opinions expressed herein, and our proprietary trading and investing businesses may make investment
decisions that are inconsistent with the recommendations expressed herein. In reviewing these materials, you should be aware that any or all of the foregoing among other things, may give rise to real or potential conflicts of interest.
MOSt and its affiliated company(ies), their directors and employees and their relatives may; (a) from time to time, have a long or short position in, act as principal in, and buy or sell the securities or derivatives thereof of companies
mentioned herein. (b) be engaged in any other transaction involving such securities and earn brokerage or other compensation or act as a market maker in the financial instruments of the company(ies) discussed herein or act as an
advisor or lender/borrower to such company(ies) or may have any other potential conflict of interests with respect to any recommendation and other related information and opinions.; however the same shall have no bearing
whatsoever on the specific recommendations made by the analyst(s), as the recommendations made by the analyst(s) are completely independent of the views of the affiliates of MOSt even though there might exist an inherent
conflict of interest in some of the stocks mentioned in the research report
Reports based on technical and derivative analysis center on studying charts company's price movement, outstanding positions and trading volume, as opposed to focusing on a company's fundamentals and, as such, may not match
with a report on a company's fundamental analysis. In addition MOST has different business segments / Divisions with independent research separated by Chinese walls catering to different set of customers having various
objectives, risk profiles, investment horizon, etc, and therefore may at times have different contrary views on stocks sectors and markets.
Unauthorized disclosure, use, dissemination or copying (either whole or partial) of this information, is prohibited. The person accessing this information specifically agrees to exempt MOSt or any of its affiliates or employees from, any
and all responsibility/liability arising from such misuse and agrees not to hold MOSt or any of its affiliates or employees responsible for any such misuse and further agrees to hold MOSt or any of its affiliates or employees free and
harmless from all losses, costs, damages, expenses that may be suffered by the person accessing this information due to any errors and delays. The information contained herein is based on publicly available data or other sources
believed to be reliable. Any statements contained in this report attributed to a third party represent MOSt’s interpretation of the data, information and/or opinions provided by that third party either publicly or through a subscription
service, and such use and interpretation have not been reviewed by the third party. This Report is not intended to be a complete statement or summary of the securities, markets or developments referred to in the document. While we
would endeavor to update the information herein on reasonable basis, MOSt and/or its affiliates are under no obligation to update the information. Also there may be regulatory, compliance, or other reasons that may prevent MOSt
and/or its affiliates from doing so. MOSt or any of its affiliates or employees shall not be in any way responsible and liable for any loss or damage that may arise to any person from any inadvertent error in the information contained in
this report. MOSt or any of its affiliates or employees do not provide, at any time, any express or implied warranty of any kind, regarding any matter pertaining to this report, including without limitation the implied warranties of
merchantability, fitness for a particular purpose, and non-infringement. The recipients of this report should rely on their own investigations.
This report is intended for distribution to institutional investors. Recipients who are not institutional investors should seek advice of their independent financial advisor prior to taking any investment decision based on this report or for
any necessary explanation of its contents.
Most and it’s associates may have managed or co-managed public offering of securities, may have received compensation for investment banking or merchant banking or brokerage services, may have received any compensation for
products or services other than investment banking or merchant banking or brokerage services from the subject company in the past 12 months.
Most and it’s associates have not received any compensation or other benefits from the subject company or third party in connection with the research report.
Subject Company may have been a client of Most or its associates during twelve months preceding the date of distribution of the research report
MOSt and/or its affiliates and/or employees may have interests/positions, financial or otherwise of over 1 % at the end of the month immediately preceding the date of publication of the research in the securities mentioned in this
report. To enhance transparency, MOSt has incorporated a Disclosure of Interest Statement in this document. This should, however, not be treated as endorsement of the views expressed in the report.
Motilal Oswal Securities Limited is registered as a Research Analyst under SEBI (Research Analyst) Regulations, 2014. SEBI Reg. No. INH000000412
There are no material disciplinary action that been taken by any regulatory authority impacting equity research analysis activities
Analyst Certification
The views expressed in this research report accurately reflect the personal views of the analyst(s) about the subject securities or issues, and no part of the compensation of the research analyst(s) was, is, or will be directly or
indirectly related to the specific recommendations and views expressed by research analyst(s) in this report. The research analysts, strategists, or research associates principally responsible for preparation of MOSt research receive
compensation based upon various factors, including quality of research, investor client feedback, stock picking, competitive factors and firm revenues
Disclosure of Interest Statement
Analyst ownership of the stock
Served as an officer, director or employee
GLENMARK PHARMA
No
No
A graph of daily closing prices of securities is available at www.nseindia.com and http://economictimes.indiatimes.com/markets/stocks/stock-quotes
Regional Disclosures (outside India)
For U.S.
This report is not directed or intended for distribution to or use by any person or entity resident in a state, country or any jurisdiction, where such distribution, publication, availability or use would be contrary to law, regulation or which
would subject MOSt & its group companies to registration or licensing requirements within such jurisdictions.
Motilal Oswal Securities Limited (MOSL) is not a registered broker - dealer under the U.S. Securities Exchange Act of 1934, as amended (the"1934 act") and under applicable state laws in the United States. In addition MOSL is not a
registered investment adviser under the U.S. Investment Advisers Act of 1940, as amended (the "Advisers Act" and together with the 1934 Act, the "Acts), and under applicable state laws in the United States. Accordingly, in the
absence of specific exemption under the Acts, any brokerage and investment services provided by MOSL, including the products and services described herein are not available to or intended for U.S. persons.
This report is intended for distribution only to "Major Institutional Investors" as defined by Rule 15a-6(b)(4) of the Exchange Act and interpretations thereof by SEC (henceforth referred to as "major institutional investors"). This
document must not be acted on or relied on by persons who are not major institutional investors. Any investment or investment activity to which this document relates is only available to major institutional investors and will be
engaged in only with major institutional investors. In reliance on the exemption from registration provided by Rule 15a-6 of the U.S. Securities Exchange Act of 1934, as amended (the "Exchange Act") and interpretations thereof by
the U.S. Securities and Exchange Commission ("SEC") in order to conduct business with Institutional Investors based in the U.S., MOSL has entered into a chaperoning agreement with a U.S. registered broker-dealer, Motilal Oswal
Securities International Private Limited. ("MOSIPL"). Any business interaction pursuant to this report will have to be executed within the provisions of this chaperoning agreement.
The Research Analysts contributing to the report may not be registered /qualified as research analyst with FINRA. Such research analyst may not be associated persons of the U.S. registered broker-dealer, MOSIPL, and therefore,
may not be subject to NASD rule 2711 and NYSE Rule 472 restrictions on communication with a subject company, public appearances and trading securities held by a research analyst account.
This report is distributed in Hong Kong by Motilal Oswal capital Markets (Hong Kong) Private Limited, a licensed corporation (CE AYY-301) licensed and regulated by the Hong Kong Securities and Futures Commission (SFC)
pursuant to the Securities and Futures Ordinance (Chapter 571 of the Laws of Hong Kong) “SFO”. As per SEBI (Research Analyst Regulations) 2014 Motilal Oswal Securities (SEBI Reg No. INH000000412) has an agreement with
Motilal Oswal capital Markets (Hong Kong) Private Limited for distribution of research report in Kong Kong. This report is intended for distribution only to “Professional Investors” as defined in Part I of Schedule 1 to SFO. Any
investment or investment activity to which this document relates is only available to professional investor and will be engaged only with professional investors.”
Nothing here is an offer or solicitation of these securities, products and services in any jurisdiction where their offer or sale is not qualified or exempt from registration. The Indian Analyst(s) who compile this report is/are not located in
Hong Kong & are not conducting Research Analysis in Hong Kong.
For Hong Kong:
For Singapore
Motilal Oswal Capital Markets Singapore Pte Limited is acting as an exempt financial advisor under section 23(1)(f) of the Financial Advisers Act(FAA) read with regulation 17(1)(d) of the Financial Advisors Regulations and is a
subsidiary of Motilal Oswal Securities Limited in India. This research is distributed in Singapore by Motilal Oswal Capital Markets Singapore Pte Limited and it is only directed in Singapore to accredited investors, as defined in the
Financial Advisers Regulations and the Securities and Futures Act (Chapter 289), as amended from time to time.
In respect of any matter arising from or in connection with the research you could contact the following representatives of Motilal Oswal Capital Markets Singapore Pte Limited:
Kadambari Balachandran
Email : kadambari.balachandran@motilaloswal.com
Contact : (+65) 68189233 / 65249115
Office Address : 21 (Suite 31),16 Collyer Quay,Singapore 04931
30 January 2016
Motilal Oswal Tower, Level 9, Sayani Road, Prabhadevi, Mumbai 400 025
Phone: +91 22 3982 5500 E-mail: reports@motilaloswal.com
Motilal Oswal Securities Ltd
12