2 February 2016
2QFY16 Results Update | Sector: Cement
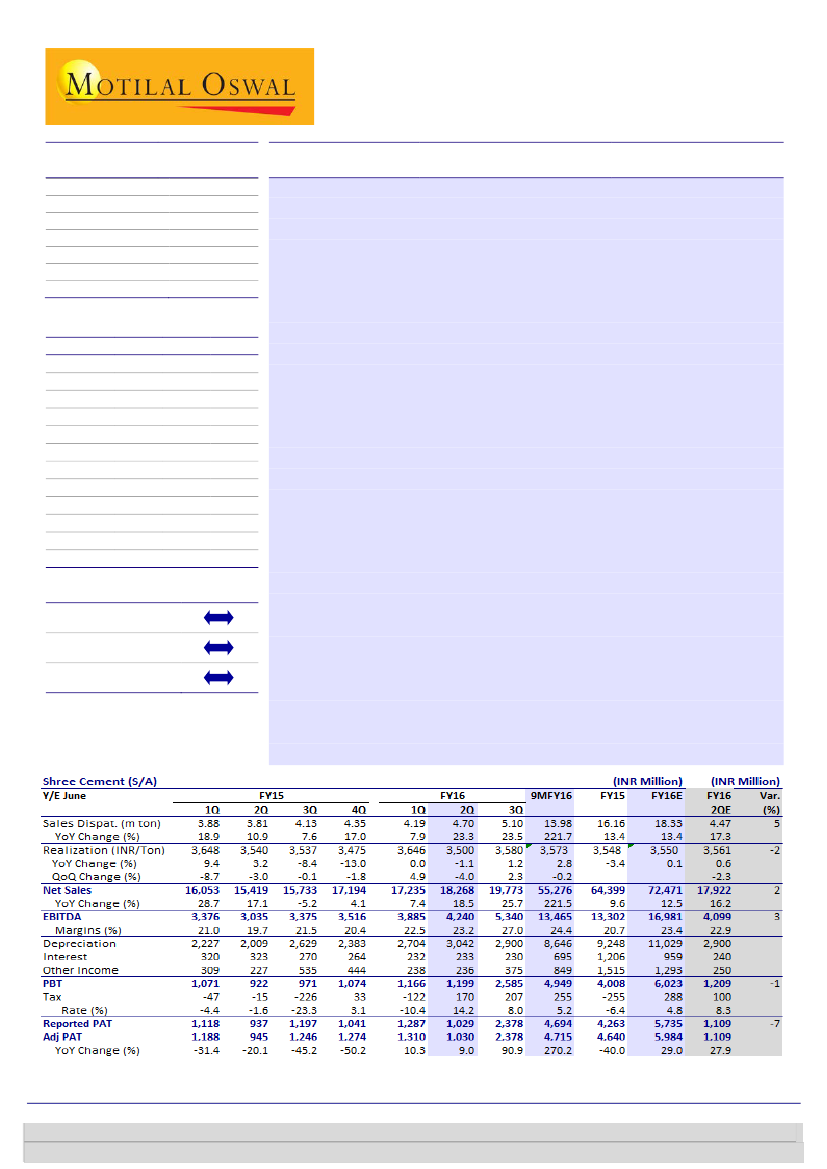
Shree Cement
Neutral
BSE SENSEX
24,539
Bloomberg
Equity Shares (m)
M.Cap.(INRb)/(USDb)
52-Week Range (INR)
1, 6, 12 Rel. Per (%)
12M Avg Val (INR M)
Free float (%)
S&P CNX
7,456
SRCM IN
14-quarter high growth amidst; Cost savings negates realization hit
34.8
14-quarter high growth amidst pricing dip:
SRCM’s 2QFY16 EBITDA stood in
361.4 / 5.3
line at INR4.2b, +40% YoY (est INR4.1b) led by strong volume growth and
13345 / 9350
duality of softening realization getting offset by cost savings. On the back east
-2/2/11
240
expansion, SRCM posted 23% YoY (+12% QoQ) growth in volume at 4.7mt (est
35.2
4.5mt), albeit dismal realizations (down 4% QoQ v/s est -2.5%) highlights
CMP:INR10,375 TP: INR11,634(12%)
Financials & Valuations (INR b)
Y/E June
2015
2016E 2017E
Net Sales
64.4
72.5
85.0
EBITDA
13.3
17.0
21.7
PAT
4.6
6.0
10.8
EPS (INR)
133.2
171.8
309.8
Gr. (%)
-40.0
29.0
80.3
BV/Sh (INR) 1,514.6 1,614.5 1,883.6
RoE (%)
9.3
11.0
17.7
RoCE (%)
9.4
11.6
18.2
P/E (x)
77.9
60.4
33.5
P/BV (x)
6.8
6.4
5.5
EV/EBITDA(x) 26.3
20.3
15.4
EV/Ton(USD) 211
193
186
Estimate change
TP change
Rating change
competitive intensity prevailing. Cement revenue was at INR16.5b, +22% YoY
(4% beat), while merchant power revenue stood at INR1.8b (est INR2b), led by
lower realizations of INR3.37/unit (-8% QoQ) and stable volume.
Cost savings negates realization hit, profitability in line:
EBITDA margin stood
at 23.2% (+0.7pp QoQ, +3.5pp YoY) despite dip in realizations. Cost/ton was
lower 4-5% QoQ/YoY led by (a) savings in energy (sharp decline in pet coke
price), (b) freight (lower lead distance, down -10% YoY), and (c) positive
operating leverage. Cement EBITDA stood at INR796 (flat QoQ, +11% YoY).
Power EBITDA stood below est with EBITDA/unit of INR0.93 (v/s INR1.1 QoQ)
Marginal cut in estimates:
Higher depreciation (UP grinding commission) and
tax (no MAT credit) led PAT at INR1.03b (est INR1.1b). We cut FY16 (9M)
EBITDA by 1-3% after factoring in lower pricing trends, higher volume (13% v/s
11% earlier in FY16) and lower energy and freight cost. It translates into
FY16/17E cement EBITDA/ton of INR808/INR941 (INR744 in FY15).
Valuation premium came off, maintain neutral:
The stock trades at
15.4x/10.9x EV/EBITDA on FY17/18E and EV of US$169/ton FY17E (adjusting
for Merchant Power assets), which is 5- 10% premium to UTCEM at various
valuation parameters. The premium valuation has contracted post recent
underperformance. While we consider SRCM as one of resilience bet to play
cement up cycle, we continue to maintain our neutral stance still we get
visibility on sectoral growth sustenance. We value SRCM at SOTP based TP of
INR11,600/share (EV at USD200/ton and 12.5x FY18E EV/EBITDA), 12% upside.
Investors are advised to refer through important disclosures made at the last page of the Research Report.
Motilal Oswal research is available on www.motilaloswal.com/Institutional-Equities, Bloomberg, Thomson Reuters, Factset and S&P Capital.
Sandipan Pal
(Sandipan.Pal@MotilalOswal.com); +91 22 3982 5436
Aashumi Mehta
(aashumi.mehta@motilaloswal.com);

Shree Cement
Exhibit 1: Strong volume, dismal realizations
Realization (INR/ton)
Dispatches (m ton)
3.8 3.7 3.9 3.8
3.4
4.1 4.3 4.2
4.7
Exhibit 2: Power realizations dip
Units Sold (m units)
Realization (INR/unit)
2.9
2.6 2.7
2.5
3.5
3.3 3.3
3.2
2.8
3.0 3.0
3.4
Source: Company, MOSL
Exhibit 3:
Margin sustained led by cost savings
EBITDA (INR m)
EBITDA (%)
Exhibit 4:
Trend in cement EBITDA (INR/ton)
EBITDA (INR/Ton)
Source: Company, MOSL
Exhibit 5:
Power EBITDA (INR/unit) posted strong boost
2.0
1.6
0.8
0.9
0.5
0.2 0.3
1.1
0.9 0.9
1.1
0.7
1.1 1.1
0.6
0.2
(0.0)
0.4
0.6
0.4
0.9
Source: Company, MOSL
2 February 2016
2

Shree Cement
Exhibit 6:
Cement business income statement (INR/ton)
Net Realization
Raw Material Cost
Staff Cost
Power & fuel
Freight & selling Exp
Other Exp
Total Exp
EBITDA
EBITDA Margin (%)
2QFY16
3,500
391
256
525
780
753
2,704
796
22.7
2QFY15
3,540
326
287
612
855
745
2,825
715
20.2
YoY (%)
-1
20
-11
-14
-9
1
-4
11
1QFY16
3,646
308
293
564
829
863
2,857
789
21.6
QoQ(%)
-4
27
-13
-7
-6
-13
-5
1
Source: Company, MOSL
Exhibit 7: Revised estimates
(INR B)
Net Sales
EBITDA
Net Profit
EPS (INR)
Rev
72
17
6
172
FY16E
Old
Chg (%)
72
0
17
-1
7
-10
192
-10
Rev
85
22
11
310
FY17E
Old
Chg (%)
86
-1
22
-3
11
-5
327
-5
FY87E
Rev
Old
Chg (%)
100
101
-1
29
29
-2
16
16
-4
447
464
-4
Source: Company, MOSL
Valuation premium came off; maintain neutral
SRCM is strongly placed to reap benefits of up-cycle with (1) high volume levers
(systematic capacity addition), (2) cost leadership, (3) healthy balance sheet
with ~INR16b of net cash, and (4) consistent growth capital from internal
accruals. It enjoys industry leading profitability and RoEs (~22% by FY18). Entry
into east offers geographical diversification, better market mix and profitability.
The company has established itself as most efficient cement players
commanding significant premium valuations in the cement pack due to quality
and certainty of (a) growth, (b) healthy capital efficiencies, and (c) strong
management prowess which ensure operational outperformance in future.
We factor in for 13% volume and 7% price CAGR over FY16-18, translating into
cement EBITDA/ton of INR941/INR1,181 in FY17/18 (v/s INR808 in FY16).
The stock trades at 15.4x/10.9x EV/EBITDA on FY17/18E and EV of US$169/ton
FY17E (adjusting for Merchant Power assets), which is 5- 10% premium to
UTCEM at various valuation parameters. The premium valuation has contracted
post recent underperformance.
While we consider SRCM as one of resilience bet to play cement up cycle, we
continue to maintain our neutral stance still we get visibility on sectoral growth
sustenance. We value SRCM at SOTP based TP of INR11,600/share (EV at
USD200/ton and 12.5x FY18E EV/EBITDA), aiding 12% upside.
Exhibit 8: Shree Cement - Sum of the parts valuations
INR M
Cement business
Merchant Power
Total EV
Less: Net Debt
Equity Value
Fair Value (INR/share)
EV/Ton at TP (USD)
Parameter
EV/EBITDA
DCF
Factor
12.5
@ 12% WACC
FY18
343,184
9,528
352,712
-52,577
405,289
11,634
200
Source: Company, MOSL
2 February 2016
3

Shree Cement
Exhibit 9: Steady growth in capacity aids volume levers
Capacity (mt)
94
88
94
85
78
Dispatch (mt)
90
92
81
69
72
83
Utilization (%)
88
59
53
Exhibit 10: Operating profitability superior to industry (INR)
Cement EBITDA/ton
Power EBITDA/ton
107
62
200
47
79
118
84
62
1,306 1,061 1,359 810 1,077 1,034 921 744 808 941 1,181
FY08 FY09 FY10 FY11 FY12 FY13 FY14 FY15 FY16EFY17EFY18E
Source: Company, MOSL
Exhibit 11: B/S strong to drive consistent growth from
internal accruals
30
10
-10
-30
-50
FY08
FY10
FY12
FY14
FY16E
FY18E
Net debt (INR b)
CWIP as % CE
DER (x)
0.8
0.4
0.0
-0.4
-0.8
Exhibit 12: Return ratio set to improve gradually with
volume recovery
80
60
40
20
0
FY08
FY10
FY12
FY14
FY16E
FY18E
RoE
RoCE
Source: Company, MOSL
Exhibit 13: Common Size Statement excluding Power sales (INR/ton)
Y/E June
Realization
Expenditure
RM Cost
Staff Cost
Power & Fuel
Freight
Other Expenses
Total Op cost
EBITDA
1Q
3,334
306
311
525
765
759
2,664
670
FY14
2Q
3Q
3,430
3,863
265
294
575
817
763
2,715
716
280
238
566
893
808
2,786
1,076
4QE
3,994
401
273
581
855
714
2,825
1,169
1Q
3,648
337
291
628
818
757
2,831
817
FY15
2Q
3,540
326
287
612
855
745
2,825
715
3Q
3,537
295
276
616
852
711
2,749
788
4Q
3,475
285
274
621
923
709
2,812
663
FY16
1Q
3,646
308
293
564
829
863
2,857
789
2Q
3,500
391
256
525
780
753
2,704
796
Source:MOSL, Company
2 February 2016
4

Shree Cement
Financials and Valuations
Income Statement
Y/E Mar
Net Sales
Change (%)
EBITDA
EBITDA Margin (%)
Depreciation
EBIT
Interest
Other Income
Extraordinary items
PBT
Tax
Tax Rate (%)
Min. Int. & Assoc. Share
Reported PAT
Adjusted PAT
Change (%)
2011
34,535
-4.9
8,848
25.6
6,758
2,091
1,753
1,251
-485
1,103
-994
-90.0
0
2,097
2,582
-63.6
2011
348
19,513
19,862
20,079
-723
39,218
42,713
28,752
13,961
5,000
11,965
17,756
4,042
1,082
4,987
7,644
9,463
6,635
2,828
8,293
39,218
2012
47,806
38.4
13,865
29.0
7,133
6,732
1,878
1,471
-41
6,284
649
10.3
0
5,635
5,671
119.7
2012
348
26,991
27,339
16,611
-697
43,253
50,564
35,886
14,678
1,500
25,352
17,499
5,033
1,811
4,590
6,065
15,776
13,822
1,954
1,723
43,253
2013
55,671
16.5
15,378
27.6
4,356
11,022
1,931
2,114
-11
11,194
1,155
10.3
0
10,040
10,049
77.2
2013
348
38,088
38,436
11,274
-938
48,773
56,895
40,242
16,653
2,500
22,033
19,478
5,305
3,147
3,694
7,333
11,891
10,841
1,050
7,587
48,773
2014
58,759
5.5
13,784
23.5
5,499
8,285
1,292
1,964
154
9,111
1,238
13.6
0
7,872
7,739
-23.0
2014
348
46,760
47,109
10,783
-1,429
56,463
66,764
45,741
21,023
8,500
22,444
19,892
8,098
2,966
1,593
7,236
15,396
14,209
1,186
4,496
56,463
2015
64,399
9.6
13,302
20.7
9,248
4,054
1,206
1,515
-355
4,008
-255
-6.4
0
4,263
4,640
-40.0
2015
348
52,416
52,764
8,200
-1,952
59,012
84,143
54,989
29,154
6,000
16,626
26,246
9,189
4,764
3,075
9,219
19,015
18,135
880
7,231
59,012
2016E
72,471
12.5
16,981
23.4
11,029
5,952
959
1,293
-262
6,023
288
4.8
0
5,735
5,984
29.0
2016E
348
55,895
56,243
8,200
-2,783
61,660
95,014
63,635
31,379
3,500
21,626
27,170
9,133
4,765
3,741
9,530
22,015
20,848
1,167
5,155
61,660
2017E
85,038
17.3
21,666
25.5
11,243
10,423
819
2,000
0
11,604
812
7.0
0
10,792
10,792
80.3
2017E
348
65,270
65,618
6,700
-3,711
68,606
100,514
74,878
25,636
7,000
21,626
39,221
10,018
5,126
13,593
10,484
24,877
23,298
1,579
14,345
68,606
(INR Million)
2018E
99,903
17.5
28,895
28.9
11,607
17,289
819
3,000
0
19,469
3,894
20.0
0
15,575
15,575
44.3
Balance Sheet
Y/E Mar
Share Capital
Reserves
Net Worth
Debt
Deferred Tax
Total Capital Employed
Gross Fixed Assets
Less: Acc Depreciation
Net Fixed Assets
Capital WIP
Investments
Current Assets
Inventory
Debtors
Cash & Bank
Loans & Adv, Others
Curr Liabs & Provns
Curr. Liabilities
Provisions
Net Current Assets
Total Assets
(INR Million)
2018E
348
79,226
79,574
5,200
-3,906
80,868
110,514
86,485
24,029
7,000
21,626
57,069
10,948
5,474
29,150
11,496
28,856
26,002
2,854
28,213
80,868
2 February 2016
5

Shree Cement
Financials and Valuations
Ratios
Y/E Mar
Basic (INR)
EPS
Cash EPS
Book Value
DPS
Payout (incl. Div. Tax.)
Valuation(x)
P/E
Cash P/E
Price / Book Value
EV/Sales
EV/EBITDA
Dividend Yield (%)
Profitability Ratios (%)
RoE
RoCE
Turnover Ratios (%)
Asset Turnover (x)
Debtors (No. of Days)
Inventory (No. of Days)
Creditors (No. of Days)
Leverage Ratios (%)
Net Debt/Equity (x)
2011
74.1
394.1
570.1
14.0
27.2
0.0
0.0
0.0
0.0
0.0
0.1
13.5
8.4
0.9
11
43
70
0.8
2011
8,848
1,251
-1,315
395
0
9,180
-8,525
655
3,958
0
-4,567
-482
-983
-1,753
-571
-3,789
823
4,164
4,987
2012
162.8
479.1
784.8
20.0
14.5
63.7
21.7
13.2
7.8
25.1
0.2
24.0
19.6
1.2
14
38
106
0.4
2012
13,865
1,471
6,173
-564
0
20,945
-4,350
16,594
-13,447
0
-17,798
2,617
-3,468
-1,878
-815
-3,544
-397
4,987
4,590
2013
288.5
441.3
1103.3
20.0
8.1
36.0
23.5
9.4
6.6
22.6
0.2
30.6
28.1
1.2
21
35
71
0.2
2013
15,378
2,104
-5,957
-2,198
0
9,326
-7,331
1,995
3,319
0
-4,012
1,867
-5,337
-1,931
-810
-6,211
-896
4,590
3,693
2014
222.2
427.5
1352.3
22.0
11.4
46.7
24.3
7.7
6.3
25.3
0.2
18.1
19.0
1.1
18
50
88
0.2
2014
13,784
2,118
990
-1,729
0
15,162
-15,869
-707
-411
0
-16,280
1,697
-491
-1,292
-897
-983
-2,101
3,694
1,592
2015
133.2
541.3
1514.6
24.0
22.8
77.9
19.2
6.8
5.7
26.3
0.2
9.3
9.4
1.1
27
52
103
0.1
2015
13,302
1,161
-1,253
-268
0
12,942
-14,879
-1,938
5,818
0
-9,062
2,364
-2,583
-1,206
-972
-2,398
1,482
1,593
3,075
2016E
171.8
641.6
1614.5
30.0
21.2
60.4
16.2
6.4
5.0
20.3
0.3
11.0
11.6
1.2
24
46
105
0.1
2016E
16,981
-3,110
2,922
-846
0
15,947
-8,371
7,576
-5,000
0
-13,371
0
0
-695
-1,214
-1,910
666
3,075
3,741
2017E
309.8
776.0
1883.6
35.0
13.1
33.5
13.4
5.5
4.2
15.4
0.3
17.7
18.2
1.3
22
43
100
-0.1
2017E
21,666
2,000
663
-1,741
0
22,589
-9,000
13,589
0
0
-9,000
0
-1,500
-819
-1,417
-3,736
9,852
3,741
13,593
2018E
447.1
901.4
2284.2
40.0
10.4
23.2
11.5
4.5
3.4
10.9
0.4
21.5
25.8
1.3
20
40
95
-0.3
Cash Flow Statement
Y/E Mar
Adjusted EBITDA
Non cash opr. exp (inc)
(Inc)/Dec in Wkg. Cap.
Tax Paid
Other operating activities
CF from Op. Activity
(Inc)/Dec in FA & CWIP
Free cash flows
(Pur)/Sale of Invt
Others
CF from Inv. Activity
Inc/(Dec) in Net Worth
Inc / (Dec) in Debt
Interest Paid
Divd Paid (incl Tax) & Others
CF from Fin. Activity
Inc/(Dec) in Cash
Add: Opening Balance
Closing Balance
(INR Million)
2018E
28,895
3,000
1,689
-4,089
0
29,496
-10,000
19,496
0
0
-10,000
0
-1,500
-819
-1,619
-3,939
15,557
13,593
29,150
2 February 2016
6

Shree Cement
Corporate profile
Shree Cement is the largest single-location
integrated cement plant in North India, with an
installed capacity of 13m ton. It is strategically
located in central Rajasthan from where it can cater
to the entire Rajasthan market as well as Delhi and
Haryana, with economic logistics cost. It is a
significant player in North India. Over the years, it
has established a reputation as one of the world’s
most efficient cement manufacturers.
Company description
Exhibit 1: Sensex rebased
Source: MOSL/Bloomberg
Exhibit 2: Shareholding pattern (%)
Promoter
DII
FII
Others
Sep-15
64.8
4.9
13.6
16.7
Jun-15
64.8
4.7
13.5
17.0
Sep-14
64.8
5.7
11.0
18.5
Exhibit 3: Top holders
Holder Name
FLT LIMITED
CARTICA CAPITAL LTD
UTI-Opportunities fund, UTI- Infrastructure
fund, UTI - Equity fund, UTI - Childrens
career bal.Plan
PINEBRIDGE INVESTMENTS GF MAURITIUS
LIMITED
NA
% Holding
10.3
2.1
1.6
1.4
0.0
Source: Capitaline
Note: FII Includes depository receipts
Source: Capitaline
Exhibit 4: Top management
Name
B G Bangur
H M Bangur
S S Khandelwal
Designation
Chairman
Managing Director
Company Secretary
Exhibit 5: Directors
Name
Leena Srivastava
O P Setia
RAMAKANT SHARMA
Shreekant Somany
Prashant Bangur
Name
Nitin Desai
R L Gaggar
Sanjiv Krishnaji Shelgikar
Y K Alagh
Source: Capitaline
Exhibit 6: Auditors
Name
B R Maheswari & Co
K G Goyal & Associates
P K Ajmera & Co
P Pincha & Associates
Type
Statutory
Statutory
Internal
Secretarial Audit
Source: Capitaline
Exhibit 7: MOSL forecast v/s consensus
EPS
(INR)
FY16
FY17
FY18
MOSL
forecast
199.4
327.0
464.0
Consensus
forecast
205.1
398.2
567.4
Variation (%)
-2.8
-17.9
-18.2
Source: Bloomberg
2 February 2016
7

Disclosures
This document has been prepared by Motilal Oswal Securities Limited (hereinafter referred to as Most) to provide information about the company(ies) and/sector(s), if any, covered in the report and may be distributed by it and/or its
Shree Cement
affiliated company(ies). This report is for personal information of the selected recipient/s and does not construe to be any investment, legal or taxation advice to you. This research report does not constitute an offer, invitation or
inducement to invest in securities or other investments and Motilal Oswal Securities Limited (hereinafter referred as MOSt) is not soliciting any action based upon it. This report is not for public distribution and has been furnished to
you solely for your general information and should not be reproduced or redistributed to any other person in any form. This report does not constitute a personal recommendation or take into account the particular investment
objectives, financial situations, or needs of individual clients. Before acting on any advice or recommendation in this material, investors should consider whether it is suitable for their particular circumstances and, if necessary, seek
professional advice. The price and value of the investments referred to in this material and the income from them may go down as well as up, and investors may realize losses on any investments. Past performance is not a guide for
future performance, future returns are not guaranteed and a loss of original capital may occur.
MOSt and its affiliates are a full-service, integrated investment banking, investment management, brokerage and financing group. We and our affiliates have investment banking and other business relationships with a some
companies covered by our Research Department. Our research professionals may provide input into our investment banking and other business selection processes. Investors should assume that MOSt and/or its affiliates are
seeking or will seek investment banking or other business from the company or companies that are the subject of this material and that the research professionals who were involved in preparing this material may educate investors
on investments in such business. The research professionals responsible for the preparation of this document may interact with trading desk personnel, sales personnel and other parties for the purpose of gathering, applying and
interpreting information. Our research professionals are paid on the profitability of MOSt which may include earnings from investment banking and other business.
MOSt generally prohibits its analysts, persons reporting to analysts, and members of their households from maintaining a financial interest in the securities or derivatives of any companies that the analysts cover. Additionally, MOSt
generally prohibits its analysts and persons reporting to analysts from serving as an officer, director, or advisory board member of any companies that the analysts cover. Our salespeople, traders, and other professionals or affiliates
may provide oral or written market commentary or trading strategies to our clients that reflect opinions that are contrary to the opinions expressed herein, and our proprietary trading and investing businesses may make investment
decisions that are inconsistent with the recommendations expressed herein. In reviewing these materials, you should be aware that any or all of the foregoing among other things, may give rise to real or potential conflicts of interest.
MOSt and its affiliated company(ies), their directors and employees and their relatives may; (a) from time to time, have a long or short position in, act as principal in, and buy or sell the securities or derivatives thereof of companies
mentioned herein. (b) be engaged in any other transaction involving such securities and earn brokerage or other compensation or act as a market maker in the financial instruments of the company(ies) discussed herein or act as an
advisor or lender/borrower to such company(ies) or may have any other potential conflict of interests with respect to any recommendation and other related information and opinions.; however the same shall have no bearing
whatsoever on the specific recommendations made by the analyst(s), as the recommendations made by the analyst(s) are completely independent of the views of the affiliates of MOSt even though there might exist an inherent
conflict of interest in some of the stocks mentioned in the research report
Reports based on technical and derivative analysis center on studying charts company's price movement, outstanding positions and trading volume, as opposed to focusing on a company's fundamentals and, as such, may not match
with a report on a company's fundamental analysis. In addition MOST has different business segments / Divisions with independent research separated by Chinese walls catering to different set of customers having various
objectives, risk profiles, investment horizon, etc, and therefore may at times have different contrary views on stocks sectors and markets.
Unauthorized disclosure, use, dissemination or copying (either whole or partial) of this information, is prohibited. The person accessing this information specifically agrees to exempt MOSt or any of its affiliates or employees from, any
and all responsibility/liability arising from such misuse and agrees not to hold MOSt or any of its affiliates or employees responsible for any such misuse and further agrees to hold MOSt or any of its affiliates or employees free and
harmless from all losses, costs, damages, expenses that may be suffered by the person accessing this information due to any errors and delays. The information contained herein is based on publicly available data or other sources
believed to be reliable. Any statements contained in this report attributed to a third party represent MOSt’s interpretation of the data, information and/or opinions provided by that third party either publicly or through a subscription
service, and such use and interpretation have not been reviewed by the third party. This Report is not intended to be a complete statement or summary of the securities, markets or developments referred to in the document. While we
would endeavor to update the information herein on reasonable basis, MOSt and/or its affiliates are under no obligation to update the information. Also there may be regulatory, compliance, or other reasons that may prevent MOSt
and/or its affiliates from doing so. MOSt or any of its affiliates or employees shall not be in any way responsible and liable for any loss or damage that may arise to any person from any inadvertent error in the information contained in
this report. MOSt or any of its affiliates or employees do not provide, at any time, any express or implied warranty of any kind, regarding any matter pertaining to this report, including without limitation the implied warranties of
merchantability, fitness for a particular purpose, and non-infringement. The recipients of this report should rely on their own investigations.
This report is intended for distribution to institutional investors. Recipients who are not institutional investors should seek advice of their independent financial advisor prior to taking any investment decision based on this report or for
any necessary explanation of its contents.
Most and it’s associates may have managed or co-managed public offering of securities, may have received compensation for investment banking or merchant banking or brokerage services, may have received any compensation for
products or services other than investment banking or merchant banking or brokerage services from the subject company in the past 12 months.
Most and it’s associates have not received any compensation or other benefits from the subject company or third party in connection with the research report.
Subject Company may have been a client of Most or its associates during twelve months preceding the date of distribution of the research report
MOSt and/or its affiliates and/or employees may have interests/positions, financial or otherwise of over 1 % at the end of the month immediately preceding the date of publication of the research in the securities mentioned in this
report. To enhance transparency, MOSt has incorporated a Disclosure of Interest Statement in this document. This should, however, not be treated as endorsement of the views expressed in the report.
Motilal Oswal Securities Limited is registered as a Research Analyst under SEBI (Research Analyst) Regulations, 2014. SEBI Reg. No. INH000000412
There are no material disciplinary action that been taken by any regulatory authority impacting equity research analysis activities
The views expressed in this research report accurately reflect the personal views of the analyst(s) about the subject securities or issues, and no part of the compensation of the research analyst(s) was, is, or will be directly or
indirectly related to the specific recommendations and views expressed by research analyst(s) in this report. The research analysts, strategists, or research associates principally responsible for preparation of MOSt research receive
compensation based upon various factors, including quality of research, investor client feedback, stock picking, competitive factors and firm revenues
Analyst Certification
Disclosure of Interest Statement
Analyst ownership of the stock
Served as an officer, director or employee
SHREE CEMENT
No
No
A graph of daily closing prices of securities is available at www.nseindia.com and http://economictimes.indiatimes.com/markets/stocks/stock-quotes
Regional Disclosures (outside India)
For U.S.
This report is not directed or intended for distribution to or use by any person or entity resident in a state, country or any jurisdiction, where such distribution, publication, availability or use would be contrary to law, regulation or which
would subject MOSt & its group companies to registration or licensing requirements within such jurisdictions.
Motilal Oswal Securities Limited (MOSL) is not a registered broker - dealer under the U.S. Securities Exchange Act of 1934, as amended (the"1934 act") and under applicable state laws in the United States. In addition MOSL is not a
registered investment adviser under the U.S. Investment Advisers Act of 1940, as amended (the "Advisers Act" and together with the 1934 Act, the "Acts), and under applicable state laws in the United States. Accordingly, in the
absence of specific exemption under the Acts, any brokerage and investment services provided by MOSL, including the products and services described herein are not available to or intended for U.S. persons.
This report is intended for distribution only to "Major Institutional Investors" as defined by Rule 15a-6(b)(4) of the Exchange Act and interpretations thereof by SEC (henceforth referred to as "major institutional investors"). This
document must not be acted on or relied on by persons who are not major institutional investors. Any investment or investment activity to which this document relates is only available to major institutional investors and will be
engaged in only with major institutional investors. In reliance on the exemption from registration provided by Rule 15a-6 of the U.S. Securities Exchange Act of 1934, as amended (the "Exchange Act") and interpretations thereof by
the U.S. Securities and Exchange Commission ("SEC") in order to conduct business with Institutional Investors based in the U.S., MOSL has entered into a chaperoning agreement with a U.S. registered broker-dealer, Motilal Oswal
Securities International Private Limited. ("MOSIPL"). Any business interaction pursuant to this report will have to be executed within the provisions of this chaperoning agreement.
The Research Analysts contributing to the report may not be registered /qualified as research analyst with FINRA. Such research analyst may not be associated persons of the U.S. registered broker-dealer, MOSIPL, and therefore,
may not be subject to NASD rule 2711 and NYSE Rule 472 restrictions on communication with a subject company, public appearances and trading securities held by a research analyst account.
For Hong Kong:
This report is distributed in Hong Kong by Motilal Oswal capital Markets (Hong Kong) Private Limited, a licensed corporation (CE AYY-301) licensed and regulated by the Hong Kong Securities and Futures Commission (SFC)
pursuant to the Securities and Futures Ordinance (Chapter 571 of the Laws of Hong Kong) “SFO”. As per SEBI (Research Analyst Regulations) 2014 Motilal Oswal Securities (SEBI Reg No. INH000000412) has an agreement with
Motilal Oswal capital Markets (Hong Kong) Private Limited for distribution of research report in Kong Kong. This report is intended for distribution only to “Professional Investors” as defined in Part I of Schedule 1 to SFO. Any
investment or investment activity to which this document relates is only available to professional investor and will be engaged only with professional investors.”
Nothing here is an offer or solicitation of these securities, products and services in any jurisdiction where their offer or sale is not qualified or exempt from registration. The Indian Analyst(s) who compile this report is/are not located in
Hong Kong & are not conducting Research Analysis in Hong Kong.
Motilal Oswal Capital Markets Singapore Pte Limited is acting as an exempt financial advisor under section 23(1)(f) of the Financial Advisers Act(FAA) read with regulation 17(1)(d) of the Financial Advisors Regulations and is a
subsidiary of Motilal Oswal Securities Limited in India. This research is distributed in Singapore by Motilal Oswal Capital Markets Singapore Pte Limited and it is only directed in Singapore to accredited investors, as defined in the
Financial Advisers Regulations and the Securities and Futures Act (Chapter 289), as amended from time to time.
In respect of any matter arising from or in connection with the research you could contact the following representatives of Motilal Oswal Capital Markets Singapore Pte Limited:
Kadambari Balachandran
Email : kadambari.balachandran@motilaloswal.com
Contact : (+65) 68189233 / 65249115
Office Address : 21 (Suite 31),16 Collyer Quay,Singapore 04931
For Singapore
2 February 2016
Motilal Oswal Tower, Level 9, Sayani Road, Prabhadevi, Mumbai 400 025
Phone: +91 22 3982 5500 E-mail: reports@motilaloswal.com
Motilal Oswal Securities Ltd
8