Amara Raja Batteries
BSE SENSEX
24,539
Bloomberg
Equity Shares (m)
M.Cap.(INRb)/(USDb)
52-Week Range (INR)
1, 6, 12 Rel. Per (%)
Avg Val, INRm/ Vol m
Free float (%)
S&P CNX
7,456
AMRJ IN
170.8
147.1 / 2.2
1132 / 773
5/1/13
265
47.9
2 February 2016
3QFY16 Results Update | Sector: Automobiles
CMP: INR861
TP: INR1,100 (+28%)
Buy
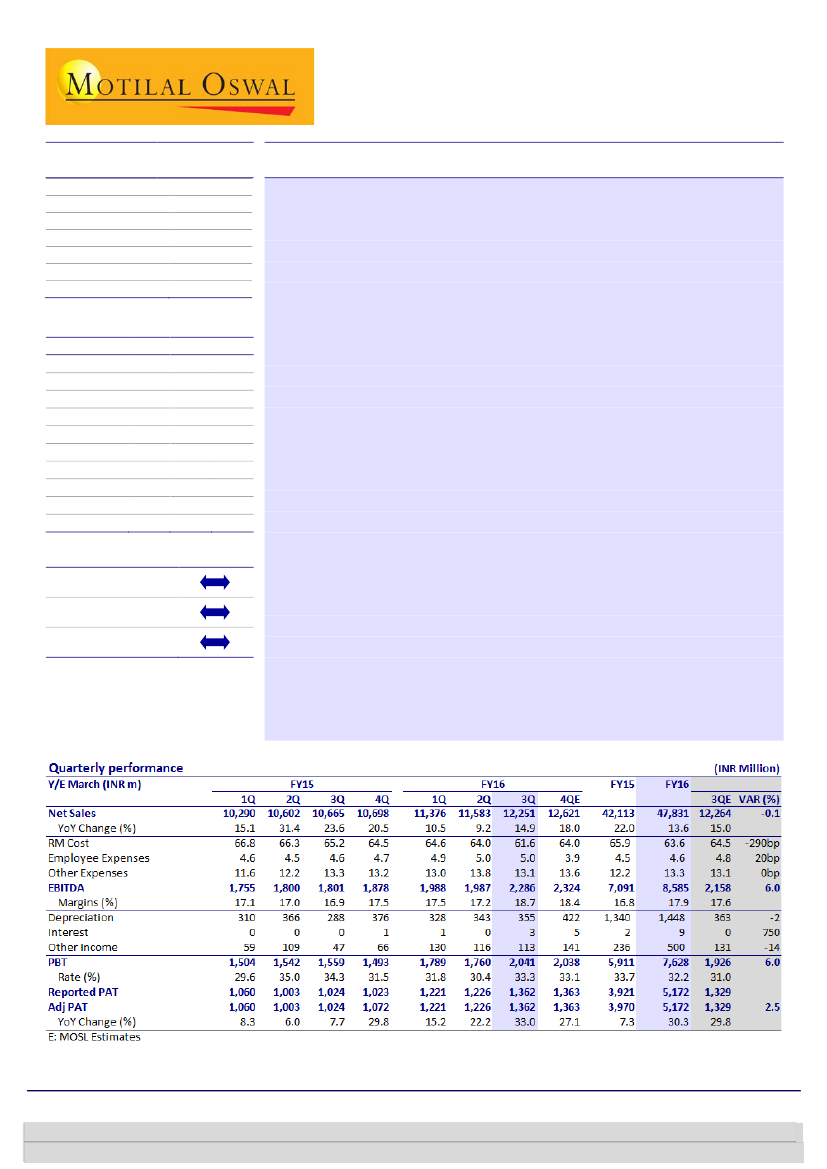
In-line; Highest ever EBITDA margins (18.7% v/s est 17.6%) off-set by
higher taxes
Net sales grew 15% YoY (+6% QoQ) to INR12.25b (in-line), driven by strong
growth in 4W replacement segment (driven by new capacities) and double digit
growth in the industrial segment.
EBITDA margins improved 180bp YoY (+150bp QoQ) to 18.7%, translating into
EBITDA growth of ~27% YoY (+15% QoQ).
RM Cost declined 240bp QoQ (-360bp YoY) to 61.6%, benefitting from lag
impact of ~9% correction in spot lead prices in 2QFY16. However, higher other
expenses (+150bp QoQ) due to higher marketing expense.
However, higher tax rate at 33.3% restricted adj. PAT to INR1.36b (v/s est
~INR1.33b) up 33% YoY (+11% QoQ).
Takeaways from Press Release:
a) Significant investment in brand building was
initiated during 3QFY16, driving further market share gains in aftermarket business
in both 2W and 4W. b) It has started making deeper penetration in the domain of
the unorganized sector. c) Ramping up of new capacities is faster than expected,
enabling it to plan further capacity expansion which would be finalized by March
2016. d) New tubular battery plant is expected to commission operations by end
4QFY16, which would reduce dependence on trading operations in tubular
batteries. e) With improving power situation in the country, it has redesigned its
tubular battery plant making it fungible to produce products for different
applications. It is evaluating new technologies in energy storage space through
which it is realigning its business strategy.
Valuation and view:
We will review our estimates post interaction with
management, however, we see limited change on our estimates. The stock trades
at 21.4x/17.6x FY17/18 EPS. Maintain Buy with a TP of ~INR1,100 (~22.5x FY18E
EPS).
Financials & Valuations (INR b)
Y/E Mar
2015 2016E 2017E
Net Sales
42.1
47.8
56.5
EBITDA
7.1
8.6
10.5
PAT
4.2
5.2
6.9
EPS (INR)
24.3
30.3
40.3
Gr. (%)
12.3
24.4
33.3
BV/Sh (INR)
99.5 135.2 182.9
RoE (%)
27.2
25.8
25.4
RoCE (%)
37.6
36.1
33.6
P/E (x)
35.4
28.5
21.4
P/BV (x)
8.7
6.4
4.7
Estimate change
TP change
Rating change
Jinesh Gandhi
(Jinesh@MotilalOswal.com); +91 22 3982 5416
Investors are advised to refer through important disclosures made at the last page of the Research Report.
Motilal Oswal research is available on www.motilaloswal.com/Institutional-Equities, Bloomberg, Thomson Reuters, Factset and S&P Capital.