5 February 2016
Q3FY16 Results Update | Sector: Technology
Mphasis
Neutral
BSE SENSEX
24,617
Bloomberg
Equity Shares (m)
M.Cap.(INRb)/(USDb)
52-Week Range (INR)
1, 6, 12 Rel. Per (%)
Avg Val, (INR m)
Free float (%)
S&P CNX
7,489
MPHL IN
210.2
92.4 / 1.4
534/335
-7/16/39
97
39.5
CMP: INR439
TP: INR520(+18%)
The leaking bucket continues to hurt
Delivering in the focus areas, but Digital Risk to languish:
MPHL reported
revenue decline of 3.4% QoQ to USD229m. Direct International segment grew
2.5% QoQ CC, continuing the momentum in its focus area. LTM deal TCV of
USD309m lends visibility of above-industry growth in 2/3rd of the business.
Revenue in Digital Risk however was flat at ~USD40m. This is expected to head
to its foundational size of ~USD30m run-rate over the next two quarters
Margins in-line with estimate:
EBIT margin declined by 70bp QoQ to 13.2%, in
line with our estimate of 13.3%. The impact of annual salary hike, furloughs
and Chennai was countered by growth in the Direct international business and
better revenue mix (with the sale of domestic BPO business). The management
maintained its guided EBIT margin range of 13-15% for FY17.
Improvement in overall revenue mix:
HP channel declined by 11% QoQ and
now constitutes to 24% of total revenue (35% in the previous year). The
revenue decline was also led by the selling of MPHL’s domestic BPO business.
With increasing share of Direct International revenue, marked improvement
can be expected in the company’s revenue mix and margin profile.
Valuation and view:
We expect revenue CAGR of 6.6% and EPS CAGR of 10.6%
over FY16-18E. Our estimates have been revised downwards by 5.5/6.6% for
FY17/18E given the accelerating decline in HP and shrinkage anticipated in
Digital Risk. While valuations at 11.4x/10.4x FY17E/18E are at a steep discount
to peers (particularly after factoring the cash balance), overall revenue growth
improvement is imperative to bridging the same. We maintain our target price
to INR520 discounting forward operating PAT by 11x added to net cash on
book of INR140/share (compared to INR112 at present).
Neutral.
Financials & Valuations (INR b)
Y/E Mar
2015 2016E 2017E
Net Sales
57.9
60.9
64.4
EBITDA
8.7
9.0
10.2
PAT
6.8
7.3
8.1
EPS (INR)
32.3
34.6
38.5
Gr. (%)
-8.6
7.3
11.4
BV/Sh (INR)
260.8 277.1 290.4
RoE (%)
12.8
12.9
13.6
RoCE (%)
13.1
13.3
14.6
P/E (x)
13.6
12.7
11.4
P/BV (x)
1.7
1.6
1.5
Estimate change
TP change
Rating change
5-7%
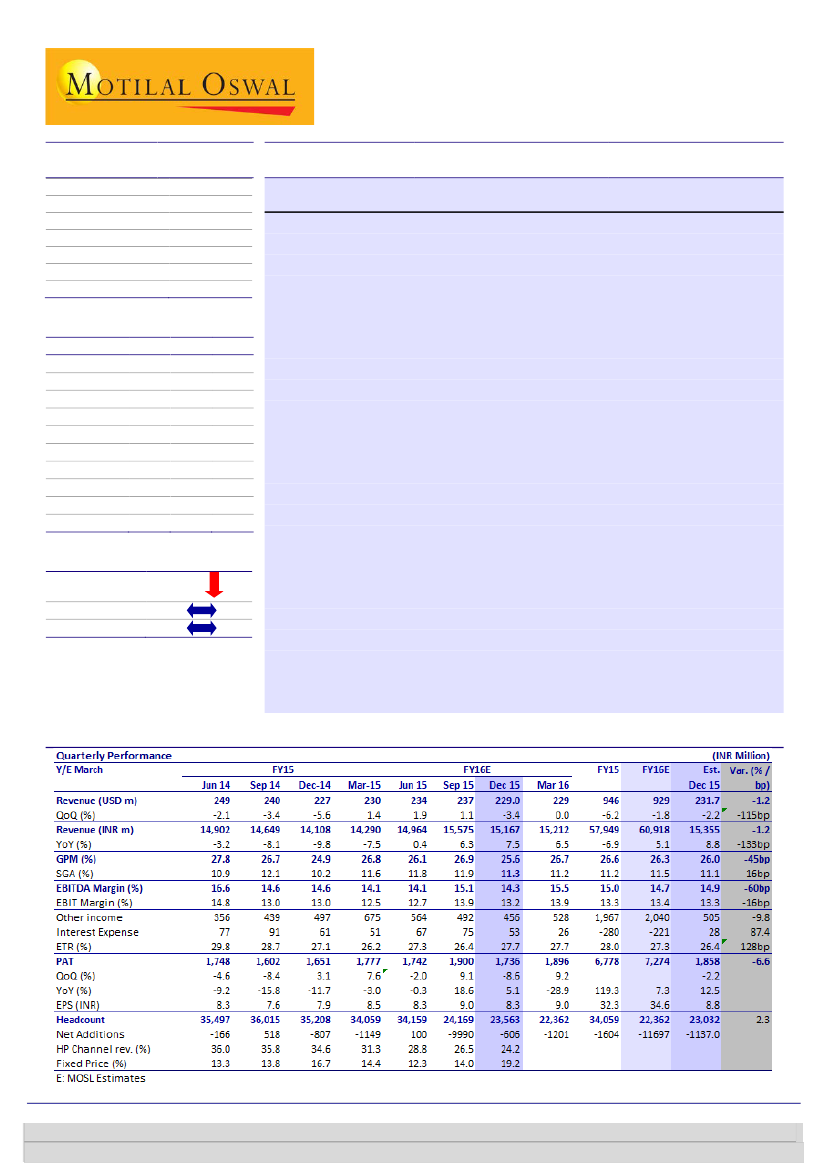
Quarterly Performance (Consolidated)
Ashish Chopra
(Ashish.Chopra@MotilalOswal.com); +91 22 3982 5424
Sagar Lele
(Sagar.Lele@MotilalOswal.com); +91 22 3982 5585
Investors are advised to refer through important disclosures made at the last page of the Research Report.
Motilal Oswal research is available on www.motilaloswal.com/Institutional-Equities, Bloomberg, Thomson Reuters, Factset and S&P Capital.

Mphasis
Revenues: Healthy growth in the direct international business
MPHL’s 3QFY16 reported revenue decline of 3.4% QoQ to USD229m. The
decline stemmed out of: [1] The absence of two months of domestic BPO
revenue post the sale of the business in the previous quarter, and [2] 11% QoQ
decline in HP channel. Additionally, furloughs and Chennai floods negatively
impacted revenue growth during the quarter.
The Direct International business grew by 3.1% QoQ and continued the
momentum seen over the last four quarters. The company has won USD230m of
new deals in this area and that provides for good visibility for sustenance of
traction.
Digital Risk had been leading overall revenue growth for the last three quarters
because of strong deal wins. However, the segment saw flat revenue growth
during 3Q landing at a run-rate of ~USD40m.
HP Channel declined 11% QoQ in dollar terms to USD56m. The management’s
outlook remains of continued decline for now, with little visibility of a
turnaround anytime soon.
Exhibit 1: Revenue decline led by HP channel and domestic BPO business
Revenue (USD m)
263
11.0
172
1.0
-4.5
-2.1
-1.9
1.1
-3.1
-4.2
-5.4
0.8
265
260
255
250
Growth (%)
237
239
226
228
234
237
229
2.7
1.1
-3.4
Mar 14*: 2M quarter, Jun-14 growth number normalized for comparison Source: MOSL, Company
3QFY16 Profitability: Margins impacted by wage hike/furloughs/Chennai
EBIT margin declined by 70bp during the quarter to 13.2%, in line with our
estimate of 13.3%.
Gross margin was 25.6%, -135bp QoQ, below our estimate of 26%. SGA was
higher at 11.3%, v/s estimate of 11.1%.
While margins were negatively impacted by annual wage hikes, furloughs and
shutdown because of Chennai, the growth seen in the direct international
business and better revenue mix resulting out of the hiving off of the domestic
BPO business led to lesser negative impact.
PAT declined by 8.6% QoQ to INR1.7b, compared to our estimate of INR1.86b,
on account of revenue miss, lower other income, higher interest expense and
higher effective tax rate.
5 February 2016
2

Mphasis
Exhibit 2: Margins aided by better revenue mix
EBIT Margin (%)
15.5
14.7
15.8
15.3
15.0
15.1
14.8
S&M as % of Sales
13.0
7.9
5.2
13.0
12.7
6.6
13.9
6.2
13.2
6.1
12.5
5.9
6.0
4.9
5.1
5.1
6.0
6.4
5.9
Source: MOSL, Company
Takeaways from Management Commentary
USD61m TCV deals signed:
MPHL has announced USD61m TCV of deal wins
during the quarter. The entire amount corresponds to new deal wins, and
doesn’t include any renewals. Of the total deal wins during the quarter, 46% was
contributed by MPHL’s focus areas of IMS, AMS, Digital and GRC. This took the
total LTM deal wins to USD309m; which should help grow the direct
international business faster than the market in FY17.
Digital Risk to hurt:
After three consecutive quarters of strong growth in Digital
Risk, the business turned flat during 3Q. On account of a large project being
executed in this quarter, revenue is expected to decline in 4Q. Digital Risk is
expected to head back towards its foundational run-rate of ~USD30m.
Direct International revenues to grow above industry in FY17:
MPHL expects to
grow its Direct International business to outgrow industry average in FY17. The
revenue growth momentum, deal wins and pipeline all drive confidence towards
that end.
Target margin band maintained:
With the domestic BPO business off the
portfolio, and higher incremental revenue from the Direct International
business, the company has been seeing a better revenue mix. This leads to
confidence of maintaining its EBIT margin guidance of 13-15%. While the
management aspires to set its long term EBIT margin in the range of 14-16%,
more clarity on execution and time frames will emerge at the end of next
quarter.
Exhibit 3: HP revenues now at 24% of total revenue
HP Channel
48
Direct Channel
34.2
69
71
73
76
42.5
Digital Risk Rev. (USD m)
46.3 45.5
29.6
38.0
34.0
22.4
38.0 40.8 39.9
54
59
60
63
64
64
64
65
30.8
52
46
41
40
37
36
36
36
35
31
29
27
24
Mar 14*: 2 Month quarter
Source: Company, MOSL
5 February 2016
3

Mphasis
Change in estimates
Our revenue estimates for FY17/18 have been revised downwards by 4.4% and
4.1% respectively. This is to factor in accelerating decline in HP revenue and the
decline expected in Digital Risk.
We expect EBIT margin of 14.3% for FY17, which is a tad higher than the mid-
point of MPHL's guided range of 13-15%. We expect this to further improve to
14.6% in FY18 resulting out of continued improvement of revenue mix.
However, we have cut our estimates slightly owing to some expected pressure
as Digital Risk revenue declines.
Consequently, our EPS estimates for FY17E and FY18E have moved lower by
5.5% and 6.6% respectively.
Exhibit 4: Change in estimates
Revised
FY16E FY17E
65.3
67.0
929
963
13.4
14.3
34.6
38.5
FY18E
69.0
1,057
14.6
42.3
FY16E
65.2
937
13.5
35.5
Earlier
FY17E
67.0
1,007
14.7
40.8
FY18E
69.0
1,102
15.0
45.3
FY16E
0.1%
-0.8%
-4bp
-2.6%
Change
FY17E
0.0%
-4.4%
-45bp
-5.5%
FY18E
0.0%
-4.1%
-47bp
-6.6%
INR/USD
USD Revenue - m
EBIT Margin (%)
EPS - INR
Source: MOSL, Company
Valuation and view
Our FY17 revenue estimate stands at USD963m compares with FY13 (YE
October) annual revenues of USD1,025m. Revenues from the HP channel have
posted a decline in 18 of the last 20 quarters and now constitutes to ~24% of
total revenues. The contribution of the HP channel has significantly reduced in
the portfolio, and the company has laid its focus on the direct international
channel, which it aims to grow above industry average. However, the decline
has been decelerating even when the base has reduced.
With strong deal wins, and the hive-off of the domestic BPO business, we
estimate MPHL to stem the decline in revenues and post growth at a CAGR of
6.6% over FY16-18E. Revenue growth confidence would be the single most
important factor for a re-rating. However, with uneven growth seen in Digital
Risk since its acquisition, consistency yet seems to be lacking. While valuations
at 11.4x/10.4x FY17E/18E are much discounted to peers (particularly after
factoring the Cash Balance), the rate of decline within HP channel remains a risk.
With the improved revenue mix, MPHL has significant scope to improve its
margin profile. Although it has maintained its EBIT margin guidance of 13-15%
for now, it can potentially move higher with the necessary levers in place, and
with sustained momentum in its Direct International business.
Impressive execution in Direct International business lends visibility of above-
industry growth in 2/3
rd
of MPHL’s business. Our target price of INR520
discounts forward operating PAT by 11x, added to expected net cash of
INR140/share (compared to current cash of INR112/share). Reprieve in HP
channel could drive some positive surprise on the top-line performance.
5 February 2016
4

Mphasis
Key Triggers
Reduction/stoppage of decline in the HP channel
Momentum gain in Direct International channel
Pick up in quarterly deals TCV
Key risks
Continued volatility in Direct Channel emerging markets
Failure to grow Direct International channel faster than industry growth
Volatility in Digital Risk
Exhibit 5: MPHL 1-year forward PE chart
53
41
29
17
5
12.7
6.4
15.7
13.8
4.0
0.0
2.9
1.5
3.5
1.7
PE (x)
Median(x)
Peak(x)
Min(x)
Avg(x)
48.2
Exhibit 6: MPHL 1-year forward PB chart
12.0
8.0
PB (x)
Median(x)
Peak(x)
Min(x)
Avg(x)
9.8
Source: Company, MOSL
Exhibit 7: Comparative valuation
Company
Mphasis
Mindtree
KPIT Tech
Hexaware
NIIT Tech
Persistent Sys.
Mkt cap Rating
(USD b)
1.4 Neutral
1.9 Neutral
0.4 Neutral
1.1 Neutral
0.5 Neutral
0.8 Neutral
TP
(INR)
520
1600
165
250
610
700
Upside
(%)
18.2
4.4
20.4
1.6
15.3
9.0
EPS (INR)
FY17E
FY18E
38.5
42.3
89.2
110.4
14.9
17.3
15.5
16.2
35.5
38.2
43.3
51.7
P/E (x)
FY17E
FY18E
11.4
10.4
17.2
13.9
9.2
7.9
15.9
15.1
14.9
13.9
14.8
12.4
RoE (%)
FY16-18E CAGR (%)
FY17E
FY18E USD rev.
EPS
13.6
14.2
6.6
10.6
28.3
28.6
17.7
23.0
17.1
16.7
6.6
12.8
31.0
30.3
14.7
10.5
18.5
18.0
7.8
7.3
20.2
22.0
16.4
17.3
Source: Company, MOSL
5 February 2016
5

Mphasis
Story in charts
Exhibit 8: HP Revenues have been declining rapidly…
HP Revenues
-5.9
65.9
-13.8
-17.0
-19.9
777
FY10
731
FY11
586
FY12
-22.4
455
FY13
157
5MFY14
325
FY15
34.1
FY11
43.5
55.6
63.2
65.5
56.5
% Change
Exhibit 9: … Now compounded with volatility in digital risk
Direct Channel (%)
HP Channel (%)
36.8
34.5
44.4
FY12
FY13
5MFY14
FY15
5MFY14* comparison normalized to be comparable
Exhibit 10: India revenue reduced further after sale of BPO
operations
India Revenue
18.6 19.8
7.0
-6.5
-19.5
-28.9
3.4
-10.4
% Change
21.4
-1.1 -0.5 1.7
-24.3
Exhibit 11: … and portfolio issues have dragged EPS lower
year after year
EPS
12.5
-0.1
-4.8
-19.0
43.2
48.6
39.4
37.5
35.3
14.7
32.3
-5.8
-8.6
% Change
1,728
1,229 989 925 1,097 876 1,359
1,218
1,479
1,462
1,455
1,480
1,120
5MFY14* comparison normalized to be comparable
Exhibit 12: 13-15% target EBIT margin band
EBIT Margin (%)
4.6
5.4
5.2
6.1
S&M (%)
6.2
6.2
5.9
5.8
Exhibit 13: Digital Risk revenues have rebound sharply;
outlook bleak again
Digital Risk Rev. (USD m)
42.5 46.3 45.5
29.6
38.0
38.0 40.8 39.9
4.2
4.4
34.2
34.0
22.4
30.8
21.7 20.6 16.4 16.4 15.3 15.2 13.3 13.4 14.3 14.6
Source: Company, MOSL
5 February 2016
6

Mphasis
Operating metrics
Exhibit 1: Operating metrics
Apr-13
Vertical Contribution (%)
Banking and Capital Markets
Insurance
IT, Commn & Entmt
Emerging Industries
Total
Revenue by Project Type (%)
TTM
FPP
Revenue by Delivery Location (%)
Onsite
Offshore
Secondary Market Segment (%)
HP Channel
Mature Market - Direct Channel
Emerging Market - Direct Channel
Service Type (%)
App Maintenance
App Development
Customer Service
Service/Technical Help Desk
Trasaction Processing Service
Infra Management Services
Knowledge Processes
License Income
CLIENT METRICS
Client wins
BCM
Insurance
ITCE
Emerging industries
Total
Client wins Channels
Direct Channel
HP Channel
Total Client additions
Clients Contributing More than
USD1m
USD5m
USD10m
USD20m
Clients - Direct Channel
USD1m
USD5m
USD10m
USD20m
Clients - HP Channel
USD1m
USD5m
USD10m
USD20m
35.9
11.6
21.0
31.5
100
89
11
42
58
46
47
7
31
21
5
3
5
20
14
1
Jul-13 Oct-13 Jan-14 Mar-14 Jun-14 Sep-14 Dec-14 Mar-15 Jun-15 Sep-15 Dec-15
39.7
11.5
17.8
31.0
100
87
13
45
55
41
54
5
31
22
5
3
5
17
17
0
41.8
12.1
16.2
29.9
100
86
14
47
53
40
56
4
31
22
5
3
5
16
18
1
41.4
12.9
16.1
29.7
100
87
13
47
53
37
57
5
29
20
5
3
5
18
18
1
41.5
12.1
16.3
30.1
100
86
14
46
54
36
57
7
26
23
5
3
5
19
18
0
40.7
12.8
16.8
29.7
100
87
13
45
55
36
56
8
28
22
5
3
5
20
16
0
41.9
13.4
16.9
27.8
100
86
14
46
54
36
58
7
29
24
6
3
6
18
15
0
39.6
14.9
16.9
28.6
100
83
17
43
57
35
56
9
29
25
6
2
7
20
11
1
41.8
15.3
15.6
27.3
100
86
14
47
53
31
60
9
29
25
6
2
7
17
14
1
44.3
15.5
14.3
25.8
100
88
12
49
51
29
64
7
29
25
5
2
7
15
17
1
46.9
15.2
12.7
25.2
100
86
14
49
51
27
67
7
30
24
4
2
7
15
18
0
49.7
15.7
10.0
24.6
100
81
19
51
49
24
70
5
33
23
2
2
7
15
18
1
6
3
4
8
21
10
11
21
128
42
22
9
62
19
10
6
66
23
12
3
4
1
3
8
16
10
6
16
122
44
22
10
58
20
12
7
64
24
10
3
3
4
1
9
17
8
9
17
117
41
21
11
59
20
12
8
58
21
9
3
2
3
0
6
11
10
1
11
110
42
20
11
54
21
12
7
56
21
8
4
2
0
2
4
8
4
4
8
112
43
19
11
57
25
13
8
55
18
6
3
9
1
1
5
16
11
5
16
110
42
17
10
57
25
12
7
53
17
5
3
1
0
2
7
10
5
5
10
104
41
17
10
52
25
12
7
52
16
5
3
2
0
0
1
3
3
0
3
100
42
17
8
49
25
12
6
51
17
12
2
4
1
2
5
12
8
4
12
102
39
19
9
57
25
14
7
45
14
5
2
5
2
0
3
10
10
0
10
98
36
20
8
58
24
15
6
40
12
5
2
5
0
0
3
8
7
1
8
100
39
19
7
61
27
15
5
39
12
4
2
5
2
0
1
8
5
3
8
102
35
18
8
63
25
14
6
39
10
4
2
Source: MOSL, Company
5 February 2016
7

Mphasis
Financials and Valuations
Key assumption
Y/E Mar
INR/USD Rate
Revenues (USD m)
Total Delivery Headcount
Net Addition
Per Capita Productivity (USD)
HP Channel Revenue (%)
Direct Channel Revenue (%)
2011
45.7
1,117
40,408
446
27,646
65.9
34.1
2012
53.0
1,036
36,640
-3,768
28,284
56.5
43.5
2013
57.5
1,025
37,052
412
27,655
44.4
55.6
2014
58.7
427
35,663
-1,389
28,717
36.8
63.2
2015
61.3
944
34,059
-1,604
27,716
34.5
65.5
2016E
65.3
929
22,362
-11,697
41,564
27.6
72.4
2017E
67.0
963
23,662
1,300
40,683
23.4
76.6
2018E
69.0
1,057
25,737
2,075
41,065
19.9
80.1
Income Statement
Y/E Mar
Net Sales
Change (%)
EBITDA
EBITDA Margin (%)
Depreciation
EBIT
Interest
Other Income
Extraordinary items
PBT
Tax
Tax Rate (%)
Min. Int. & Assoc. Share
Reported PAT
Adjusted PAT
Change (%)
2011
50,980
1.2
9,934
19.5
1,550
8,384
0
1,751
0
10,135
1,827
18.0
0
8,308
8,308
-19.1
2011
2,100
36,898
38,998
2,946
-975
40,969
11,339
8,495
2,844
102
17,765
25,610
0
13,072
2,897
9,641
14,050
9,098
4,952
11,560
40,969
2012
53,574
5.1
10,511
19.6
1,745
8,766
0
1,513
0
10,279
2,357
22.9
0
7,922
7,922
-4.6
2012
2,101
41,946
44,047
3,299
-1,015
46,331
11,401
9,041
2,360
150
25,192
22,970
0
12,102
4,216
6,652
13,953
8,765
5,188
9,017
46,331
2013
57,963
8.2
10,335
17.8
1,446
8,889
0
1,062
0
9,951
2,514
25.3
0
7,437
7,437
-6.1
2013
2,101
47,243
49,344
5,600
-1,015
53,929
10,892
8,770
2,122
266
18,995
26,060
0
12,582
5,943
7,535
16,013
10,167
5,846
10,047
53,929
2014
25,939
7.4
4,397
17.0
504
3,893
0
389
0
4,282
1,191
27.8
0
3,091
3,091
-0.3
2014
2,101
49,049
51,150
5,555
-968
55,737
10,912
8,734
2,178
62
18,154
26,522
0
12,967
4,700
8,855
13,044
9,446
3,598
13,478
55,737
2015
57,949
-6.9
8,701
15.0
980
7,721
0
1,687
0
9,408
2,630
28.0
0
6,778
6,778
-8.6
2015
2,101
52,697
54,798
6,253
-826
60,225
10,055
8,499
1,556
318
14,431
35,014
0
11,371
13,311
10,332
12,875
7,145
5,730
22,139
60,225
2016E
60,918
5.1
8,982
14.7
797
8,184
0
1,819
0
10,004
2,729
27.3
0
7,274
7,274
7.3
2016E
2,102
56,142
58,244
3,913
-757
61,400
10,027
8,516
1,511
849
18,006
37,606
0
12,199
14,935
10,472
19,504
8,941
10,564
18,102
61,400
2017E
64,446
5.8
10,151
15.8
943
9,208
0
1,964
0
11,172
3,072
27.5
0
8,100
8,100
11.4
2017E
2,102
58,946
61,048
2,913
-757
63,204
12,147
9,459
2,688
849
18,006
34,832
0
13,296
11,064
10,472
16,103
9,744
6,359
18,728
63,204
(INR Million)
2018E
72,491
12.5
11,628
16.0
1,066
10,562
0
1,704
0
12,266
3,373
27.5
0
8,893
8,893
9.8
Balance Sheet
Y/E Mar
Share Capital
Reserves
Net Worth
Debt
Deferred Tax
Total Capital Employed
Gross Fixed Assets
Less: Acc Depreciation
Net Fixed Assets
Capital WIP
Investments
Current Assets
Inventory
Debtors
Cash & Bank
Loans & Adv, Others
Curr Liabs & Provns
Curr. Liabilities
Provisions
Net Current Assets
Total Assets
(INR Million)
2018E
2,102
62,038
64,140
1,913
-757
65,296
14,267
10,525
3,742
849
18,006
37,964
0
15,025
12,467
10,472
18,198
11,011
7,186
19,766
65,296
5 February 2016
8

Mphasis
Financials and Valuations
Ratios
Y/E Mar
Basic (INR)
EPS
Cash EPS
Book Value
DPS
Payout (incl. Div. Tax.)
Valuation(x)
P/E
Cash P/E
Price / Book Value
EV/Sales
EV/EBITDA
Dividend Yield (%)
Profitability Ratios (%)
RoE
RoCE
Turnover Ratios (%)
Fixed Asset Turnover (x)
Debtors (No. of Days)
Leverage Ratios (%)
Net Debt/Equity (x)
2011
39.3
46.9
185.7
6.5
16.5
2012
37.5
46.0
209.6
17.0
45.3
2013
35.3
42.3
234.9
17.0
48.1
2014
14.7
17.1
243.5
7.0
47.6
12.5
10.7
1.8
1.2
7.1
3.8
23.1
22.2
19.4
90
0.1
2011
9,934
1,751
1,247
-1,827
-221
10,884
-1,985
8,899
-3,165
-4,812
-9,961
-704
2,490
0
-1,598
188
1,111
1,786
2,897
19.1
19.6
20.6
86
0.1
2012
10,511
1,513
3,862
-2,357
-40
13,489
-1,309
12,180
-7,427
-914
-9,650
1,307
353
0
-4,180
-2,520
1,319
2,897
4,216
15.9
17.4
25.9
78
0.1
2013
10,335
1,062
697
-2,514
0
9,580
-1,324
8,256
6,197
-12,887
-8,014
2,040
2,301
0
-4,180
161
1,727
4,216
5,943
14.8
16.7
29.0
74
0.1
2014
4,397
389
-4,674
-1,191
47
-1,032
-356
-1,388
841
634
1,119
436
-45
0
-1,721
-1,330
-1,243
5,943
4,700
2015
32.3
36.9
260.8
16.0
49.6
13.6
11.9
1.7
1.2
8.2
3.6
12.8
13.1
31.0
77
0.1
2015
8,701
1,687
-50
-2,630
142
7,850
-614
7,236
3,723
84
3,193
903
698
0
-4,033
-2,432
8,611
4,700
13,311
2016E
34.6
38.4
277.1
18.8
54.2
12.7
11.5
1.6
1.0
7.1
4.3
12.9
13.3
39.7
71
0.1
2016E
8,982
1,819
5,661
-2,729
69
13,802
-1,283
12,519
-3,575
-1,152
-6,010
901
-2,340
0
-4,730
-6,169
1,623
13,310
14,933
2017E
38.5
43.0
290.4
21.0
54.5
11.4
10.2
1.5
1.0
6.5
4.8
13.6
14.6
30.7
72
0.0
2017E
10,151
1,964
-4,497
-3,072
0
4,545
-2,120
2,425
0
0
-2,120
0
-1,000
0
-5,297
-6,297
-3,872
14,933
11,062
2018E
42.3
47.4
305.1
23.0
54.4
10.4
9.3
1.4
0.9
5.5
5.2
14.2
16.2
22.5
71
0.0
Cash Flow Statement
Y/E Mar
Adjusted EBITDA
Non cash opr. exp (inc)
(Inc)/Dec in Wkg. Cap.
Tax Paid
Other operating activities
CF from Op. Activity
(Inc)/Dec in FA & CWIP
Free cash flows
(Pur)/Sale of Invt
Others
CF from Inv. Activity
Inc/(Dec) in Net Worth
Inc / (Dec) in Debt
Interest Paid
Divd Paid (incl Tax) & Others
CF from Fin. Activity
Inc/(Dec) in Cash
Add: Opening Balance
Closing Balance
(INR Million)
2018E
11,628
1,704
365
-3,373
0
10,324
-2,120
8,204
0
0
-2,120
0
-1,000
0
-5,801
-6,801
1,402
11,062
12,464
5 February 2016
9

Mphasis
Corporate profile
Company description
MphasiS, an HP-EDS company is amongst the top IT
service providers from India. It has a balanced mix of
Application and BPO businesses, with good growth in
ITO business, and support of its US-based parent, HP-
EDS. Mphasis employs over 35,900 people.
Exhibit 1: Sensex rebased
Source: MOSL/Bloomberg
Exhibit 2: Shareholding pattern (%)
Promoter
DII
FII
Others
Sep-15
60.5
8.3
20.4
10.8
Jun-15
60.5
5.8
22.9
10.9
Sep-14
60.5
4.6
26.5
8.4
Exhibit 3: Top holders
Holder Name
Aberdeen Global Indian Equity (Mauritius)
Ltd
Aberdeen Global - Asian Smaller Companies
Fund
Bajaj Allianz Life Insurance Company Ltd
LIC of India Market Plus 1 Growth Fund
ICICI Prudential Life Insurance Company Ltd
% Holding
6.9
2.0
1.8
1.6
1.4
Source: Capitaline
Note: FII Includes depository receipts
Source: Capitaline
Exhibit 4: Top management
Name
D S Brar
James Mark Merritt
Balu Ganesh Ayyar
A Sivaram Nair
Designation
Chairman
Vice Chairman
Chief Executive Officer
Company Secretary
Exhibit 5: Directors
Name
Lakshmikanth K Ananth
Jan Kathleen Hier
Mary Teresa Hassett
Name
Narayanan Kumar
Jeff Thomas
Stefan Antonio Lutz
Source: Capitaline
*Independent
Exhibit 6: Auditors
Name
S R Batliboi & Associates LLP
Type
Statutory
Exhibit 7: MOSL forecast v/s consensus
EPS
(INR)
FY16
FY17
FY18
MOSL
forecast
34.6
38.5
42.3
Consensus
forecast
34.8
39.3
42.4
Variation (%)
-0.6
-2.0
-0.3
Source: Bloomberg
Source: Capitaline
5 February 2016
10

Mphasis
NOTES
5 February 2016
11

Disclosures
This document has been prepared by Motilal Oswal Securities Limited (hereinafter referred to as Most) to provide information about the company(ies) and/sector(s), if any, covered in the report and may be distributed by it and/or its
Mphasis
affiliated company(ies). This report is for personal information of the selected recipient/s and does not construe to be any investment, legal or taxation advice to you. This research report does not constitute an offer, invitation or
inducement to invest in securities or other investments and Motilal Oswal Securities Limited (hereinafter referred as MOSt) is not soliciting any action based upon it. This report is not for public distribution and has been furnished to
you solely for your general information and should not be reproduced or redistributed to any other person in any form. This report does not constitute a personal recommendation or take into account the particular investment
objectives, financial situations, or needs of individual clients. Before acting on any advice or recommendation in this material, investors should consider whether it is suitable for their particular circumstances and, if necessary, seek
professional advice. The price and value of the investments referred to in this material and the income from them may go down as well as up, and investors may realize losses on any investments. Past performance is not a guide for
future performance, future returns are not guaranteed and a loss of original capital may occur.
MOSt and its affiliates are a full-service, integrated investment banking, investment management, brokerage and financing group. We and our affiliates have investment banking and other business relationships with a some
companies covered by our Research Department. Our research professionals may provide input into our investment banking and other business selection processes. Investors should assume that MOSt and/or its affiliates are
seeking or will seek investment banking or other business from the company or companies that are the subject of this material and that the research professionals who were involved in preparing this material may educate investors
on investments in such business. The research professionals responsible for the preparation of this document may interact with trading desk personnel, sales personnel and other parties for the purpose of gathering, applying and
interpreting information. Our research professionals are paid on the profitability of MOSt which may include earnings from investment banking and other business.
MOSt generally prohibits its analysts, persons reporting to analysts, and members of their households from maintaining a financial interest in the securities or derivatives of any companies that the analysts cover. Additionally, MOSt
generally prohibits its analysts and persons reporting to analysts from serving as an officer, director, or advisory board member of any companies that the analysts cover. Our salespeople, traders, and other professionals or affiliates
may provide oral or written market commentary or trading strategies to our clients that reflect opinions that are contrary to the opinions expressed herein, and our proprietary trading and investing businesses may make investment
decisions that are inconsistent with the recommendations expressed herein. In reviewing these materials, you should be aware that any or all of the foregoing among other things, may give rise to real or potential conflicts of interest.
MOSt and its affiliated company(ies), their directors and employees and their relatives may; (a) from time to time, have a long or short position in, act as principal in, and buy or sell the securities or derivatives thereof of companies
mentioned herein. (b) be engaged in any other transaction involving such securities and earn brokerage or other compensation or act as a market maker in the financial instruments of the company(ies) discussed herein or act as an
advisor or lender/borrower to such company(ies) or may have any other potential conflict of interests with respect to any recommendation and other related information and opinions.; however the same shall have no bearing
whatsoever on the specific recommendations made by the analyst(s), as the recommendations made by the analyst(s) are completely independent of the views of the affiliates of MOSt even though there might exist an inherent
conflict of interest in some of the stocks mentioned in the research report
Reports based on technical and derivative analysis center on studying charts company's price movement, outstanding positions and trading volume, as opposed to focusing on a company's fundamentals and, as such, may not match
with a report on a company's fundamental analysis. In addition MOST has different business segments / Divisions with independent research separated by Chinese walls catering to different set of customers having various
objectives, risk profiles, investment horizon, etc, and therefore may at times have different contrary views on stocks sectors and markets.
Unauthorized disclosure, use, dissemination or copying (either whole or partial) of this information, is prohibited. The person accessing this information specifically agrees to exempt MOSt or any of its affiliates or employees from, any
and all responsibility/liability arising from such misuse and agrees not to hold MOSt or any of its affiliates or employees responsible for any such misuse and further agrees to hold MOSt or any of its affiliates or employees free and
harmless from all losses, costs, damages, expenses that may be suffered by the person accessing this information due to any errors and delays. The information contained herein is based on publicly available data or other sources
believed to be reliable. Any statements contained in this report attributed to a third party represent MOSt’s interpretation of the data, information and/or opinions provided by that third party either publicly or through a subscription
service, and such use and interpretation have not been reviewed by the third party. This Report is not intended to be a complete statement or summary of the securities, markets or developments referred to in the document. While we
would endeavor to update the information herein on reasonable basis, MOSt and/or its affiliates are under no obligation to update the information. Also there may be regulatory, compliance, or other reasons that may prevent MOSt
and/or its affiliates from doing so. MOSt or any of its affiliates or employees shall not be in any way responsible and liable for any loss or damage that may arise to any person from any inadvertent error in the information contained in
this report. MOSt or any of its affiliates or employees do not provide, at any time, any express or implied warranty of any kind, regarding any matter pertaining to this report, including without limitation the implied warranties of
merchantability, fitness for a particular purpose, and non-infringement. The recipients of this report should rely on their own investigations.
This report is intended for distribution to institutional investors. Recipients who are not institutional investors should seek advice of their independent financial advisor prior to taking any investment decision based on this report or for
any necessary explanation of its contents.
Most and it’s associates may have managed or co-managed public offering of securities, may have received compensation for investment banking or merchant banking or brokerage services, may have received any compensation for
products or services other than investment banking or merchant banking or brokerage services from the subject company in the past 12 months.
Most and it’s associates have not received any compensation or other benefits from the subject company or third party in connection with the research report.
Subject Company may have been a client of Most or its associates during twelve months preceding the date of distribution of the research report
MOSt and/or its affiliates and/or employees may have interests/positions, financial or otherwise of over 1 % at the end of the month immediately preceding the date of publication of the research in the securities mentioned in this
report. To enhance transparency, MOSt has incorporated a Disclosure of Interest Statement in this document. This should, however, not be treated as endorsement of the views expressed in the report.
Motilal Oswal Securities Limited is registered as a Research Analyst under SEBI (Research Analyst) Regulations, 2014. SEBI Reg. No. INH000000412
There are no material disciplinary action that been taken by any regulatory authority impacting equity research analysis activities
Analyst Certification
The views expressed in this research report accurately reflect the personal views of the analyst(s) about the subject securities or issues, and no part of the compensation of the research analyst(s) was, is, or will be directly or
indirectly related to the specific recommendations and views expressed by research analyst(s) in this report. The research analysts, strategists, or research associates principally responsible for preparation of MOSt research receive
compensation based upon various factors, including quality of research, investor client feedback, stock picking, competitive factors and firm revenues
Disclosure of Interest Statement
Analyst ownership of the stock
Served as an officer, director or employee
MPHASIS
No
No
A graph of daily closing prices of securities is available at www.nseindia.com and http://economictimes.indiatimes.com/markets/stocks/stock-quotes
Regional Disclosures (outside India)
For U.S.
This report is not directed or intended for distribution to or use by any person or entity resident in a state, country or any jurisdiction, where such distribution, publication, availability or use would be contrary to law, regulation or which
would subject MOSt & its group companies to registration or licensing requirements within such jurisdictions.
Motilal Oswal Securities Limited (MOSL) is not a registered broker - dealer under the U.S. Securities Exchange Act of 1934, as amended (the"1934 act") and under applicable state laws in the United States. In addition MOSL is not a
registered investment adviser under the U.S. Investment Advisers Act of 1940, as amended (the "Advisers Act" and together with the 1934 Act, the "Acts), and under applicable state laws in the United States. Accordingly, in the
absence of specific exemption under the Acts, any brokerage and investment services provided by MOSL, including the products and services described herein are not available to or intended for U.S. persons.
This report is intended for distribution only to "Major Institutional Investors" as defined by Rule 15a-6(b)(4) of the Exchange Act and interpretations thereof by SEC (henceforth referred to as "major institutional investors"). This
document must not be acted on or relied on by persons who are not major institutional investors. Any investment or investment activity to which this document relates is only available to major institutional investors and will be
engaged in only with major institutional investors. In reliance on the exemption from registration provided by Rule 15a-6 of the U.S. Securities Exchange Act of 1934, as amended (the "Exchange Act") and interpretations thereof by
the U.S. Securities and Exchange Commission ("SEC") in order to conduct business with Institutional Investors based in the U.S., MOSL has entered into a chaperoning agreement with a U.S. registered broker-dealer, Motilal Oswal
Securities International Private Limited. ("MOSIPL"). Any business interaction pursuant to this report will have to be executed within the provisions of this chaperoning agreement.
The Research Analysts contributing to the report may not be registered /qualified as research analyst with FINRA. Such research analyst may not be associated persons of the U.S. registered broker-dealer, MOSIPL, and therefore,
may not be subject to NASD rule 2711 and NYSE Rule 472 restrictions on communication with a subject company, public appearances and trading securities held by a research analyst account.
For Hong Kong:
This report is distributed in Hong Kong by Motilal Oswal capital Markets (Hong Kong) Private Limited, a licensed corporation (CE AYY-301) licensed and regulated by the Hong Kong Securities and Futures Commission (SFC)
pursuant to the Securities and Futures Ordinance (Chapter 571 of the Laws of Hong Kong) “SFO”. As per SEBI (Research Analyst Regulations) 2014 Motilal Oswal Securities (SEBI Reg No. INH000000412) has an agreement with
Motilal Oswal capital Markets (Hong Kong) Private Limited for distribution of research report in Kong Kong. This report is intended for distribution only to “Professional Investors” as defined in Part I of Schedule 1 to SFO. Any
investment or investment activity to which this document relates is only available to professional investor and will be engaged only with professional investors.”
Nothing here is an offer or solicitation of these securities, products and services in any jurisdiction where their offer or sale is not qualified or exempt from registration. The Indian Analyst(s) who compile this report is/are not located in
Hong Kong & are not conducting Research Analysis in Hong Kong.
For Singapore
Motilal Oswal Capital Markets Singapore Pte Limited is acting as an exempt financial advisor under section 23(1)(f) of the Financial Advisers Act(FAA) read with regulation 17(1)(d) of the Financial Advisors Regulations and is a
subsidiary of Motilal Oswal Securities Limited in India. This research is distributed in Singapore by Motilal Oswal Capital Markets Singapore Pte Limited and it is only directed in Singapore to accredited investors, as defined in the
Financial Advisers Regulations and the Securities and Futures Act (Chapter 289), as amended from time to time.
In respect of any matter arising from or in connection with the research you could contact the following representatives of Motilal Oswal Capital Markets Singapore Pte Limited:
Kadambari Balachandran
Email : kadambari.balachandran@motilaloswal.com
Contact : (+65) 68189233 / 65249115
Office Address : 21 (Suite 31),16 Collyer Quay,Singapore 04931
5 February 2016
Motilal Oswal Tower, Level 9, Sayani Road, Prabhadevi, Mumbai 400 025
Phone: +91 22 3982 5500 E-mail: reports@motilaloswal.com
Motilal Oswal Securities Ltd
12