5 February 2016
Q3FY16 Results Update | Sector: Consumer
Radico Khaitan
Buy
BSE SENSEX
24,617
Bloomberg
Equity Shares (m)
M.Cap.(INRb)/(USDb)
52-Week Range (INR)
1, 6, 12 Rel. Per (%)
Avg Val, INRm/ Vol m
Free float (%)
S&P CNX
7,489
RDCK IN
133.0
15.0 / 0.2
131 / 78
2/27/35
49
59.5
CMP: INR113
TP: INR150(+32%)
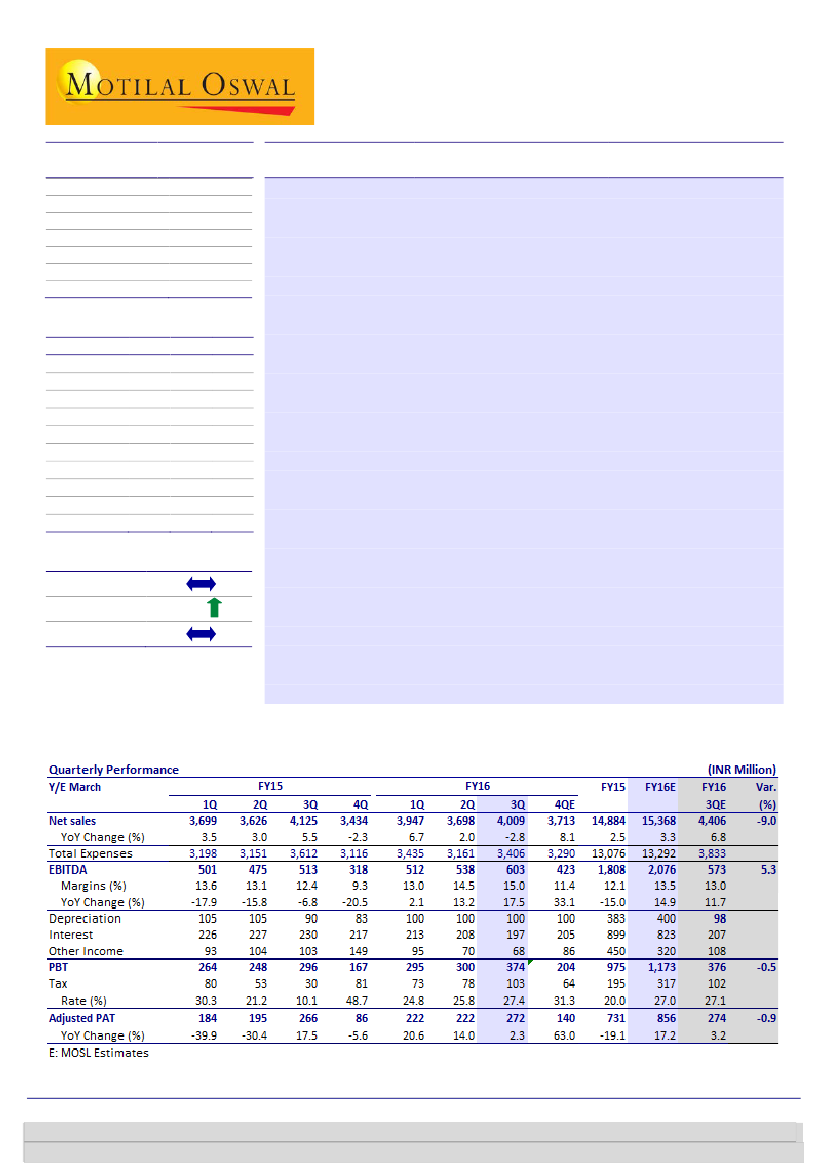
In-line, de-focus on lower end brands in TN impacts volumes
RDCK’s net sales declined 2.8% YoY
to INR4b (est. of INR4.4b), with underlying
volume decline of 3.8% YoY to 4.8m cases. EBITDA posted 17.5% YoY growth to
INR603m (est. INR573m; aided by soft base wherein EBITDA declined 6.8%).
However lower other income (down 34% YoY) and higher tax rate (up 1720bps
YoY) dragged Adj. PAT growth of 2.3% to INR272m (est. INR274m).
Gross sales were up 8.2% YoY to INR9.7b
while excise duties increased 16.1%
YoY (excise duties now constitute 59.5% of gross sales, up 410bps YoY). Overall
volumes declined 3.8% YoY to 4.8m cases due to de-focus on lower-end brands
(TN volumes declined by 69% YoY). Premium brands volumes grew 10.7% YoY
to 1.2m cases and now form 24.6% of portfolio volumes (up 320bps YoY).
In 3QFY16, gross margin expanded
due to reduced raw material consumption
costs, on account of excise duty impact on the increased inventory of bottled
IMFL stock at the Rampur facility. The corresponding impact of which is
negated by increase in rates and taxes included under other expenditure.
Lower selling expenses (down 80bps YoY) further aided EBITDA margin
expansion of 260bps YoY to 15% (est. 13%).
Management Call takeaways:
1) Market share across brands is growing with
premium brands registering healthy growth, 2) As per market interactions,
Royal Challenge brand is doing well however UNSP has re-launched the brand
at lower price point. 3) No pricing actions yet, however it expects to get prices
increase in Southern states in FY17. 4) Net debt stood as on 3QFY16 is INR8.2b.
Valuation and view:
We revise our estimates marginally by 3%/4% and build in
10.2% sales CAGR and 18.1% PAT CAGR. RDCK is focusing on driving premium
portfolio given the challenging margin dynamics of Regular portfolio. We roll
forward our estimates and maintain BUY with a revised target price of INR150
(16x Sept’17 EPS. Spike in ENA prices and excise duty increase are key risks.
Financials & Valuations (INR b)
Y/E Mar
2015 2016E 2017E
Net Sales
14.9
15.4
17.4
EBITDA
1.9
2.1
2.5
PAT
0.9
0.9
1.1
EPS (INR)
6.6
6.4
8.5
Gr. (%)
4.2
-3.0
31.5
BV/Sh (INR)
64.7
71.4
78.4
RoE (%)
10.5
9.5
11.3
RoCE (%)
8.6
9.2
10.8
P/E (x)
17.1
17.6
13.4
P/BV (x)
1.8
1.6
1.4
Estimate change
TP change
Rating change
11%
Gautam Duggad
(Gautam.Duggad@MotilalOswal.com); +91 22 3982 5404
Manish Poddar
(manish.poddar@motilaloswal.com); +91 22 3027 8029 /
Vishal Punmiya
(Vishal.Punmiya@MotilalOswal.com)
Investors are advised to refer through important disclosures made at the last page of the Research Report.
Motilal Oswal research is available on www.motilaloswal.com/Institutional-Equities, Bloomberg, Thomson Reuters, Factset and S&P Capital.

Radico Khaitan
Key quarterly charts
Exhibit 1: Volumes declined 3.8% in 3QFY16; due to defocus
on lower end brands in Tamil Nadu
10.5
Volume Growth (%)
Exhibit 2:
..while premium brands share was up 320bps YoY
Premium brand volume as % of total volumes
6.8 8.2 7.8 6.5 7.2 7.6 7.2
9.9
3.5
(3.5)
(3.9) (5.6)
(4.2)
(3.8)
(7.2)
(10.3)
Source: Company, MOSL
Exhibit 3: 3Q16 volumes down 3.8%, premium brands volumes up 10.7%
Brands (cases in lacs)
2QFY13 3QFY13 4QFY13 1QFY14 2QFY14 3QFY14 4QFY14 1QFY15 2QFY15 3QFY15 4QFY15 1QFY16 2QFY16 3QFY16
Magic Moments Vodka
6.0
6.8
NA
NA
NA
NA
NA
NA
NA
NA
NA
NA
NA
NA
Morpheus Brandy
1.2
1.5
NA
NA
NA
NA
NA
NA
NA
NA
NA
NA
NA
NA
Premium Brands
7.3
8.2
7.0
9.9
8.9
10.2
8.2
11.1
9.8
10.7
8.8
12.1
10.6
11.9
Other Main Line Brands 26.2
27.4
26.6
31.5
27.4
42.7
38.9
42.4
36.5
39.3
36.3
35.9
32.3
36.3
Total main line brands
33.4
35.6
33.5
41.4
36.2
52.9
47.1
53.6
46.2
50.0
45.1
48.1
42.9
48.1
Other brands
11.5
12.6
12.0
14.1
11.9
0.0
0.0
0.0
0.0
0.0
0.0
0.0
0.0
0.0
Total
44.9
48.2
45.5
55.5
48.1
52.9
47.1
53.6
46.2
50.0
45.1
48.1
42.9
48.1
Source: Company, MOSL
Exhibit 4: Revenues down 2.8%, 9% below estimates
14.7
2.1
Net Sales (INR m)
19.9
16.8 17.6 18.5
8.1
6.0
Sales Growth (%)
10.5
13.9
3.5
3.0
5.5
(2.3)
6.7
2.0
(2.8)
Source: Company, MOSL
Exhibit 5: ENA prices stable during the quarter
ENA Price (INR/BL)
Exhibit 6: EBITDA per case (INR)
EBITDA/case (INR)
Source: Company, MOSL
5 February 2016
2

Radico Khaitan
Valuation and view
We revise our estimates marginally by 3%/4% and build in 10.2% sales CAGR and
18.1% PAT CAGR. RDCK is focusing on driving premium portfolio given the
challenging margin dynamics of Regular portfolio. We roll forward our estimates
and maintain BUY with a revised target price of INR150 (16x Sept’17 EPS. Spike
in ENA prices and excise duty increase are key risks.
Exhibit 7: Revised estimates by 3-4% to bake in 3Q numbers
2016E
15,734
1,949
851
Old
2017E
17,638
2,340
1,119
2018E
19,960
2,721
1,401
2016E
15,368
2,076
856
New
2017E
17,423
2,472
1,126
2018E
19,924
2,930
1,452
2016E
-2.3
6.5
0.7
Change (%)
2017E
2018E
-1.2
-0.2
5.7
7.7
0.6
3.7
Source: Company, MOSL
Sales
EBITDA
PAT
Exhibit 8: Radico P/E (x)
80.0
60.0
40.0
20.0
0.0
11.4
14.1
26.8
PE (x)
Peak(x)
Avg(x)
75.4
Min(x)
Exhibit 9: Radico P/E premium vs. Sensex
Radico Khaitan PE Relative to Sensex PE (%)
360
240
120
0
-120
60.7
-11.0
LPA (%)
Source: Company, MOSL
Exhibit 10:
Valuation
Matrix of coverage universe
Company
Consumer
Asian Paints
Britannia
Colgate
Dabur*
Emami*
Godrej Consumer
GSK Consumer
Hind. Unilever
ITC
Jyothy Labs
Marico*
Nestle
Page Industries
Pidilite Inds.
Radico Khaitan
United Spirits
Retail
Jubilant Foodworks
Shopper's Stop
Titan Company
Reco
Price
(INR)
897
2,866
852
251
1,028
1,245
5,751
845
324
287
228
5,434
11,760
597
113
2,609
1,172
373
369
P/E (x)
EV/EBITDA (x)
ROE (%) Div. (%)
Mkt Cap EPS Growth YoY (%)
(USD M) FY16E FY17E FY18E FY16E FY17E FY18E FY16E FY17E FY18E FY16E FY16E
12,713
5,058
3,425
6,514
3,446
6,262
3,573
27,005
38,455
766
4,336
7,739
1,938
4,519
222
5,602
1,135
452
4,844
27.0
51.1
7.1
15.0
15.1
24.5
19.4
5.0
2.7
26.4
25.8
-21.8
21.2
48.5
-3.0
LP
4.5
32.6
-7.2
15.1
18.9
14.3
16.2
22.6
20.0
15.5
10.9
10.4
-8.7
15.5
25.7
27.9
10.2
31.5
76.9
53.2
35.8
20.9
9.9
14.6
14.1
12.5
16.9
14.4
9.2
14.2
14.3
12.6
12.4
22.3
31.1
15.1
28.9
46.6
42.6
39.7
13.2
47.6
39.6
38.7
35.9
41.7
37.5
34.7
46.0
26.3
32.3
40.7
53.4
55.2
40.1
17.6
90.8
66.2
57.5
42.9
41.4
33.3
33.9
30.9
34.0
31.2
30.0
41.5
23.8
35.3
35.3
42.5
43.2
36.4
13.4
51.3
43.2
42.3
35.5
37.6
29.1
29.7
27.5
29.1
27.3
27.5
36.3
20.8
31.4
31.4
34.7
33.0
31.6
10.4
35.0
30.3
30.3
31.4
32.6
27.5
23.7
28.7
34.6
28.3
24.6
31.7
17.2
26.7
27.3
31.0
33.7
25.1
11.0
42.2
26.3
14.2
32.3
27.8
22.5
21.1
24.4
28.5
24.0
20.9
29.0
15.7
22.5
23.4
25.2
27.2
22.1
9.0
30.5
18.6
12.2
26.5
25.1
19.1
18.8
21.7
24.5
21.6
18.5
25.6
13.9
19.9
20.6
21.0
21.0
19.0
7.5
22.8
13.7
10.0
23.2
35.2
58.2
72.6
33.0
40.6
23.2
30.3
110.3
30.4
19.6
35.5
34.2
47.0
29.8
9.5
48.1
15.8
6.8
21.2
1.1
0.9
1.8
1.0
1.0
0.8
1.2
2.0
2.1
1.4
0.9
1.4
0.8
0.7
0.9
0.0
0.3
0.3
0.7
Neutral
Buy
Neutral
Neutral
Buy
Neutral
Buy
Neutral
Neutral
Buy
Neutral
Neutral
Buy
Buy
Buy
Buy
Buy
Neutral
Neutral
Note: For Nestle FY15 means CY14
Source: Company, MOSL
5 February 2016
3

Radico Khaitan
Story in charts
Exhibit 11: Whisky forms bulk of the IMFL market…
IMFL Market (in volume terms)
White
Spirits
Rum
4%
15%
Exhibit 12: …with nearly 2/3rd value contribution
IMFL Market (in value terms)
White
Rum
Spirits
15%
3%
Brandy
22%
Whisky
59%
Brandy
16%
Whisky
66%
Source: Company, Industry MOSL
Source: Company, Industry, MOSL
Exhibit 13: Radico enjoys 5.1% volume market share in IMFL
UNSP
38.6
6.4
41.6
2007
Pernod Ricard
37.1
6.9
42.1
2008
35.9
7.5
42.3
2009
ABD
Jagajit
32.4
8.4
42.6
2010
Radico
33.1
9.0
41.6
2011
Others
32.4
9.7
41.0
2012
Source: Company, Industry, MOSL
Exhibit 14: IMFL industry expected to post healthy double digit value CAGR
INR m
Spirits
Brandy and Cognac
Rum
Whiskies
Gin
Vodka
2013
994.7
164.2
115.1
666.9
6.9
41.5
2014
1,110.3
185.8
125.0
745.1
6.8
47.5
2015E
1,227.2
207.8
134.6
824.2
6.7
53.8
2016E
1,345.8
229.7
144.4
904.6
6.7
60.4
2017E
1,463.7
250.5
154.8
984.7
6.6
67.1
CAGR
12.5
13.7
9.7
13.3
3.3
25.0
Source: Industry Sources, Company, MOSL
Exhibit 15: Per capita consumption remains low
9.5
Per Capita consumption (litres per annum)
8.5
5
4.7
Exhibit 16: Exhibit 17: Urban markets constitute 2/3 of IMFL
industry
Urban (%)
1,444
68
1,618
68
32
0.9
rd
Rural (%)
1,920
66
32
34
1,990
65
35
1,798
68
32
4.5
4.6
Russia
Brazil Thailand
USA
UK
World
India
2009
2010
2011
2012
2013
Source: Company, MOSL Note: Consumption in mn liters
Source: Company, MOSL
5 February 2016
4

Radico Khaitan
Financials and Valuations
Income Statement
Y/E March
Net Sales
Change (%)
Total Expenditure
EBITDA
Change (%)
Margin (%)
Depreciation
Int. and Fin. Charges
Financial Other Income
Profit before Taxes
Change (%)
Margin (%)
Tax
Tax Rate (%)
Profit after Taxes
Change (%)
Margin (%)
Extraordinary Income
Reported PAT
2011
9,469
12.9
7,975
1,494
9.3
15.8
271
293
47
977
94.7
10.3
257
26.3
720
72.4
7.6
8
728
2012
11,445
20.9
9,714
1,731
15.9
15.1
328
611
237
1,028
5.3
9.0
229
22.3
799
11.0
7.0
-163
637
2013
12,599
10.1
10,632
1,967
13.7
15.6
353
701
289
1,203
17.0
9.5
320
26.6
883
10.4
7.0
-110
773
2014
14,533
15.4
12,373
2,161
9.8
14.9
388
848
348
1,273
5.9
8.8
427
33.5
846
-4.1
5.8
-134
713
2015
14,895
2.5
12,974
1,921
-11.1
12.9
383
899
439
1,077
-15.4
7.2
195
18.1
882
4.2
5.9
-206
676
2016E
15,368
3.2
13,292
2,076
8.1
13.5
400
823
320
1,173
8.9
7.6
317
27.0
856
-3.0
5.6
0
856
(INR Million)
2017E
17,423
13.4
14,951
2,472
19.1
14.2
446
842
358
1,543
31.5
8.9
417
27.0
1,126
31.5
6.5
0
1,126
2018E
19,924
14.4
16,995
2,930
18.5
14.7
475
867
401
1,989
28.9
10.0
537
27.0
1,452
28.9
7.3
0
1,452
Balance Sheet
Y/E March
Share Capital
Reserves
Net Worth
Loans
Deferred Tax
Capital Employed
Gross Block
Less: Accum. Depn.
Net Fixed Assets
Capital WIP
Investments
Current
Non-current
Curr. Assets, L&A
Inventory
Account Receivables
Cash and Bank Balance
Others
Curr. Liab. and Prov.
Account Payables
Other Liabilities
Provisions
Net Current Assets
Misc. Exp./Others
Application of Funds
E: MOSL Estimates
2011
265
6,249
6,514
4,935
498
11,947
5,728
1,539
4,189
219
1,207
529
678
8,059
1,269
3,191
94
3,506
1,728
840
295
593
6,332
0
11,947
2012
265
6,687
6,953
6,547
563
14,063
6,870
1,847
5,022
48
1,113
530
584
10,139
1,774
3,478
218
4,669
2,528
1,187
1,148
193
7,611
268
14,063
2013
266
7,350
7,616
7,710
588
15,915
7,437
2,143
5,294
53
1,086
502
584
11,597
1,849
4,354
175
5,219
2,450
1,172
1,024
253
9,147
334
15,915
2014
266
7,950
8,216
9,083
695
17,994
8,206
2,501
5,705
81
1,084
500
584
13,287
2,103
5,233
173
5,778
2,568
1,276
854
439
10,719
405
17,994
2015
266
8,346
8,612
8,526
715
17,853
8,705
2,977
5,727
8
981
500
481
14,161
2,130
4,778
126
7,127
3,343
1,255
1,610
478
10,818
320
17,853
2016E
266
9,233
9,499
8,066
821
18,386
9,205
3,378
5,827
8
981
500
481
14,871
2,143
5,238
311
7,179
3,621
1,253
1,851
516
11,250
320
18,386
(INR Million)
2017E
266
10,162
10,428
7,766
960
19,153
9,705
3,824
5,881
8
981
500
481
16,018
2,276
5,702
449
7,591
4,054
1,342
2,129
583
11,964
320
19,153
2018E
266
11,359
11,625
7,466
1,139
20,229
10,205
4,299
5,906
8
981
500
481
17,569
2,489
6,073
542
8,466
4,554
1,443
2,448
664
13,015
320
20,229
5 February 2016
5

Radico Khaitan
Financials and Valuations
Ratios
Y/E March
Basic (INR)
EPS
Cash EPS
BV/Share
DPS
Payout %
Valuation (x)
P/E
Cash P/E
EV/Sales
EV/EBITDA
P/BV
Dividend Yield (%)
Return Ratios (%)
RoE
RoCE
Working Capital Ratios
Debtor (Days)
Asset Turnover (x)
Leverage Ratio
Debt/Equity (x)
2011
5.4
7.5
49.1
0.9
12.9
2012
6.0
8.5
52.4
0.8
13.3
2013
6.6
9.3
57.3
0.8
13.1
2014
6.4
9.3
61.8
0.8
12.6
2015
6.6
9.5
64.7
0.8
11.5
2016E
6.4
9.4
71.4
1.0
15.0
2017E
8.5
11.8
78.4
1.3
15.0
2018E
10.9
14.5
87.4
1.6
15.0
20.9
15.2
2.1
13.3
2.3
0.8
18.8
13.3
1.9
12.3
2.2
0.7
17.1
12.2
1.8
11.5
2.0
0.7
17.8
12.2
1.6
11.1
1.8
0.7
17.1
11.9
1.6
12.2
1.8
0.7
17.6
12.0
1.5
11.0
1.6
0.9
13.4
9.6
1.3
9.0
1.4
1.1
10.4
7.8
1.1
7.5
1.3
1.4
11.6
10.7
11.9
10.8
12.1
10.8
10.7
10.5
10.5
8.6
9.5
9.2
11.3
10.8
13.2
12.5
47
0.8
42
0.8
42
0.8
44
0.8
40
0.8
38
0.8
37
0.9
35
1.0
0.8
0.9
1.0
1.1
1.0
0.8
0.7
0.6
Cash Flow Statement
Y/E March
OP before Tax
Int./Div. Received
Depn & Amortzn.
Interest Paid
Direct Taxes Paid
Incr in WC
CF from Operations
Extraordinary Income
Incr in FA
Free Cash Flow
Other Assets
Pur of Investments
CF from Invest.
Issue of Shares
Interest Paid
Incr in Debt
Dividend Paid
Others Inflows
CF from Fin. Activity
Incr/Decr of Cash
Add: Opening Balance
Closing Balance
E: MOSL Estimates
2011
977
-47
271
293
257
1,256
-18
8
-88
78
13
314
-217
-7
293
474
79
-98
-3
-239
332
94
2012
1,028
-237
328
611
229
1,155
347
-163
971
-787
268
-94
-1,040
-70
611
1,612
93
-21
817
123
94
217
2013
1,203
-289
353
701
320
1,579
68
-110
573
-614
66
-27
-655
17
701
1,163
106
171
544
-42
218
175
2014
1,273
-348
388
848
427
1,574
160
-134
797
-771
71
-2
-929
14
848
1,372
116
344
767
-2
175
173
2015
1,077
-439
383
899
195
146
1,580
-206
425
949
-86
-103
-528
0
899
-557
107
464
-1,099
-48
173
125
2016E
1,173
-320
400
823
317
247
1,512
0
500
1,012
0
0
-500
0
823
-460
101
558
-826
186
126
311
(INR Million)
2017E
1,543
-358
446
842
417
576
1,480
0
500
980
0
0
-500
0
842
-300
128
428
-842
138
311
449
2018E
1,989
-401
475
867
537
958
1,435
0
500
935
0
0
-500
0
867
-300
169
495
-841
93
449
542
5 February 2016
6

Radico Khaitan
Corporate profile
Company description
Exhibit 1: Sensex rebased
Radico Khaitan (RDCK) is India's oldest alcoholic
beverage company. It entered the IMFL segment in
1999, with the launch of its flagship brand, 8PM.
RDCK has three distilleries in Rampur, UP and holds
36% interest in a JV in Aurangabad, Maharashtra. It
owns six bottling units and maintains 27 contract
bottling units. It holds 8% market share in the IMFL
industry and ~24% market share in the CSD segment.
The company offers all types of liquor, except for
beer and wine, in regular and premium categories.
Source: MOSL/Bloomberg
Exhibit 2: Shareholding pattern (%)
Promoter
DII
FII
Others
Sep-15
40.5
13.3
21.1
25.1
Jun-15
40.5
11.2
18.5
29.9
Sep-14
40.5
9.4
19.6
30.5
Exhibit 3: Top holders
Holder Name
Reliance Capital Trustee Company Limited
A/C Reliance Growth Fund
HSBC Global Investment Funds A/C HSBC GIF
Mauritius Limited
Ashish Dhawan
Morgan Stanley Asia (Singapore) Pte
SBI Small And Midcap Fund
% Holding
9.4
7.5
3.7
2.8
2.2
Source: Capitaline
Note: FII Includes depository receipts
Source: Capitaline
Exhibit 4: Top management
Name
Lalit Khaitan
Abhishek Khaitan
Amit Manchanda
Designation
Chairman
&
Managing
Director
Managing Director
Company Secretary
Exhibit 5: Directors
Name
Ashutosh Patra
Raghupati Singhania
Shailja Saraf
Name
Karna Singh Mehta
Sarvesh Srivastava
K P Singh
Source: Capitaline
Exhibit 6: Auditors
Name
Ernst & Young
S N Balasubramanian
V Sankar Aiyar & Co
Grant Thornton
S N Balasubramanian
Type
Internal
Cost Auditor
Statutory
Internal
Cost Auditor
Source: Capitaline
Exhibit 7: MOSL forecast v/s consensus
EPS
(INR)
FY16
FY17
FY18
MOSL
forecast
6.4
8.5
10.9
Consensus
forecast
6.1
8.0
10.2
Variation (%)
4.6
6.3
6.9
Source: Bloomberg
5 February 2016
7

Disclosures
This document has been prepared by Motilal Oswal Securities Limited (hereinafter referred to as Most) to provide information about the company(ies) and/sector(s), if any, covered in the report and may be distributed by it and/or its
Radico
offer, invitation
affiliated company(ies). This report is for personal information of the selected recipient/s and does not construe to be any investment, legal or taxation advice to you. This research report does not constitute an
Khaitan
or
inducement to invest in securities or other investments and Motilal Oswal Securities Limited (hereinafter referred as MOSt) is not soliciting any action based upon it. This report is not for public distribution and has been furnished to
you solely for your general information and should not be reproduced or redistributed to any other person in any form. This report does not constitute a personal recommendation or take into account the particular investment
objectives, financial situations, or needs of individual clients. Before acting on any advice or recommendation in this material, investors should consider whether it is suitable for their particular circumstances and, if necessary, seek
professional advice. The price and value of the investments referred to in this material and the income from them may go down as well as up, and investors may realize losses on any investments. Past performance is not a guide for
future performance, future returns are not guaranteed and a loss of original capital may occur.
MOSt and its affiliates are a full-service, integrated investment banking, investment management, brokerage and financing group. We and our affiliates have investment banking and other business relationships with a some
companies covered by our Research Department. Our research professionals may provide input into our investment banking and other business selection processes. Investors should assume that MOSt and/or its affiliates are
seeking or will seek investment banking or other business from the company or companies that are the subject of this material and that the research professionals who were involved in preparing this material may educate investors
on investments in such business. The research professionals responsible for the preparation of this document may interact with trading desk personnel, sales personnel and other parties for the purpose of gathering, applying and
interpreting information. Our research professionals are paid on the profitability of MOSt which may include earnings from investment banking and other business.
MOSt generally prohibits its analysts, persons reporting to analysts, and members of their households from maintaining a financial interest in the securities or derivatives of any companies that the analysts cover. Additionally, MOSt
generally prohibits its analysts and persons reporting to analysts from serving as an officer, director, or advisory board member of any companies that the analysts cover. Our salespeople, traders, and other professionals or affiliates
may provide oral or written market commentary or trading strategies to our clients that reflect opinions that are contrary to the opinions expressed herein, and our proprietary trading and investing businesses may make investment
decisions that are inconsistent with the recommendations expressed herein. In reviewing these materials, you should be aware that any or all of the foregoing among other things, may give rise to real or potential conflicts of interest.
MOSt and its affiliated company(ies), their directors and employees and their relatives may; (a) from time to time, have a long or short position in, act as principal in, and buy or sell the securities or derivatives thereof of companies
mentioned herein. (b) be engaged in any other transaction involving such securities and earn brokerage or other compensation or act as a market maker in the financial instruments of the company(ies) discussed herein or act as an
advisor or lender/borrower to such company(ies) or may have any other potential conflict of interests with respect to any recommendation and other related information and opinions.; however the same shall have no bearing
whatsoever on the specific recommendations made by the analyst(s), as the recommendations made by the analyst(s) are completely independent of the views of the affiliates of MOSt even though there might exist an inherent
conflict of interest in some of the stocks mentioned in the research report
Reports based on technical and derivative analysis center on studying charts company's price movement, outstanding positions and trading volume, as opposed to focusing on a company's fundamentals and, as such, may not match
with a report on a company's fundamental analysis. In addition MOST has different business segments / Divisions with independent research separated by Chinese walls catering to different set of customers having various
objectives, risk profiles, investment horizon, etc, and therefore may at times have different contrary views on stocks sectors and markets.
Unauthorized disclosure, use, dissemination or copying (either whole or partial) of this information, is prohibited. The person accessing this information specifically agrees to exempt MOSt or any of its affiliates or employees from, any
and all responsibility/liability arising from such misuse and agrees not to hold MOSt or any of its affiliates or employees responsible for any such misuse and further agrees to hold MOSt or any of its affiliates or employees free and
harmless from all losses, costs, damages, expenses that may be suffered by the person accessing this information due to any errors and delays. The information contained herein is based on publicly available data or other sources
believed to be reliable. Any statements contained in this report attributed to a third party represent MOSt’s interpretation of the data, information and/or opinions provided by that third party either publicly or through a subscription
service, and such use and interpretation have not been reviewed by the third party. This Report is not intended to be a complete statement or summary of the securities, markets or developments referred to in the document. While we
would endeavor to update the information herein on reasonable basis, MOSt and/or its affiliates are under no obligation to update the information. Also there may be regulatory, compliance, or other reasons that may prevent MOSt
and/or its affiliates from doing so. MOSt or any of its affiliates or employees shall not be in any way responsible and liable for any loss or damage that may arise to any person from any inadvertent error in the information contained in
this report. MOSt or any of its affiliates or employees do not provide, at any time, any express or implied warranty of any kind, regarding any matter pertaining to this report, including without limitation the implied warranties of
merchantability, fitness for a particular purpose, and non-infringement. The recipients of this report should rely on their own investigations.
This report is intended for distribution to institutional investors. Recipients who are not institutional investors should seek advice of their independent financial advisor prior to taking any investment decision based on this report or for
any necessary explanation of its contents.
Most and it’s associates may have managed or co-managed public offering of securities, may have received compensation for investment banking or merchant banking or brokerage services, may have received any compensation for
products or services other than investment banking or merchant banking or brokerage services from the subject company in the past 12 months.
Most and it’s associates have not received any compensation or other benefits from the subject company or third party in connection with the research report.
Subject Company may have been a client of Most or its associates during twelve months preceding the date of distribution of the research report
MOSt and/or its affiliates and/or employees may have interests/positions, financial or otherwise of over 1 % at the end of the month immediately preceding the date of publication of the research in the securities mentioned in this
report. To enhance transparency, MOSt has incorporated a Disclosure of Interest Statement in this document. This should, however, not be treated as endorsement of the views expressed in the report.
Motilal Oswal Securities Limited is registered as a Research Analyst under SEBI (Research Analyst) Regulations, 2014. SEBI Reg. No. INH000000412
There are no material disciplinary action that been taken by any regulatory authority impacting equity research analysis activities
Analyst Certification
The views expressed in this research report accurately reflect the personal views of the analyst(s) about the subject securities or issues, and no part of the compensation of the research analyst(s) was, is, or will be directly or
indirectly related to the specific recommendations and views expressed by research analyst(s) in this report. The research analysts, strategists, or research associates principally responsible for preparation of MOSt research receive
compensation based upon various factors, including quality of research, investor client feedback, stock picking, competitive factors and firm revenues
Disclosure of Interest Statement
Analyst ownership of the stock
Served as an officer, director or employee
RADICO KHAITAN
No
No
A graph of daily closing prices of securities is available at www.nseindia.com and http://economictimes.indiatimes.com/markets/stocks/stock-quotes
Regional Disclosures (outside India)
For U.S.
This report is not directed or intended for distribution to or use by any person or entity resident in a state, country or any jurisdiction, where such distribution, publication, availability or use would be contrary to law, regulation or which
would subject MOSt & its group companies to registration or licensing requirements within such jurisdictions.
Motilal Oswal Securities Limited (MOSL) is not a registered broker - dealer under the U.S. Securities Exchange Act of 1934, as amended (the"1934 act") and under applicable state laws in the United States. In addition MOSL is not a
registered investment adviser under the U.S. Investment Advisers Act of 1940, as amended (the "Advisers Act" and together with the 1934 Act, the "Acts), and under applicable state laws in the United States. Accordingly, in the
absence of specific exemption under the Acts, any brokerage and investment services provided by MOSL, including the products and services described herein are not available to or intended for U.S. persons.
This report is intended for distribution only to "Major Institutional Investors" as defined by Rule 15a-6(b)(4) of the Exchange Act and interpretations thereof by SEC (henceforth referred to as "major institutional investors"). This
document must not be acted on or relied on by persons who are not major institutional investors. Any investment or investment activity to which this document relates is only available to major institutional investors and will be
engaged in only with major institutional investors. In reliance on the exemption from registration provided by Rule 15a-6 of the U.S. Securities Exchange Act of 1934, as amended (the "Exchange Act") and interpretations thereof by
the U.S. Securities and Exchange Commission ("SEC") in order to conduct business with Institutional Investors based in the U.S., MOSL has entered into a chaperoning agreement with a U.S. registered broker-dealer, Motilal Oswal
Securities International Private Limited. ("MOSIPL"). Any business interaction pursuant to this report will have to be executed within the provisions of this chaperoning agreement.
The Research Analysts contributing to the report may not be registered /qualified as research analyst with FINRA. Such research analyst may not be associated persons of the U.S. registered broker-dealer, MOSIPL, and therefore,
may not be subject to NASD rule 2711 and NYSE Rule 472 restrictions on communication with a subject company, public appearances and trading securities held by a research analyst account.
For Hong Kong:
This report is distributed in Hong Kong by Motilal Oswal capital Markets (Hong Kong) Private Limited, a licensed corporation (CE AYY-301) licensed and regulated by the Hong Kong Securities and Futures Commission (SFC)
pursuant to the Securities and Futures Ordinance (Chapter 571 of the Laws of Hong Kong) “SFO”. As per SEBI (Research Analyst Regulations) 2014 Motilal Oswal Securities (SEBI Reg No. INH000000412) has an agreement with
Motilal Oswal capital Markets (Hong Kong) Private Limited for distribution of research report in Kong Kong. This report is intended for distribution only to “Professional Investors” as defined in Part I of Schedule 1 to SFO. Any
investment or investment activity to which this document relates is only available to professional investor and will be engaged only with professional investors.”
Nothing here is an offer or solicitation of these securities, products and services in any jurisdiction where their offer or sale is not qualified or exempt from registration. The Indian Analyst(s) who compile this report is/are not located in
Hong Kong & are not conducting Research Analysis in Hong Kong.
Motilal Oswal Capital Markets Singapore Pte Limited is acting as an exempt financial advisor under section 23(1)(f) of the Financial Advisers Act(FAA) read with regulation 17(1)(d) of the Financial Advisors Regulations and is a
subsidiary of Motilal Oswal Securities Limited in India. This research is distributed in Singapore by Motilal Oswal Capital Markets Singapore Pte Limited and it is only directed in Singapore to accredited investors, as defined in the
Financial Advisers Regulations and the Securities and Futures Act (Chapter 289), as amended from time to time.
In respect of any matter arising from or in connection with the research you could contact the following representatives of Motilal Oswal Capital Markets Singapore Pte Limited:
Kadambari Balachandran
Email : kadambari.balachandran@motilaloswal.com
Contact : (+65) 68189233 / 65249115
Office Address : 21 (Suite 31),16 Collyer Quay,Singapore 04931
For Singapore
5 February 2016
Motilal Oswal Tower, Level 9, Sayani Road, Prabhadevi, Mumbai 400 025
Phone: +91 22 3982 5500 E-mail: reports@motilaloswal.com
Motilal Oswal Securities Ltd
8