Ipca Laboratories
BSE SENSEX
24,287
Bloomberg
Equity Shares (m)
M.Cap.(INRb)/(USDb)
52-Week Range (INR)
1, 6, 12 Rel. Per (%)
Avg Val, (INR m)
Free float (%)
S&P CNX
7,387
IPCA IN
126.2
81.7 / 1.2
888/560
-2/-2/20
202
54.1
8 February 2016
Q3FY16 Results Update | Sector: Healthcare
CMP: INR647
TP: INR680 (+5%)
Neutral
Significant miss, US FDA resolution remains a key
Financials & Valuation (INR b)
Y/E Mar
2015 2016E 2017E
Net Sales
31.4
29.2
35.4
EBITDA
5.3
3.7
6.5
PAT
2.5
1.4
3.3
EPS (INR)
19.8
10.9
26.0
Gr. (%)
-47.7 -44.9 137.7
BV/Sh (INR)
175.0 181.8 203.9
RoE (%)
12.0
6.1
13.5
RoCE (%)
14.2
6.9
13.7
P/E (x)
32.7
59.2
24.9
P/BV (x)
3.7
3.6
3.2
Estimate change
TP change
Rating change
-12-14%
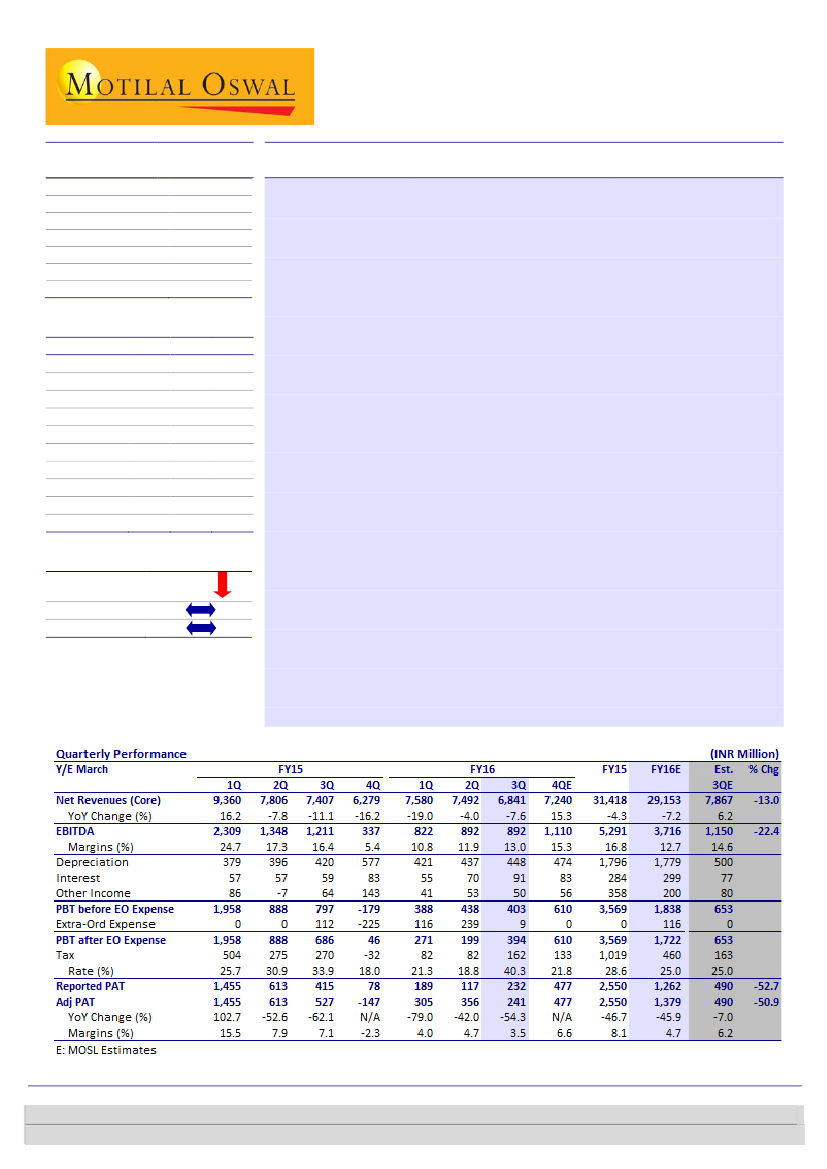
IPCA’s 3Q PAT at INR232m (54%YoY decline) was significantly below expectations
due to sharp revenue disappointment (@INR6.8b, 13% miss) and inventory write of
INR240m. EBITDA also declined 26%YoY (22% miss), driven by negative operating
leverage and inventory write offs in 3Q.
Revenue recovery remained sluggish:
US business sales stood at INR220m led
by resumption of HCQ supplies in 3Q. The company has guided for steady ramp up
in the US sales going ahead. However, absence of Global fund contracts affected
institutional business as it declined 71%YoY to INR240m. Even though global fund
tenders sales are expected to pick up from next quarter, there has been significant
price erosion (~60%) in these contracts; as a result, ramp up would be much slower
than earlier estimates. India formulation business, affected by restructuring of
various marketing divisions and lower malaria sales; it grew 11%YoY to INR3.1b.
Branded promotional business declined 19%YoY to INR600m, driven by steep
currency depreciation in key markets.
Inventory write off affects profitability:
3Q EBITDA margins at 13% (down
340bp YoY) was a significant miss due to (a) lower revenues (hurt operating
leverage) and (b) inventory write-off worth INR240m during this quarter. Adjusted
for write offs, EBITDA margins stood at ~16% in 3Q.
Balanced risk-reward, earnings turnaround largely factored:
Post 3Q miss,
we cut our FY17/18E EPS est. by 14/12% respectively mainly on delay in US FDA
resolution and slower ramp up in Institutional business. At CMP, stock trades at
25x/16x FY17E/18E EPS, at a discount to 3 year average P/E. We believe that an
earnings rebound (26% EPS CAGR) is largely factored in. However, early resolution
of the USFDA-banned facilities could provide further trigger to our estimates.
Retain
Neutral
on IPCA with target price of INR680 (17x FY18E, 20% discount to
mid-cap peers).
Key risks:
Delay in resolving regulatory issues and slower market
share gains in US (on exempted products).
Kumar Saurabh
(Kumar.Saurabh@MotilalOswal.com); +91 22 3982 5584
Amey Chalke
(amey.chalke@motilaloswal.com); +91 22 39825423
Investors are advised to refer through important disclosures made at the last page of the Research Report.
Motilal Oswal research is available on www.motilaloswal.com/Institutional-Equities, Bloomberg, Thomson Reuters, Factset and S&P Capital.

Ipca Laboratories
Operating metrics
Exhibit 1: Key operating metrics
4QFY13 1QFY14
Revenue Mix (%)
India
Exports branded
Exports generics
Inst. business
API
Revenue Gr. (%)
India
Exports branded
Exports generics
Inst. business
API
As % of sales
Raw material
Staff cost
Other expenses
Tax Rate
Margins (%)
Gross Margins
EBITDA Margins
EBIT Margins
PAT margins
2QFY14
3QFY14 4QFY14
1QFY15
2QFY15 3QFY15
4QFY15
1QFY16
2QFY16 3QFY16
27.1
11.0
22.0
14.5
25.4
19.1
20.8
10.0
38.0
40.0
0.6
31.6
9.2
21.8
10.6
26.8
25.7
11.7
(3.2)
45.4
39.0
16.9
33.1
10.1
21.2
12.1
23.4
10.1
5.1
11.6
32.0
(21.7)
25.6
30.2
12.3
17.9
16.7
22.9
17.7
15.8
14.4
25.2
19.8
15.3
26.6
13.0
21.8
15.6
23.0
12.3
10.2
32.8
11.0
21.4
1.7
31.6
12.5
17.0
12.2
26.6
17.1
17.1
58.6
(8.5)
35.4
16.5
42.3
13.0
22.0
4.6
18.2
(7.1)
18.7
18.9
(3.6)
(65.2)
(28.0)
38.0
10.1
18.4
11.2
20.5
(9.9)
13.1
(26.1)
(7.3)
(39.7)
(19.6)
36.8
10.5
23.3
4.7
24.7
(15.8)
16.5
(32.0)
(9.8)
(74.6)
(9.7)
42.4
7.3
18.6
4.0
27.7
(19.1)
8.5
(52.5)
(11.6)
(73.6)
(15.8)
44.8
6.6
17.9
6.4
24.4
(4.7)
0.9
(51.8)
(22.6)
33.2
28.2
45.7
8.9
20.4
3.6
21.4
(8.2)
10.7
(18.9)
1.8
(70.7)
(3.8)
39.2
13.5
27.7
39.9
60.8
21.2
18.3
11.5
40.7
14.4
24.7
25.4
59.3
21.2
18.5
9.0
34.0
14.5
24.9
23.4
66.0
27.7
25.1
15.5
34.1
15.3
26.2
26.5
65.9
26.1
23.5
17.1
32.7
16.0
27.9
21.5
67.3
24.3
21.1
18.5
36.9
15.0
24.1
25.7
63.1
24.7
20.8
15.7
35.0
17.7
30.6
30.9
65.0
17.3
12.3
7.9
37.0
18.0
26.0
39.4
63.0
16.4
10.8
5.7
41.2
20.7
33.5
15.0
58.8
5.4
(3.9)
(2.4)
39.6
21.0
29.4
15.0
60.4
10.8
5.3
4.4
38.0
19.8
31.6
15.0
62.0
11.9
6.2
5.0
37.2
22.0
29.0
40.3
62.8
13.0
6.6
3.6
Source: Company; MOSL
8 February 2016
2

Ipca Laboratories
Valuation and view
Concerns on Form 483 issued at API facility (Ratlam), subsequent stoppage of US
sales and recent import alert (on Ratlam facility) have led to sharp stock correction
in the last 12-14 months. IPCA is currently trading at 25x FY17E and 16x FY18E EPS,
at a discount to 3 year average trading history. We believe that an earnings rebound
is largely factored in.
Our target price implies limited upside
We value IPCA on a target 1-year forward P/E multiple basis, the same methodology
we use for other pharmaceutical stocks in our coverage. Our target price of INR 680
values the company at P/E multiple of 17x on FY18E EPS. With limited upside
potential, we retain our Neutral rating. Our target multiple is;
At 20-25% discount to industry peers target multiple (i.e 22x), factoring
overhang of regulatory issues
Implies a PEG of 0.6x, which is better than the sector average of 0.9x
At a discount to 3 year average trading history.
Key catalysts to drive stock’s performance over the medium term are
Higher than expected recovery in US sales, led by sharp price hikes in key
product (Hydroxychloroquine sulfate)
Rebound in Institutional business (anti-malarial tender), accounting for 9% of
sales
Improvement in domestic business growth trajectory, with focus on new
therapy introductions in chronic segments.
Key risks to our investment thesis
Lack of regulatory clearance by other regulators would impact export business
outlook (60% of sales).
Continued weakness in emerging market currency could impair growth
prospects. Branded generic formulation exports account for 10% of business.
Further addition of drugs in DPCO coverage could hurt domestic business.
Avg(x)
Exhibit 2: IPCA’s 10 year avg at 18x
53
43
33
23
13
3
18.2
14.0
PE (x)
Median(x)
Peak(x)
Min(x)
47.2
Exhibit 3: IPCA trades at 54% premium to Sensex PE
180
120
60
24.3
0
-60
-120
6.3
IPCA Labs. PE Relative to Sensex PE (%)
LPA (%)
53.5
4.0
Source: Company; MOSL
8 February 2016
3

Ipca Laboratories
Story in charts
Exhibit 1: Sales trend
Sales (INR b)
20
27
10
19
12
16
-8
-11
-4
-16 -19
-8
YoY Growth (%)
21
Exhibit 2: Domestic business picks up
Domestic formulations (INR b)
12
16
5
10
17
19
13
16
YoY Growth (%)
8
11
1
6.7 8.1 8.5 8.3 7.5 9.4 7.8 7.4 6.3 7.6 7.5 6.8
1.8 2.5 2.8 2.5 2.0 2.9 3.3 2.8 2.3 3.2 3.3 3.1
Source: Company, MOSL
Exhibit 3: Exports formulations impacted by US issues
Export formulations (INR b)
47
31
7
20
19
18
-16 -20
YoY Growth (%)
Exhibit 4: API business disappoints in 3Q
APIs (INR b)
17
1
26
15
2
-28
-20
17
-10
-4
-16
YoY Growth (%)
28
-26 -27
-36
3.1 3.3 3.6 3.8 3.7 3.9 3.1 3.1 2.4 2.2 2.3 2.2
1.7 2.1 2.0 1.9 1.7 2.5 1.4 1.5 1.5 2.1 1.8 1.4
Source: Company, MOSL
Exhibit 5: Sales to grow at 12% CAGR over low base
Formulation (INR b)
API (INR b)
Exhibit 6: Margins on recovery path
EBITDA (INR b)
21
13
21
28
26
24
25
17
EBITDA Margin (%)
16
5
11
FY10
5
14
FY11
6
17
FY12
7
8
8
8
10
5
11
12
13
1.4 1.7 2.3 2.2 1.8 2.3 1.3 1.2 0.3 0.8 0.9 0.9
20
FY13
24
FY14
23
20
25
30
FY15 FY16E FY17E FY18E
Source: Company, MOSL
8 February 2016
4

Ipca Laboratories
Exhibit 7: Generic exports to recover with resumption of US
supplies
Exhibit 8: Domestic revenue to growth at healthy rate
Pure generic exports (INR m)
30.2
10.6
25.6
33.1
16.3
Growth (%)
25.4
22.7
23.6
16.5
8.2
9
12
6
FY10
7
FY11
8
FY12
9
FY13
16.6
10.4
16.4
8.0
11
12
14
16
15.0
15.0
DF Revenues (INR b)
Growth (%)
-41.0
4
5
8
9
11
9
-39.9
7
10
FY14
FY10 FY11 FY12 FY13E FY14 FY15 FY16E FY17E FY18E
Source:
FY15 FY16E FY17E FY18E
Source:
Exhibit 9: EBITDA growth to recover in FY17
EBITDA (INR b)
21.3
21.8
22.2
24.7
16.8
12.7
5
6
8
5
4
7
18.4
21.0
EBITDA Margin (%)
Exhibit 10: Gross margins v/s EBITDA margins
Gross Margin (%)
61.3
61.0
65.4
EBITDA Margin (%)
63.2
61.9
63.9
63.9
19.8
58.7
59.1
9
21.3
19.8
21.8
22.2
24.7
16.8
18.4
21.0
3
FY10
4
FY11
FY12
FY13
FY14
FY15 FY16E FY17E FY18E
Source: Company, MOSL
FY10 FY11 FY12 FY13 FY14 FY15 FY16E FY17E FY18E
Source: Company, MOSL
Exhibit 11: Earnings to grow at 27% CAGR
Core EPS (INR/ share)
Exhibit 12: Earnings recovery to aid return ratios
RoCE (%)
24.5
27.8
25.6
24.1
27.4
24.0
25.2
27.2
23.0
14.2
13.7
18.4
18.1
29.4
RoE (%)
17
21
22
26
38
20
11
26
40
FY10
FY11
FY12
FY13
FY14
FY10 FY11 FY12 FY13 FY14 FY15 FY16E FY17E FY18E
Source: Company, MOSL
13.5
12.0
FY15 FY16E FY17E FY18E
Source: Company, MOSL
8 February 2016
5

Ipca Laboratories
Financials and Valuation
Income Statement
Y/E Mar
Net Sales
Change (%)
EBITDA
EBITDA Margin (%)
Depreciation
EBIT
Interest
Other Income
Extraordinary items
PBT
Tax
Tax Rate (%)
Min. Int. & Assoc. Share
Reported PAT
Adjusted PAT
Change (%)
2011
18,969
21.4
3,761
19.8
558
3,203
314
518
0
3,407
784
23.0
-5
2,628
2,628
26.2
2011
251
10,265
10,516
5,308
807
16,631
9,884
2,892
6,992
1,132
408
10,586
4,664
4,637
104
1,182
2,493
2,073
420
8,093
16,625
2012
23,587
24.3
5,135
21.8
671
4,464
413
-408
0
3,643
881
24.2
-9
2,771
2,771
5.4
2012
252
12,288
12,540
5,326
932
18,798
13,386
3,945
9,441
945
341
12,547
6,699
3,491
122
2,235
4,475
4,099
377
8,071
18,798
2013
28,131
19.3
6,232
22.2
867
5,365
334
-488
0
4,543
1,299
28.6
8
3,236
3,236
16.8
2013
252
15,285
15,538
5,234
1,304
22,075
15,791
4,748
11,042
1,292
90
14,545
7,410
4,178
582
2,374
4,894
4,351
544
9,651
22,075
2014
32,818
16.7
8,106
24.7
1,031
7,074
269
-500
0
6,306
1,524
24.2
-3
4,785
4,785
47.9
2014
252
19,344
19,597
4,379
1,471
25,447
19,321
5,785
13,536
1,649
92
16,827
8,476
4,495
763
3,093
6,656
5,950
706
10,171
25,447
2015
31,418
-4.3
5,291
16.8
1,796
3,495
284
358
42
3,611
1,019
28.2
49
2,542
2,501
-47.7
2015
252
21,832
22,084
8,286
1,743
32,113
25,463
7,459
18,004
2,672
162
17,285
9,266
3,530
1,248
3,242
6,011
5,471
540
11,275
32,113
2016E
29,153
-7.2
3,716
12.7
1,779
1,937
299
200
-364
1,474
460
31.2
0
1,015
1,379
-44.9
2016E
252
22,694
22,947
8,774
1,780
33,500
29,963
9,238
20,725
2,672
162
15,439
7,570
4,144
1,255
2,470
5,499
4,941
558
9,941
33,500
2017E
35,419
21.5
6,504
18.4
2,231
4,273
317
300
0
4,256
979
23.0
0
3,277
3,277
137.7
2017E
252
25,480
25,733
9,335
1,822
36,890
34,463
11,469
22,994
2,672
162
17,739
9,194
5,033
319
3,194
6,678
6,000
677
11,061
36,890
(INR Million)
2018E
42,987
21.4
9,036
21.0
2,546
6,490
338
420
0
6,572
1,512
23.0
0
5,060
5,060
54.4
Balance Sheet
Y/E Mar
Share Capital
Reserves
Net Worth
Debt
Deferred Tax
Total Capital Employed
Gross Fixed Assets
Less: Acc Depreciation
Net Fixed Assets
Capital WIP
Investments
Current Assets
Inventory
Debtors
Cash & Bank
Loans & Adv, Others
Curr Liabs & Provns
Curr. Liabilities
Provisions
Net Current Assets
Total Assets
(INR Million)
2018E
252
29,781
30,034
9,980
1,888
41,902
38,963
14,015
24,949
2,672
162
22,222
11,155
6,106
1,086
3,875
8,102
7,280
822
14,120
41,902
8 February 2016
6

Ipca Laboratories
Financials and valuation
Ratios
Y/E Mar
Basic (INR)
EPS
Cash EPS
Book Value
DPS
Payout (incl. Div. Tax.)
Valuation(x)
P/E
Cash P/E
Price / Book Value
EV/Sales
EV/EBITDA
Dividend Yield (%)
Profitability Ratios (%)
RoE
RoCE
Turnover Ratios (%)
Asset Turnover (x)
Debtors (No. of Days)
Inventory (No. of Days)
Creditors (No. of Days)
Net Debt/Equity (x)
2011
20.9
25.3
83.7
3.7
17.9
2012
22.0
27.3
99.4
3.7
17.0
2013
25.6
32.5
123.1
4.7
18.1
2014
37.9
46.1
155.3
5.9
15.4
17.1
14.0
4.2
2.7
11.0
0.9
27.4
25.6
1.9
87
90
58
0.5
2011
3,761
517
-1,203
-770
0
2,307
-1,821
486
-83
0
-1,904
1
762
-314
-856
-407
-4
108
104
24.0
24.1
1.8
54
104
95
0.4
2012
5,135
-408
39
-757
0
4,010
-3,315
695
68
0
-3,247
1
25
-413
-357
-744
18
104
122
23.0
25.2
1.8
54
96
83
0.3
2013
6,232
-488
-1,119
-927
0
3,698
-2,752
946
251
0
-2,501
0
-93
-334
-309
-736
461
122
582
27.2
29.4
1.7
50
94
100
0.2
2014
8,106
-500
-339
-1,357
0
5,910
-3,887
2,023
-1
0
-3,888
0
-854
-269
-718
-1,841
180
582
763
2015
19.8
34.4
175.0
1.0
4.9
32.7
18.8
3.7
2.9
17.5
0.2
12.0
14.2
1.2
41
108
87
0.3
2015
5,291
358
-619
-747
42
4,324
-7,166
-2,842
-70
0
-7,236
0
3,906
-284
-224
3,398
486
763
1,248
2016E
10.9
22.1
181.8
1.2
15.0
59.2
29.2
3.6
2.7
15.1
0.2
6.1
6.9
1.0
51
95
79
0.3
2016E
3,716
200
1,341
-423
-364
4,470
-4,500
-30
0
0
-4,500
0
488
-299
-152
37
7
1,248
1,255
2017E
26.0
43.6
203.9
3.9
15.0
24.9
14.8
3.2
2.3
11.9
0.6
13.5
13.7
1.0
51
95
85
0.4
2017E
6,504
300
-2,057
-936
0
3,811
-4,500
-689
0
0
-4,500
0
561
-317
-492
-247
-936
1,255
319
2018E
40.1
60.3
238.0
6.0
15.0
16.1
10.7
2.7
2.3
11.9
0.9
18.1
18.4
1.1
51
95
87
0.3
Cash Flow Statement
Y/E Mar
Adjusted EBITDA
Non cash opr. exp (inc)
(Inc)/Dec in Wkg. Cap.
Tax Paid
Other operating activities
CF from Op. Activity
(Inc)/Dec in FA & CWIP
Free cash flows
(Pur)/Sale of Invt
Others
CF from Inv. Activity
Inc/(Dec) in Net Worth
Inc / (Dec) in Debt
Interest Paid
Divd Paid (incl Tax) & Others
CF from Fin. Activity
Inc/(Dec) in Cash
Add: Opening Balance
Closing Balance
(INR Million)
2018E
9,036
420
-2,291
-1,446
0
5,719
-4,500
1,219
0
0
-4,500
0
645
-338
-759
-452
767
319
1,086
8 February 2016
7

Ipca Laboratories
Corporate profile
Company description
Established in 1949, IPCA Labs is one of India's better
managed mid-sized pharma companies. It has
presence in (1) domestic branded formulations, (2)
global branded and generic formulations, and (3)
global APIs (active pharmaceutical ingredients).
IPCA's core business strategy is to leverage its
strength in manufacturing API to develop vertically
integrated and highly competitive formulations.
Most of the company's formulations are backed by
its own APIs.
Exhibit 2: Shareholding pattern (%)
Promoter
DII
FII
Others
Sep-15
45.9
14.7
15.8
23.5
Jun-15
45.9
14.4
19.9
19.7
Sep-14
45.9
11.6
24.2
18.3
Exhibit 1: Sensex rebased
Source: MOSL/Bloomberg
Exhibit 3: Top holders
Holder Name
HDFC Trustee Company Ltd
Lavender Investments Limited
DSP Blackrock
Dendana Investments (Mauritius) Ltd
ICICI Prudential
% Holding
4.3
4.0
2.3
2.2
1.8
Source: Capitaline
Note: FII Includes depository receipts
Source: Capitaline
Exhibit 4: Top management
Name
Premchand Godha
A K Jain
Harish P Kamath
Designation
Chairman
&
Managing
Director
Joint Managing Director
Company Secretary
Exhibit 5: Directors
Name
Anand T Kusre
Dev Parkash Yadava
Pranay Godha
Ramakanta Panda
Name
Babulal Jain
Manish Premnath
Prashant Godha
Source: Capitaline
Exhibit 6: Auditors
Name
ABK & Associates
Natvarlal Vepari & Co
Parikh & Associates
Type
Cost Auditor
Statutory
Secretarial Audit
Exhibit 7: MOSL forecast v/s consensus
EPS
(INR)
FY16
FY17
FY18
MOSL
forecast
10.9
26.0
40.1
Consensus
forecast
18.1
35.0
48.0
Variation (%)
-39.8
-25.9
-16.5
Source: Bloomberg
Source: Capitaline
8 February 2016
8

Ipca Laboratories
NOTES
8 February 2016
9

Disclosures
This document has been prepared by Motilal Oswal Securities Limited (hereinafter referred to as Most) to provide information about the company(ies) and/sector(s), if any, covered in the report and may be distributed by it and/or its
affiliated company(ies). This report is for personal information of the selected recipient/s and does not construe to be any investment, legal or taxation advice to you. This research report does
Ipca Laboratories
or
not constitute an offer, invitation
inducement to invest in securities or other investments and Motilal Oswal Securities Limited (hereinafter referred as MOSt) is not soliciting any action based upon it. This report is not for public distribution and has been furnished to
you solely for your general information and should not be reproduced or redistributed to any other person in any form. This report does not constitute a personal recommendation or take into account the particular investment
objectives, financial situations, or needs of individual clients. Before acting on any advice or recommendation in this material, investors should consider whether it is suitable for their particular circumstances and, if necessary, seek
professional advice. The price and value of the investments referred to in this material and the income from them may go down as well as up, and investors may realize losses on any investments. Past performance is not a guide for
future performance, future returns are not guaranteed and a loss of original capital may occur.
MOSt and its affiliates are a full-service, integrated investment banking, investment management, brokerage and financing group. We and our affiliates have investment banking and other business relationships with a some
companies covered by our Research Department. Our research professionals may provide input into our investment banking and other business selection processes. Investors should assume that MOSt and/or its affiliates are
seeking or will seek investment banking or other business from the company or companies that are the subject of this material and that the research professionals who were involved in preparing this material may educate investors
on investments in such business. The research professionals responsible for the preparation of this document may interact with trading desk personnel, sales personnel and other parties for the purpose of gathering, applying and
interpreting information. Our research professionals are paid on the profitability of MOSt which may include earnings from investment banking and other business.
MOSt generally prohibits its analysts, persons reporting to analysts, and members of their households from maintaining a financial interest in the securities or derivatives of any companies that the analysts cover. Additionally, MOSt
generally prohibits its analysts and persons reporting to analysts from serving as an officer, director, or advisory board member of any companies that the analysts cover. Our salespeople, traders, and other professionals or affiliates
may provide oral or written market commentary or trading strategies to our clients that reflect opinions that are contrary to the opinions expressed herein, and our proprietary trading and investing businesses may make investment
decisions that are inconsistent with the recommendations expressed herein. In reviewing these materials, you should be aware that any or all of the foregoing among other things, may give rise to real or potential conflicts of interest.
MOSt and its affiliated company(ies), their directors and employees and their relatives may; (a) from time to time, have a long or short position in, act as principal in, and buy or sell the securities or derivatives thereof of companies
mentioned herein. (b) be engaged in any other transaction involving such securities and earn brokerage or other compensation or act as a market maker in the financial instruments of the company(ies) discussed herein or act as an
advisor or lender/borrower to such company(ies) or may have any other potential conflict of interests with respect to any recommendation and other related information and opinions.; however the same shall have no bearing
whatsoever on the specific recommendations made by the analyst(s), as the recommendations made by the analyst(s) are completely independent of the views of the affiliates of MOSt even though there might exist an inherent
conflict of interest in some of the stocks mentioned in the research report
Reports based on technical and derivative analysis center on studying charts company's price movement, outstanding positions and trading volume, as opposed to focusing on a company's fundamentals and, as such, may not match
with a report on a company's fundamental analysis. In addition MOST has different business segments / Divisions with independent research separated by Chinese walls catering to different set of customers having various
objectives, risk profiles, investment horizon, etc, and therefore may at times have different contrary views on stocks sectors and markets.
Unauthorized disclosure, use, dissemination or copying (either whole or partial) of this information, is prohibited. The person accessing this information specifically agrees to exempt MOSt or any of its affiliates or employees from, any
and all responsibility/liability arising from such misuse and agrees not to hold MOSt or any of its affiliates or employees responsible for any such misuse and further agrees to hold MOSt or any of its affiliates or employees free and
harmless from all losses, costs, damages, expenses that may be suffered by the person accessing this information due to any errors and delays. The information contained herein is based on publicly available data or other sources
believed to be reliable. Any statements contained in this report attributed to a third party represent MOSt’s interpretation of the data, information and/or opinions provided by that third party either publicly or through a subscription
service, and such use and interpretation have not been reviewed by the third party. This Report is not intended to be a complete statement or summary of the securities, markets or developments referred to in the document. While we
would endeavor to update the information herein on reasonable basis, MOSt and/or its affiliates are under no obligation to update the information. Also there may be regulatory, compliance, or other reasons that may prevent MOSt
and/or its affiliates from doing so. MOSt or any of its affiliates or employees shall not be in any way responsible and liable for any loss or damage that may arise to any person from any inadvertent error in the information contained in
this report. MOSt or any of its affiliates or employees do not provide, at any time, any express or implied warranty of any kind, regarding any matter pertaining to this report, including without limitation the implied warranties of
merchantability, fitness for a particular purpose, and non-infringement. The recipients of this report should rely on their own investigations.
This report is intended for distribution to institutional investors. Recipients who are not institutional investors should seek advice of their independent financial advisor prior to taking any investment decision based on this report or for
any necessary explanation of its contents.
Most and it’s associates may have managed or co-managed public offering of securities, may have received compensation for investment banking or merchant banking or brokerage services, may have received any compensation for
products or services other than investment banking or merchant banking or brokerage services from the subject company in the past 12 months.
Most and it’s associates have not received any compensation or other benefits from the subject company or third party in connection with the research report.
Subject Company may have been a client of Most or its associates during twelve months preceding the date of distribution of the research report
MOSt and/or its affiliates and/or employees may have interests/positions, financial or otherwise of over 1 % at the end of the month immediately preceding the date of publication of the research in the securities mentioned in this
report. To enhance transparency, MOSt has incorporated a Disclosure of Interest Statement in this document. This should, however, not be treated as endorsement of the views expressed in the report.
Motilal Oswal Securities Limited is registered as a Research Analyst under SEBI (Research Analyst) Regulations, 2014. SEBI Reg. No. INH000000412
There are no material disciplinary action that been taken by any regulatory authority impacting equity research analysis activities
Analyst Certification
The views expressed in this research report accurately reflect the personal views of the analyst(s) about the subject securities or issues, and no part of the compensation of the research analyst(s) was, is, or will be directly or
indirectly related to the specific recommendations and views expressed by research analyst(s) in this report. The research analysts, strategists, or research associates principally responsible for preparation of MOSt research receive
compensation based upon various factors, including quality of research, investor client feedback, stock picking, competitive factors and firm revenues
Disclosure of Interest Statement
Analyst ownership of the stock
Served as an officer, director or employee
IPCA LABORATORIES
No
No
A graph of daily closing prices of securities is available at www.nseindia.com and http://economictimes.indiatimes.com/markets/stocks/stock-quotes
Regional Disclosures (outside India)
For U.S.
This report is not directed or intended for distribution to or use by any person or entity resident in a state, country or any jurisdiction, where such distribution, publication, availability or use would be contrary to law, regulation or which
would subject MOSt & its group companies to registration or licensing requirements within such jurisdictions.
Motilal Oswal Securities Limited (MOSL) is not a registered broker - dealer under the U.S. Securities Exchange Act of 1934, as amended (the"1934 act") and under applicable state laws in the United States. In addition MOSL is not a
registered investment adviser under the U.S. Investment Advisers Act of 1940, as amended (the "Advisers Act" and together with the 1934 Act, the "Acts), and under applicable state laws in the United States. Accordingly, in the
absence of specific exemption under the Acts, any brokerage and investment services provided by MOSL, including the products and services described herein are not available to or intended for U.S. persons.
This report is intended for distribution only to "Major Institutional Investors" as defined by Rule 15a-6(b)(4) of the Exchange Act and interpretations thereof by SEC (henceforth referred to as "major institutional investors"). This
document must not be acted on or relied on by persons who are not major institutional investors. Any investment or investment activity to which this document relates is only available to major institutional investors and will be
engaged in only with major institutional investors. In reliance on the exemption from registration provided by Rule 15a-6 of the U.S. Securities Exchange Act of 1934, as amended (the "Exchange Act") and interpretations thereof by
the U.S. Securities and Exchange Commission ("SEC") in order to conduct business with Institutional Investors based in the U.S., MOSL has entered into a chaperoning agreement with a U.S. registered broker-dealer, Motilal Oswal
Securities International Private Limited. ("MOSIPL"). Any business interaction pursuant to this report will have to be executed within the provisions of this chaperoning agreement.
The Research Analysts contributing to the report may not be registered /qualified as research analyst with FINRA. Such research analyst may not be associated persons of the U.S. registered broker-dealer, MOSIPL, and therefore,
may not be subject to NASD rule 2711 and NYSE Rule 472 restrictions on communication with a subject company, public appearances and trading securities held by a research analyst account.
For Hong Kong:
This report is distributed in Hong Kong by Motilal Oswal capital Markets (Hong Kong) Private Limited, a licensed corporation (CE AYY-301) licensed and regulated by the Hong Kong Securities and Futures Commission (SFC)
pursuant to the Securities and Futures Ordinance (Chapter 571 of the Laws of Hong Kong) “SFO”. As per SEBI (Research Analyst Regulations) 2014 Motilal Oswal Securities (SEBI Reg No. INH000000412) has an agreement with
Motilal Oswal capital Markets (Hong Kong) Private Limited for distribution of research report in Kong Kong. This report is intended for distribution only to “Professional Investors” as defined in Part I of Schedule 1 to SFO. Any
investment or investment activity to which this document relates is only available to professional investor and will be engaged only with professional investors.”
Nothing here is an offer or solicitation of these securities, products and services in any jurisdiction where their offer or sale is not qualified or exempt from registration. The Indian Analyst(s) who compile this report is/are not located in
Hong Kong & are not conducting Research Analysis in Hong Kong.
Motilal Oswal Capital Markets Singapore Pte Limited is acting as an exempt financial advisor under section 23(1)(f) of the Financial Advisers Act(FAA) read with regulation 17(1)(d) of the Financial Advisors Regulations and is a
subsidiary of Motilal Oswal Securities Limited in India. This research is distributed in Singapore by Motilal Oswal Capital Markets Singapore Pte Limited and it is only directed in Singapore to accredited investors, as defined in the
Financial Advisers Regulations and the Securities and Futures Act (Chapter 289), as amended from time to time.
In respect of any matter arising from or in connection with the research you could contact the following representatives of Motilal Oswal Capital Markets Singapore Pte Limited:
Kadambari Balachandran
Email : kadambari.balachandran@motilaloswal.com
Contact : (+65) 68189233 / 65249115
Office Address : 21 (Suite 31),16 Collyer Quay,Singapore 04931
For Singapore
8 February 2016
Motilal Oswal Tower, Level 9, Sayani Road, Prabhadevi, Mumbai 400 025
Phone: +91 22 3982 5500 E-mail: reports@motilaloswal.com
Motilal Oswal Securities Ltd
10